
Last active
December 3, 2021 01:20
-
-
Save helgasoft/5a034689fbe8c5c0804679a4e7053aa5 to your computer and use it in GitHub Desktop.
R | ECharts | regression lines on data groups
This file contains hidden or bidirectional Unicode text that may be interpreted or compiled differently than what appears below. To review, open the file in an editor that reveals hidden Unicode characters.
Learn more about bidirectional Unicode characters
| # draw regression lines on data groups with echarty | |
| # see https://echarts.apache.org/en/option.html#dataset.fromDatasetIndex | |
| # see https://echarts.apache.org/en/option.html#series-line.datasetIndex | |
| library(echarty); library(dplyr) | |
| linecolor <- c('blue','green','brown') # color of regression lines | |
| p <- iris %>% group_by(Species) %>% | |
| ec.init(js = 'echarts.registerTransform(ecStat.transform.regression);') # load ecStat | |
| # add transformations and regression lines to preset scatter groups | |
| for(i in 1:length(unique(iris$Species))) { | |
| p$x$opts$dataset <- append(p$x$opts$dataset, | |
| list(list(transform=list(type='ecStat:regression'), fromDatasetIndex=i ))) | |
| p$x$opts$series <- append(p$x$opts$series, | |
| list(list(type='line', symbolSize=0.01, color=linecolor[i], datasetIndex=i+3 ))) | |
| } | |
| p$x$opts$xAxis <- list(min=4) | |
| p |

Author
Author
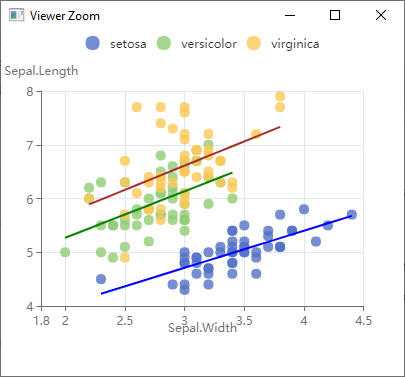
Switch positions of X and Y to show regression lines better.
library(echarty); library(dplyr)
linecolor <- c('blue','green','brown')    # color of regression lines

p <- iris |> relocate(Sepal.Width) |> group_by(Species) |>
  ec.init(js = 'echarts.registerTransform(ecStat.transform.regression);')    # load ecStat
# add transformations and regression lines to preset scatter groups
# see API https://echarts.apache.org/en/option.html#dataset.transform
for(i in 1:length(unique(iris$Species))) {
  p$x$opts$dataset <- append(p$x$opts$dataset,
                             list(list(transform=list(type='ecStat:regression'), fromDatasetIndex=i )))
  p$x$opts$series <- append(p$x$opts$series,
                            list(list(type='line', symbolSize=0.01, color=linecolor[i], datasetIndex=i+3 )))
}
p$x$opts$xAxis <- list(min=1.8, name='Sepal.Width', nameLocation='center')
p$x$opts$yAxis <- list(min=4, name='Sepal.Length')
p
Sign up for free
to join this conversation on GitHub.
Already have an account?
Sign in to comment
idea from @jyjek