
Last active
May 24, 2022 11:57
-
-
Save helgasoft/793320ec9fa072c3e01a54c7fe56503f to your computer and use it in GitHub Desktop.
R | ECharts | use ec.clmn in endLabel formatter and in pictorialBar symbol
This file contains hidden or bidirectional Unicode text that may be interpreted or compiled differently than what appears below. To review, open the file in an editor that reveals hidden Unicode characters.
Learn more about bidirectional Unicode characters
| library(echarty); library(dplyr) | |
| # set first column as X and second as Y to avoid explicitly define them later | |
| mydf <- data.frame( | |
| Date = c("2021-08-02", "2021-08-03", "2021-08-04", "2021-08-05", "2021-08-06", "2021-08-09", "2021-08-10", "2021-08-11", "2021-08-02", "2021-08-03", "2021-08-04", "2021-08-05", "2021-08-06", "2021-08-09", "2021-08-10", "2021-08-11", "2021-08-02", "2021-08-03", "2021-08-04", "2021-08-05", "2021-08-06", "2021-08-09", "2021-08-10", "2021-08-11", "2021-08-02", "2021-08-03", "2021-08-04", "2021-08-05", "2021-08-06", "2021-08-09", "2021-08-10", "2021-08-11"), | |
| CasesPer100K = c(397, 575, 579, 591, 617, 733, 654, 690, 54, 79, 83, 88, 92, 76, 104, 107, 84, 89, 95, 101, 106, 123, 125, 133, 151, 249, 287, 249, 259, 245, 371, 378), | |
| State = c("Florida", "Florida", "Florida", "Florida", "Florida", "Florida", "Florida", "Florida", "Massachusetts", "Massachusetts", "Massachusetts", "Massachusetts", "Massachusetts", "Massachusetts", "Massachusetts", "Massachusetts", "New York", "New York", "New York", "New York", "New York", "New York", "New York", "New York", "South Carolina", "South Carolina", "South Carolina", "South Carolina", "South Carolina", "South Carolina", "South Carolina", "South Carolina"), | |
| stringsAsFactors = FALSE) | |
| p <- mydf |> group_by(State) |> ec.init(ctype= 'line') | |
| p$x$opts$series <- lapply(p$x$opts$series, function(ss) { | |
| ss$endLabel <- list(show= TRUE, formatter= ec.clmn(3)); ss }) | |
| p$x$opts$tooltip <- list(show= TRUE) | |
| p |

Author
Author
pictorialBar in timeline, inquiry by @rdatasculptor
df <- data.frame(x= c("a", "a"), score= c(10, 5), group= c(1, 2), sym= c("pin", "triangle"))

library(echarty)    # v.1.4.5.9001 and up
p <- df |> group_by(group) |> ec.init(
	tl.series= list(
		type= 'pictorialBar',
		encode= list(x= 'x', y= 'score'),
		symbol= ec.clmn(4),   # 4th column is symbol type
                symbolSize= 34, symbolRepeat=9)
)
p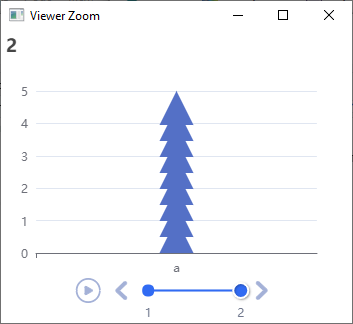

@helgasoft this is very cool! Thank you for digging into this.
Sign up for free
to join this conversation on GitHub.
Already have an account?
Sign in to comment
idea and data by @smach