
Last active
April 1, 2022 17:50
-
-
Save helgasoft/799acfa4402a074d0ca2784aca4b0568 to your computer and use it in GitHub Desktop.
ECharts | R | chart replace in Shiny, events handling
This file contains hidden or bidirectional Unicode text that may be interpreted or compiled differently than what appears below. To review, open the file in an editor that reveals hidden Unicode characters.
Learn more about bidirectional Unicode characters
| #' replace chart series interactively in Shiny | |
| #' idea from https://github.com/EKtheSage | |
| library(shiny) | |
| library(dplyr) | |
| library(echarty) | |
| ui <- fluidPage( titlePanel("echarty + Shiny"), | |
| radioButtons('yvars', | |
| label = 'Select a Y Variable to Plot', | |
| selected = 'Sepal.Width', | |
| choices = c('Sepal.Width', 'Petal.Length', 'Petal.Width')), | |
| ecs.output('chart1') | |
| ) | |
| server <- function(input, output) { | |
| dset <- legend <- series <- NULL | |
| output$chart1 <- ecs.render({ | |
| p <- data.frame(iris) %>% group_by(Species) %>% ec.init() | |
| p$x$opts$yAxis <- list(name=isolate(input$yvars), nameRotate=90, nameLocation='center') | |
| # save valuable data from presets, reuse later | |
| dset <<- p$x$opts$dataset | |
| legend <<- p$x$opts$legend | |
| series <<- p$x$opts$series | |
| p | |
| }) | |
| observeEvent(input$yvars, { | |
| p <- ecs.proxy("chart1") | |
| p$x$opts <- list( | |
| yAxis = list(name=input$yvars, nameRotate=90, nameLocation='center'), | |
| xAxis = list(show= TRUE), | |
| dataset = dset, | |
| legend = legend, | |
| series = lapply(series, function(s) { | |
| s$encode = list(y=input$yvars, x='Sepal.Length'); s }) | |
| ) | |
| p %>% ecs.exec('p_replace') | |
| }) | |
| } | |
| shinyApp(ui = ui, server = server) |

Author
Author
Event handling in ECharts & Shiny, inquiry by @brucefeiwang
library(shiny);  library(echarty)
cns <- data.frame(
  country = c('United States', 'China', 'Russia'),
  value = runif(3, 1, 100)
)
ui <- fluidPage( ecs.output("chart") )
server <- function(input, output) {
  output$chart <- ecs.render({
    p <- cns |> group_by(country) |>
      ec.init(load= 'world',
              tl.series=list(type= 'map',
                             encode=list(value='value', name='country')) )
    p$x$opts$visualMap <- list(calculable= TRUE, max= 100)
    p$x$capture <- c('selectchanged', 'timelinechanged')
    p
  })
  observeEvent(input$chart_timelinechanged, {
    print(paste("timelinechanged:",toString(input$chart_timelinechanged)) )
  })
  observeEvent(input$chart_selectchanged, {
    print(paste("selectchanged:",toString(input$chart_selectchanged)) )
  })
  observeEvent(input$chart_click, {  # echarty built-in event
    print(paste("click:",toString(input$chart_click)) )
  })
}
shinyApp(ui = ui, server = server)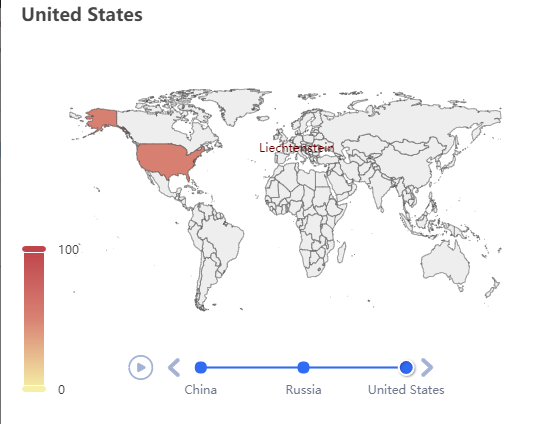
If you like this solution, please consider granting a Github star ⭐ to echarty.
Sign up for free
to join this conversation on GitHub.
Already have an account?
Sign in to comment
Credit to @EKtheSage for this interesting example.
Challenge was to do it with a dataset (and not with series.data) in echarty.