May 31, 2021
It has been more than a year since I started tracking cases and deaths in our respective counties on March 21, 2020.
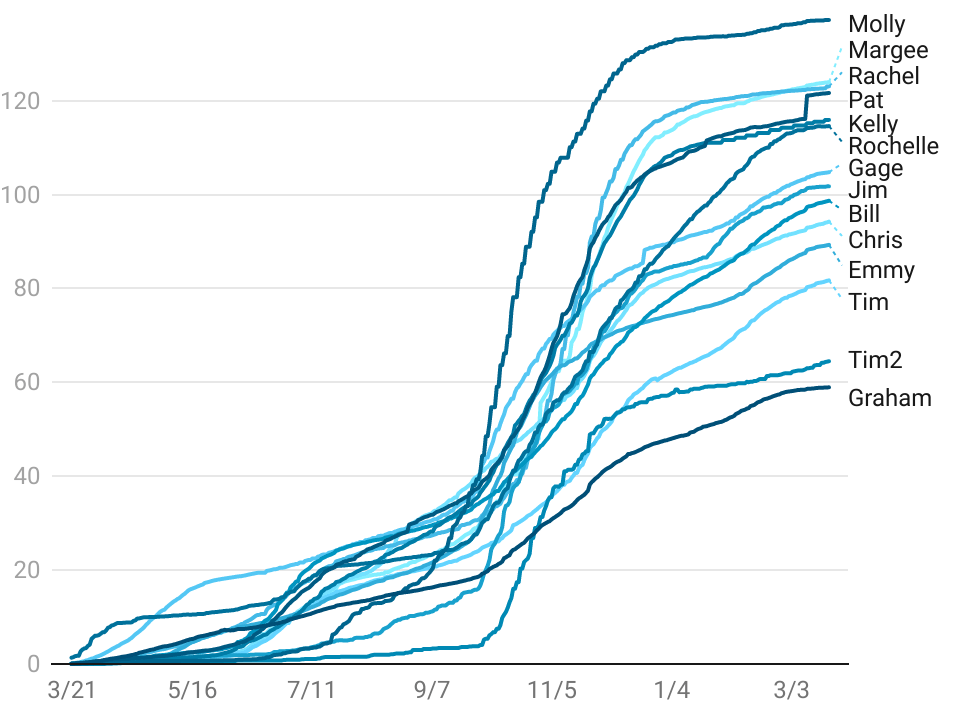
Rochelle's Eagle County jumped way ahead of us all in March 2020, with an explosion of skier cases. Case and death counts per capita were among the most dramatic in the nation. Thankfully, Eagle County settled down, cases leveled off and deaths went practically flat. Now Rochelle's county is the lowest among all our counties for deaths per thousand.
On the hand, two tiny counties – Tim2's Colfax County, NM, and Molly's Reno County, KS – had zero deaths for much of the pandemic, but they had an explosion of cases and deaths in November 2020 that pushed them to the top of the charts.
With vaccinations kicking in, the counts started leveling off in February 2021. Now most of our curves are flattening.
Click on a chart below to explore it up close.
| Cases per thousand | Deaths per thousand |
|---|---|
 |
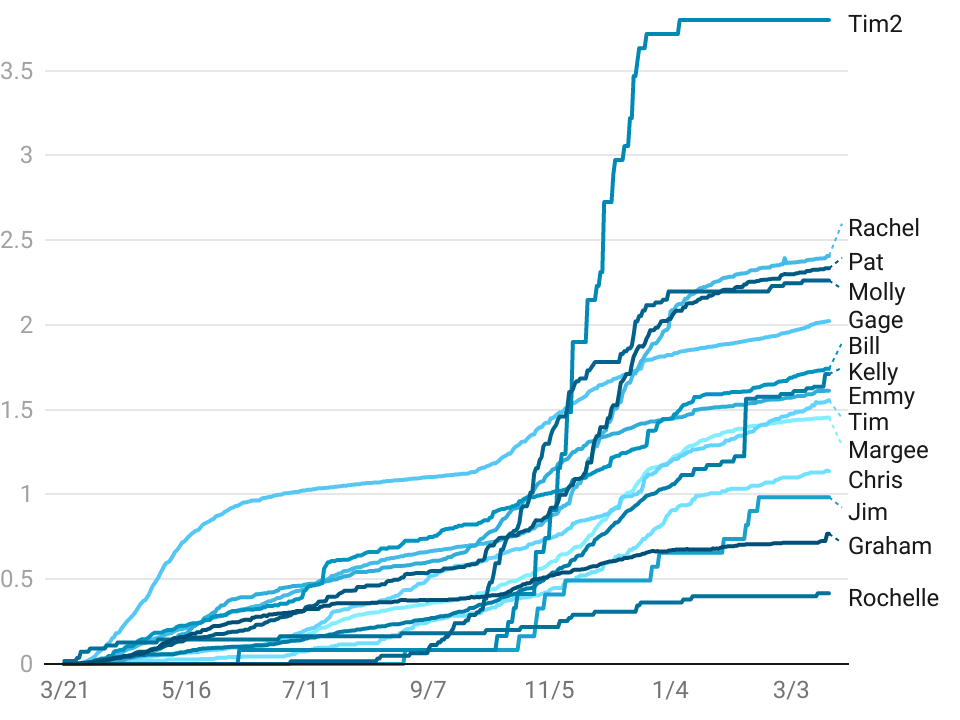 |
It helps me to think of the chart lines as paths to the top of the virus hill, all starting and ending at different times, some taking a steeper way up. The paths won't come down –– they'll climb and then become flat lines when new cases stop. We'll all get to the top eventually, and then we can have a reunion up there!
You can download the latest time-series spreadsheets here:
- https://higsdata.s3.amazonaws.com/covid/timeseries/local_cases_per_thousand.csv
- https://higsdata.s3.amazonaws.com/covid/timeseries/local_deaths_per_thousand.csv
| Reference | City or county | St. | Pop. | cases | dths | cases per thou. |
state cases | state dths |
|---|---|---|---|---|---|---|---|---|
| Jim | Menard Co. | IL | 12,196 | 1,244 | 12 | 102.0 | 1,382,186 | 25,223 |
| Margee, Ed | Tarrant Co. | TX | 2,102,515 | 260,643 | 3,064 | 123.97 | 2,943,844 | 50,426 |
| Pat, Darlene, Brian, Danielle | Jefferson Co. | AL | 659,300 | 80,195 | 1,539 | 121.64 | 543,405 | 11,146 |
| Rachel | Los Angeles Co. | CA | 10,105,518 | 1,243,882 | 24,339 | 123.09 | 3,763,273 | 62,925 |
| Rochelle, Joe | Eagle Co. | CO | 55,127 | 6,323 | 23 | 114.7 | 543,174 | 6,580 |
| Tim, Mary | Volusia Co. | FL | 547,538 | 44,745 | 852 | 81.72 | 2,320,818 | 37,512 |
| Tim2, Shelly | Colfax Co. | NM | 12,110 | 781 | 46 | 64.49 | 202,821 | 4,263 |
| Chris, Aileen, Eily | Alachua Co. | FL | 269,956 | 25,439 | 307 | 94.23 | 2,320,818 | 37,512 |
| Bill, Julie, Nellie, Naydeli | Manatee Co. | FL | 403,253 | 39,793 | 702 | 98.68 | 2,320,818 | 37,512 |
| Graham, Izzy | Howard Co. | MD | 325,690 | 19,210 | 250 | 58.98 | 459,894 | 9,614 |
| Emmy, Chad | Ramsey Co. | MN | 550,210 | 49,169 | 888 | 89.36 | 601,384 | 7,426 |
| Molly, Gary | Reno Co. | KS | 62,342 | 8,552 | 141 | 137.18 | 313,997 | 5,076 |
| Gage | Chicago | IL | 2,705,994 | 283,812 | 5,490 | 104.88 | 1,382,186 | 25,223 |
| Kelly, Le'Aires, Lorenna | Tulsa Co. | OK | 648,360 | 75,151 | 1,109 | 115.91 | 452,777 | 8,457 |
| Wichita | Sedgwick Co. | KS | 516,042 | 57,272 | 767 | 110.98 | 313,997 | 5,076 |
A YEAR AGO
| Reference | City or county | St. | Pop. | cases | dths | cases per thou. |
state cases | state dths |
|---|---|---|---|---|---|---|---|---|
| Jim | Menard Co. | IL | 12,196 | 20 | 0 | 1.64 | 120,260 | 5,390 |
| Margee, Ed | Tarrant Co. | TX | 2,102,515 | 5,513 | 165 | 2.62 | 64,287 | 1,672 |
| Pat, Darlene, Brian, Danielle | Jefferson Co. | AL | 659,300 | 1,810 | 102 | 2.75 | 17,849 | 630 |
| Rachel | Los Angeles Co. | CA | 10,105,518 | 16,372 | 55,001 | 1.62 | 111,776 | 4,171 |
| Rochelle, Joe | Eagle Co. | CO | 55,127 | 587 | 8 | 10.65 | 26,378 | 1,445 |
| Tim, Mary | Volusia Co. | FL | 547,538 | 736 | 38 | 1.34 | 56,163 | 2,451 |
| Tim2, Shelly | Colfax Co. | NM | 12,110 | 5 | 0 | 0.41 | 7,689 | 356 |
| Chris, Aileen, Eily | Alachua Co. | FL | 269,956 | 380 | 7 | 1.41 | 56,163 | 2,451 |
| Bill, Julie | Manatee Co. | FL | 403,253 | 1,045 | 97 | 2.59 | 56,163 | 2,451 |
| Graham, Izzy | Washington | DC | 705,749 | 8,801 | 466 | 12.47 | 8,801 | 466 |
| Nellie, Kelvin, Naydeli | Hennepin Co. | MN | 1,259,428 | 8,393 | 613 | 6.66 | 24,850 | 1,040 |
| Emmy, Chad | Ramsey Co. | MN | 550,210 | 3,019 | 124 | 5.49 | 24,850 | 1,040 |
| Molly, Gary | Reno Co. | KS | 62,342 | 43 | 0 | 0.69 | 9,700 | 215 |
| Gage | Chicago | IL | 2,705,994 | 45,527 | 2,122 | 16.82 | 120,260 | 5,390 |
| Kelly, Le'Aires, Lorenna | Tulsa Co. | OK | 648,360 | 1,014 | 54 | 1.56 | 6,506 | 334 |
| Wichita | Sedgwick Co. | KS | 516,042 | 580 | 21 | 1.12 | 9,700 | 215 |
Please take the charts with a grain of salt. There is no standard method for counting cases or deaths. Some paths in the smaller counties are a bit choppy, because a small numeric change can appear as a big change in a small population.
High cases per thousand might reflect more rigorous testing rather than a more serious outbreak.
Graham and Izzy moved from DC to a rural part of Howard County, MD, on June 1, 2020. Nellie and Naydeli moved in with us in Florida in November 2020.
- Newspaper data pages: Washington Post, LA Times
- Chicago COVID dashboard
- Census Bureau, for the latest-population estimates
- Johns Hopkins data repository on GitHub, to fill in gaps.
https://gist.github.com/higs4281/470a4a49634cbf6a17a436d27cbd18d7
Change log:
2020-11-11: Nellie moves from Minnesota to Florida, taking Hennepin County, MN, off the charts.
2020-7-22: Simplified the per-thousand-population charts from four charts (high and low charts for cases and for deaths) to two: cases and deaths, putting everyone on the same scale. This forced the removal of reference locales such as NOLA and Wichita.
Splitting the charts into high and low levels was always a bit uncomfortable, because it put high and low charts on different scales, which exaggerated steepness on the low charts.
2020-6-1: Graham and Izzy move to rural Howard County, MD, taking Washington, DC, off our charts.