Last active
December 29, 2015 14:09
-
-
Save hrbrmstr/7681842 to your computer and use it in GitHub Desktop.
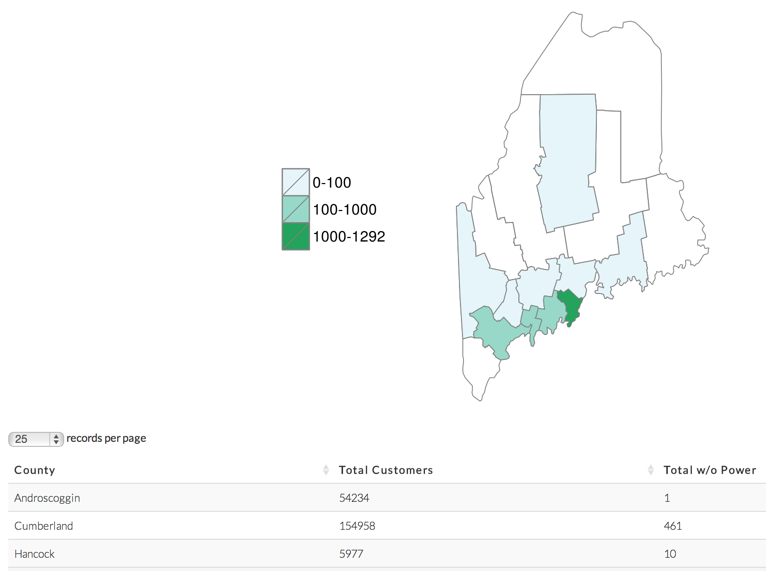
Graphing Maine Power Outages With R/Shiny : Preview: http://162.243.111.4:3838/outages/
This file contains hidden or bidirectional Unicode text that may be interpreted or compiled differently than what appears below. To review, open the file in an editor that reveals hidden Unicode characters.
Learn more about bidirectional Unicode characters
| library(shiny) | |
| library(maps) | |
| library(maptools) | |
| library(ggplot2) | |
| library(plyr) | |
| library(XML) | |
| # Define server logic required to plot various variables against mpg | |
| shinyServer(function(input, output, session) { | |
| autoInvalidate <- reactiveTimer(60*1000, session) | |
| output$cmpPlot <- renderPlot({ | |
| autoInvalidate() | |
| cmp.url <- "http://www3.cmpco.com/OutageReports/CMP.html" | |
| # get outage table (first one on the cmp.url page) | |
| cmp.node <- getNodeSet(htmlParse(cmp.url),"//table")[[1]] | |
| cmp.tab <<- readHTMLTable(cmp.node, | |
| header=c("subregion","total.customers","without.power"), | |
| skip.rows=c(1,2,3), | |
| trim=TRUE, stringsAsFactors=FALSE) | |
| if (!is.null(cmp.tab)) { | |
| OUTAGES <<- 1 | |
| # clean up the table to it's easier to work with | |
| cmp.tab <<- cmp.tab[-nrow(cmp.tab),] # get rid of last row | |
| cmp.tab$subregion <<- tolower(cmp.tab$subregion) | |
| cmp.tab$total.customers <<- as.numeric(gsub(",","",cmp.tab$total.customers)) | |
| cmp.tab$without.power <<- as.numeric(gsub(",","",cmp.tab$without.power)) | |
| cmp.tab$zones <<- cut(cmp.tab$without.power, breaks=c(0,100,500,1000,max(cmp.tab$without.power))) | |
| } else { | |
| OUTAGES <<- 0 | |
| } | |
| # get maine map with counties | |
| county.df <- map_data('county') | |
| me <- subset(county.df, region=="maine") | |
| # get a copy with just the affected counties | |
| out <- subset(me, subregion %in% cmp.tab$subregion) | |
| if (!is.null(cmp.tab)) { | |
| # add outage into to it | |
| out <- join(out, cmp.tab) | |
| } | |
| # plot the map | |
| gg <- ggplot(me, aes(long, lat, group=group)) | |
| gg <- gg + geom_polygon(fill=NA, colour='gray50', size=0.25) | |
| if (!is.null(cmp.tab)) { | |
| gg <- gg + geom_polygon(data=out, aes(long, lat, group=group, fill=zones), | |
| colour='gray50', size=0.25) | |
| } | |
| if (!is.null(cmp.tab)) { | |
| gg <- gg + scale_fill_brewer(type="seq", palette="BuGn", labels=c("0-100", "100-1000", sprintf("1000-%s",max(cmp.tab$without.power)))) | |
| } | |
| gg <- gg + coord_map() | |
| gg <- gg + theme_bw() | |
| gg <- gg + labs(x="", y="", title="") | |
| gg <- gg + theme(plot.background = element_rect(fill = "transparent",colour = NA), | |
| panel.border = element_blank(), | |
| panel.background =element_rect(fill = "transparent",colour = NA), | |
| panel.grid = element_blank(), | |
| axis.text = element_blank(), | |
| axis.ticks = element_blank(), | |
| legend.position="left", | |
| legend.title=element_blank()) | |
| print(gg) | |
| }, res=150, height=700, width=700, bg="transparent") | |
| output$ts <- renderText({ | |
| autoInvalidate() | |
| sprintf("<h3>%s</h3>",format(Sys.time(), "%a %b %d %X %Y %Z")) | |
| }) | |
| if (OUTAGES == 1) { | |
| output$details <- renderDataTable({ | |
| autoInvalidate() | |
| # capitalize the county name (works with multiple word names) | |
| cmp.tab$subregion <<- gsub("(^|[[:space:]])([[:alpha:]])", "\\1\\U\\2", cmp.tab$subregion, perl=TRUE) | |
| # make the column titles look nice | |
| colnames(cmp.tab) <- c("County", "Total Customers", "Total w/o Power") | |
| # don't need the binned column | |
| cmp.tab[,c(1,2,3)] | |
| }) | |
| } else { | |
| output$details <- renderText("No Outages") | |
| } | |
| }) |
This file contains hidden or bidirectional Unicode text that may be interpreted or compiled differently than what appears below. To review, open the file in an editor that reveals hidden Unicode characters.
Learn more about bidirectional Unicode characters
| library(shiny) | |
| # Define UI for miles per gallon application | |
| shinyUI(bootstrapPage( | |
| tags$head( | |
| tags$title('Central Maine Power Live Outage Map') | |
| ), | |
| tags$head( | |
| tags$link(href='http://fonts.googleapis.com/css?family=Lato:300,400', rel = 'stylesheet', type = 'text/css') | |
| ), | |
| tags$head(tags$style(type="text/css", | |
| "html, body, div, p { font-family: 'Lato', Helvetica, sans-serif; font-weight: 300; }", | |
| "h2, h2 { font-family: 'Lato', Helvetica, sans-serif; font-weight: 400; }", | |
| "body { margin:20px; }", | |
| "h2 { text-align:center; }", | |
| "h3 { text-align:center; }", | |
| "div { text-align:center; }" | |
| )), | |
| h2("Central Maine Power Live Outage Map"), | |
| htmlOutput('ts'), | |
| plotOutput(outputId = "cmpPlot", height="650px"), | |
| dataTableOutput('details'), | |
| HTML("<hr noshade size=1><center>Made by <a href='http://twitter.com/hrbrmstr'>@hrbrmstr</a>; Source at: <a href='https://gist.github.com/hrbrmstr/7681842'>github</a></center>") | |
| )) |
Author
hrbrmstr
commented
Nov 27, 2013
Sign up for free
to join this conversation on GitHub.
Already have an account?
Sign in to comment
