Created
September 4, 2017 03:09
-
-
Save infotroph/fd76379d8a0e2aa3d7a8ed4ac76dbd2c to your computer and use it in GitHub Desktop.
This file contains hidden or bidirectional Unicode text that may be interpreted or compiled differently than what appears below. To review, open the file in an editor that reveals hidden Unicode characters.
Learn more about bidirectional Unicode characters
| # Overthinking a speed comparison. The task at hand is: | |
| # "if this column contains values greater than 1, assume they're percentages and divide them by 100" | |
| library(microbenchmark) | |
| library(data.table) | |
| library(dplyr) | |
| library(ggplot2) | |
| # We'll generate 20 columns for realistic size, but only column 10 used in this test | |
| newdata <- function(nrow, max_1 = TRUE){ | |
| x <- replicate( | |
| n = 20, | |
| expr = { | |
| row <- rnorm(nrow) | |
| if(max_1){ row <- row/max(row) } | |
| row | |
| }) | |
| as.data.frame(cbind(x)) | |
| } | |
| base <- function(dat){ | |
| if(max(dat$V10) > 1){ dat$V10 = dat$V10 / 100 } | |
| } | |
| dt <- function(dat){ | |
| if(dat[, max(V10) > 1]){ dat[, `:=`(V10 = V10 / 100)] } | |
| } | |
| dp <- function(dat){ | |
| if((dat %>% select(V10) %>% max) > 1){ dat = dat %>% mutate(V10 = V10 / 100) } | |
| } | |
| base_dt <- function(dat){ | |
| if(max(dat$V10) > 1){ dat[, `:=`(V10 = V10 / 100)] } | |
| } | |
| base_dp <- function(dat){ | |
| if(max(dat$V10) > 1){ dat = dat %>% mutate(V10 = V10 / 100) } | |
| } | |
| dt_base <- function(dat){ | |
| if(dat[, max(V10) > 1]){ dat$V10 = dat$V10 / 100 } | |
| } | |
| dp_base <- function(dat){ | |
| if((dat %>% select(V10) %>% max) > 1){ dat$V10 = dat$V10 / 100 } | |
| } | |
| compare_fns <- function(nrow, nrep){ | |
| replicate( | |
| n = nrep, | |
| expr = { | |
| max_1 <- sample(c(TRUE, FALSE), size = 1) | |
| x <- newdata(nrow, max_1); | |
| # Pre-convert so each function gets the format it's expecting | |
| xt <- as.data.table(x); | |
| xd <- as_tibble(x); | |
| mb <- microbenchmark( | |
| base = base(x), | |
| dt = dt(xt), | |
| dp = dp(xd), | |
| base_dt = base_dt(xt), | |
| base_dp = base_dp(xd), | |
| dt_base = dt_base(xt), | |
| dp_base = dp_base(xd), | |
| times = 100); | |
| mb$nrow <- nrow; | |
| mb$max_1 <- max_1; | |
| mb$id <- digest::sha1(mb); | |
| as.data.frame(mb) | |
| }, | |
| simplify=FALSE) | |
| } | |
| res_1k_df <- do.call("rbind", compare_fns(nrow = 1e3, nrep = 20)) | |
| res_10k_df <- do.call("rbind", compare_fns(nrow = 1e4, nrep = 20)) | |
| res_100k_df <- do.call("rbind", compare_fns(nrow = 1e5, nrep = 20)) | |
| # drop very slowest outliers from each group before plotting -- | |
| # otherwise tails are absurdly long | |
| # I think these may be a microbenchmark artifact | |
| res <- (rbind(res_1k_df, res_10k_df, res_100k_df) | |
| %>% group_by(expr, id, nrow) | |
| %>% filter(time < quantile(time, 0.95)) | |
| %>% mutate(time = time/1e6) # ns to ms | |
| ) | |
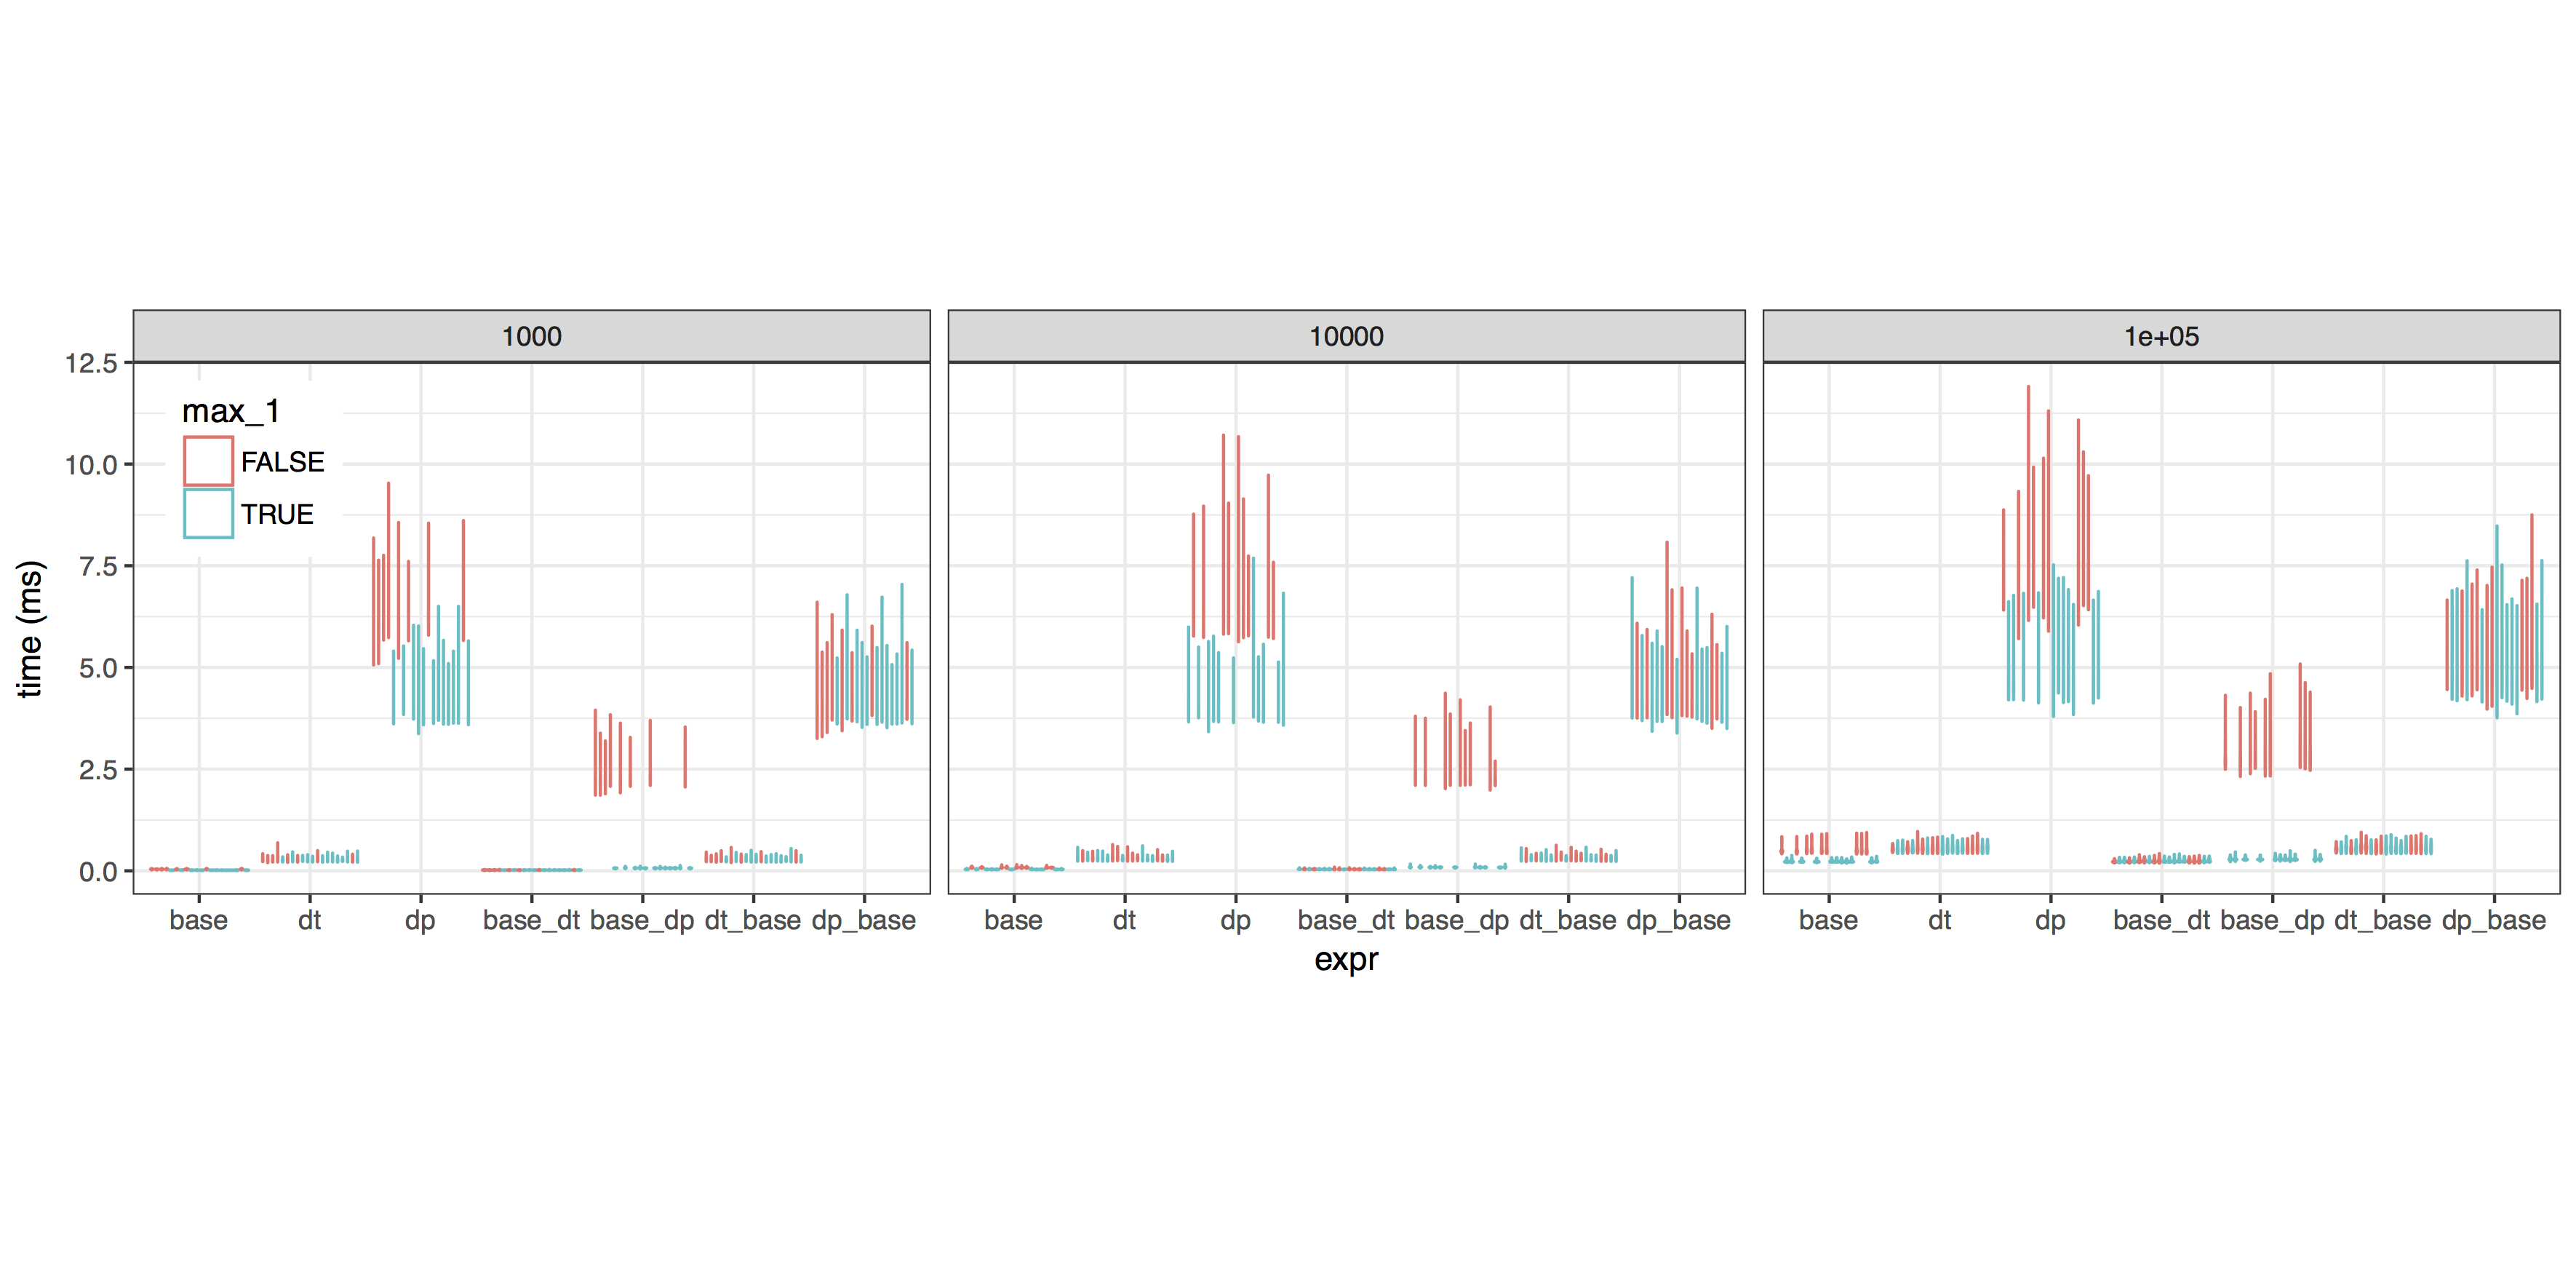
| all <- (ggplot(res, | |
| aes(x = expr, y = time, group = paste(expr, id), color=max_1)) | |
| + geom_violin() | |
| + facet_wrap(~nrow) | |
| + ylab("time (ms)") | |
| + theme_bw() | |
| + theme(legend.position = c(0.05, 0.8), aspect.ratio = 0.6667)) | |
| ggsave(filename = "dt_vs_base_all.pdf", plot = all, width = 300, height = 150, units = "mm") | |
| # ==> The functions with base calls as the conditional test seem to be consistently fastest. | |
| # Let's zoom in and see if there's any difference between reassignment methods. | |
| justbase <- (ggplot(res %>% filter(grepl("^base", expr)), | |
| aes(x = expr, y = time, group = paste(expr, id), color=max_1)) | |
| + geom_violin() | |
| + facet_wrap(~nrow) | |
| + ylab("time (ms)") | |
| + theme_bw() | |
| + theme(legend.position = c(0.05, 0.8), aspect.ratio = 0.667)) | |
| ggsave(filename = "dt_vs_base_base.pdf", plot = justbase, width = 300, height = 150, units = "mm") | |
| #... Answer: No, not reliably. |
Author
infotroph
commented
Sep 4, 2017
Author

Author
Overall conclusion:
- For the if test, use the base R construction
if(max(dat$V10) > 1). It's the fastest AND most obvious. - For sufficiently large datasets, the data.table approach
dat[,:=(V10 = V10 / 100)]is faster than the base Rdat$V10 = dat$V10 / 100, but the difference is small. - The dplyr call shown here is far slower than the others. Maybe it could be optimized --
x %>% mutate(...)tomutate(x, ...)? -- but I haven't tried.
Sign up for free
to join this conversation on GitHub.
Already have an account?
Sign in to comment