Function for visualization sample count on each step of filtering process
Requires plotly_express installed.
Create "stages" dict during the filtering process. At each stage of filtering add elements both to lists under "count" and "stage" keys.
Function for visualization sample count on each step of filtering process
Requires plotly_express installed.
Create "stages" dict during the filtering process. At each stage of filtering add elements both to lists under "count" and "stage" keys.
| import plotly.express as px | |
| # count - sample count after given stage | |
| # stage - stage description | |
| # Create "stages" dict during the filtering process. At each stage of filtering add elements both to lists under "count" and "stage" keys. | |
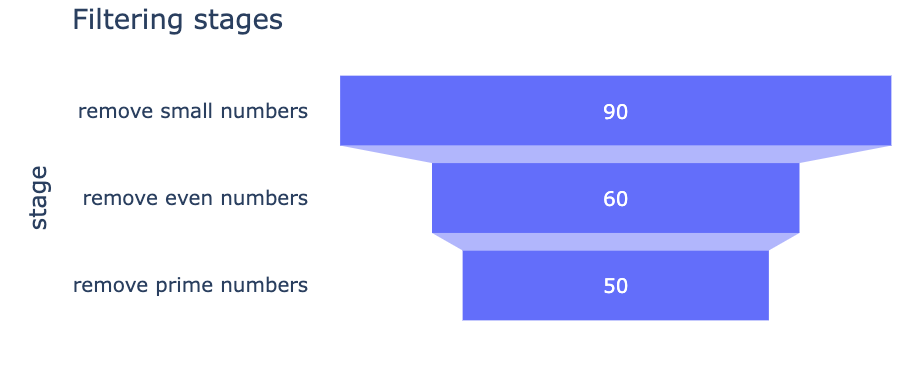
| stages = { | |
| "count": [90, 60, 50], | |
| "stage": ["remove small numbers", "remove even numbers", "remove prime numbers"], | |
| } | |
| def plot_filtering_stages_funnel( | |
| data, width=800, height=350, plot_title="Filtering stages" | |
| ): | |
| fig = px.funnel(data, x="count", y="stage") | |
| fig.update_layout( | |
| width=width, | |
| height=height, | |
| title=plot_title, | |
| ) | |
| # Make sure font is readable | |
| fig["layout"]["font"] = dict(size=16) | |
| fig.layout.template = "plotly_white" | |
| fig.show() | |
| plot_filtering_stages_funnel(stages) |