-
-
Save jdbcode/f4d56d72f7fc5beeaa3859999b1f5c3d to your computer and use it in GitHub Desktop.
Ahhh, I think I see the problem. My example uses the SR image product and you are using TOA. The SR images are scaled by 10,000, so you need to change the line that defines rgb_img_test to:
rgb_img_test = (255*(rgb_img/0.35)).astype('uint8')
Got it, it worked. Thank you so much!!!
Happy to hear!
Hey, incredibly sorry for bothering you again but, is there any way to set a scale or maxPixels parameter during (or after) the extraction of band values in sampleRectangle()?
It's just that I for a couple of regions and images, I keep getting the too many pixels error, and am out of ways to fix it. Help please (again, sorry).

Hi @hibajamal
That is a limitation of the function. The only way to get around it is to make a smaller rectangle or resample the image to have larger pixels like this:
band_arrs = img.reproject(crs=img.projection().crs(), scale=100).sampleRectangle(region=aoi)
Thanks so much for the response, I tried limiting the size by fixing a small rectangle and now this, adding a high scale but that leads to giving a completely white image, or if the rectangle is too small, then a black image (since i kept defaultValue=0 in sampleRectangle).
Hey, @jdbcode,
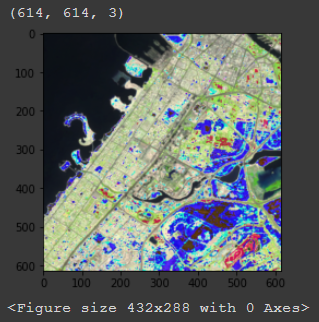
Also, will rgb_img_test have to be changed or scaled according to the scale in img.reproject or not? Sorry I am just trying figure out why the output image looks like this (it is also the median of an image collection if that matters):
Thanks for the gist! Do you have any idea why if I use the COPERNICUS/S2_SR dataset sampleRectangle() returns a single pixel? I am sampling a region of 1000x1000 m and the resolution of the bands is 10 m, so I was expecting 100x100 pixels.
Here's my code:
collection = ee.ImageCollection('COPERNICUS/S2_SR')
collection = collection.filterDate('2020-01-01', '2020-01-30')
collection = collection.filter(ee.Filter.lt('CLOUDY_PIXEL_PERCENTAGE', 20))
collection = collection.map(maskS2clouds)

image = collection.mean()

region = ee.Geometry.Point(83.277, 17.7009).buffer(1000).bounds()
patch = image.sampleRectangle(region)
plt.imshow(np.dstack(([patch.get(b).getInfo() for b in ['B4', 'B3', 'B2']])))Image composites (collection.mean()) have a default projection of WGS84 with 1-degree scale and since the region is less than 1 degree, only a single pixel is returned. Set the projection of the mean composite manually with setDefaultProjection(). See suggested code edits for possible solution (untested).
region = ee.Geometry.Point(83.277, 17.7009).buffer(1000).bounds() # <-- move above collection def
collection = ee.ImageCollection('COPERNICUS/S2_SR')
collection = collection.filterBounds(region) # <-- filter by region intersection
collection = collection.filterDate('2020-01-01', '2020-01-30')
collection = collection.filter(ee.Filter.lt('CLOUDY_PIXEL_PERCENTAGE', 20))
collection = collection.map(maskS2clouds)

proj = collection.first().projection() # <-- get the projection of an image
image = collection.mean().setDefaultProjection(proj); # <--set projection of the composite

patch = image.sampleRectangle(region)
plt.imshow(np.dstack(([patch.get(b).getInfo() for b in ['B4', 'B3', 'B2']])))Thanks a lot @jdbcode! I didn't know about the default projection of image composites. Actually, I don't even need a composite, I just want to sample an image from that region (e.g. the most recent pass). So I fixed my code as follows:
collection = ee.ImageCollection('COPERNICUS/S2_SR')
collection = collection.filterDate('2017-03-28', '2020-06-27')
collection = collection.filter(ee.Filter.lt('CLOUDY_PIXEL_PERCENTAGE', 20))
collection = collection.map(maskS2clouds)

region = ee.Geometry.Point(7.411762, 43.725962).buffer(1000).bounds()
image = collection.filterBounds(region).limit(1, 'system:index', False).first()
bands = image.sampleRectangle(region, defaultValue=0)
patch = np.dstack(([bands.get(b).getInfo() for b in ['B4', 'B3', 'B2']]))

plt.imshow(patch/0.3)hello dear @jdbcode
I want to add a polygon (shapefile) to the array layer then add it to the base map (by contextily library) but I couldn't.
Could you help me, please?
if it not possible, how I should add just shapefile
%matplotlib inline

import pandas as pd

import geopandas as gpd

import contextily as cx

import matplotlib.pyplot as pl


band = mean2020.reproject(crs=img.projection().crs(), scale=4000)\
                    .sampleRectangle(region=aoi,defaultValue=0.0)

band_arr = band.get('tropospheric_NO2_column_number_density')
np_arr = np.array(band_arr.getInfo())

# convert to nan
np_arr[np_arr == 0.0] = np.nan


def plot_matrix(mat, figsize, title='NO2_Iran (mol/m^2)', cmap=plt.cm.get_cmap("rainbow")):


    plt.figure(figsize=figsize)
    ax=plt.subplot()

    #ax = plt.axes([0, 0.05, 0.9, 0.9 ]) #left, bottom, width, height
    #note that we are forcing width:height=1:1 here,
    #as 0.9*8 : 0.9*8 = 1:1, the figure size is (8,8)
    #if the figure size changes, the width:height ratio here also need to be changed


    plt.imshow(mat ,interpolation='nearest', cmap=cmap,vmin=min_str,vmax=max_str)
    ax=Iran.plot(color="None", edgecolor='black')
    cx.add_basemap(ax,crs=Iran.crs.to_string())
    #ax=fig.add_subplots()


    #ax.grid(False)
    #ax.set_title(title)

    cax = plt.axes([0.04, 0.17, 0.05,0.2 ])

    #plt.colorbar(mappable=im, cax=cax)
    # Add colorbar, make sure to specify tick locations to match desired ticklabels

    #norm = mpl.colors.Normalize(vmin=min, vmax=max)
    # creating ScalarMappable
    #sm = plt.cm.ScalarMappable(cmap=cmap, norm=norm)
    #sm.set_array([])
    #plt.colorbar(sm,cax=cax ,ticks=np.linspace(min, max, 5))

    #plt.savefig("C:/Users/Mohammad Reza/Desktop/NO2.png",dpi=100,quality=98,format='png')
    return ax, cax

data = np_arr
ax, cax = plot_matrix(data, (10,10))


@Mohammadreza20 If you are looking to just visualize the NO2 data with Iran state overlay in Python with matplotlib, you can do it all in server-side Earth Engine - you just transfer final visualization to Python client for plotting (regarding non-EE libraries for overlay, I'm not sure):
import ee
ee.Initialize()

import requests
from io import BytesIO
from PIL import Image
import matplotlib.pyplot as plt

# Get Iran admin boundry feature collection.
admin_poly = (ee.FeatureCollection("FAO/GAUL_SIMPLIFIED_500m/2015/level1")
  .filter(ee.Filter.eq('ADM0_NAME' , 'Iran  (Islamic Republic of)')));

# Get S5P NO2 collection.
col = (ee.ImageCollection("COPERNICUS/S5P/NRTI/L3_NO2")
  .filterBounds(admin_poly.geometry())
  .filterDate('2020-09-01', '2021-01-01')
  .select('tropospheric_NO2_column_number_density'));

# Calculate S5P NO2 collection mean.
mean2020 = col.mean();

# Reproject the data.
band = mean2020.reproject(**{'crs': col.first().projection().crs(), 'scale': 4000})

# Convert NO2 data to RGB visualization.
vis_img = band.visualize(**{
  'min': 0,
  'max': 0.000096,
  'palette': ['00007F', '002AFF', '00D4FF', '7FFF7F', 'FFD400', 'FF2A00', '7F0000']
});

# Convert Iran admin boundry feature collection to a raster w/ state outlines.
admin_raster = (ee.Image().byte().paint(**{
  'featureCollection': admin_poly,
  'color': '000000',
  'width': 2
}))

# Overlay the Iran raster state outlines on the NO2 visualization.
vis_img = vis_img.blend(admin_raster).clipToCollection(admin_poly)

# Get final visualization thumbnail URL.
url = vis_img.getThumbURL({'dimensions': 1024, 'region': admin_poly.geometry()})

# Get image content from the URL.
response = requests.get(url)
img = Image.open(BytesIO(response.content))

# Plot the image with matplotlib.
plt.imshow(img)
plt.show()
Hi dear @jdbcode
I do not know how to thank you, I have always done my job with your help and great tips, whether on GateHub or other sites, you answer everyone's questions very well and honestly,
I wrote more than a hundred lines of code to reach the result you wrote :)))))
Thanks so much for replying. Yeah, I did. I updated it for a specific lat and long value, and my region is a square on that lat, long (attaching code). Does it have something to do with the bands? Sorry for the questions rookie here!
