Created
January 29, 2021 11:45
-
-
Save jkrumbiegel/b15495d7bda2651e61966c0b45f18caa to your computer and use it in GitHub Desktop.
ggplot2 theme makie
This file contains hidden or bidirectional Unicode text that may be interpreted or compiled differently than what appears below. To review, open the file in an editor that reveals hidden Unicode characters.
Learn more about bidirectional Unicode characters
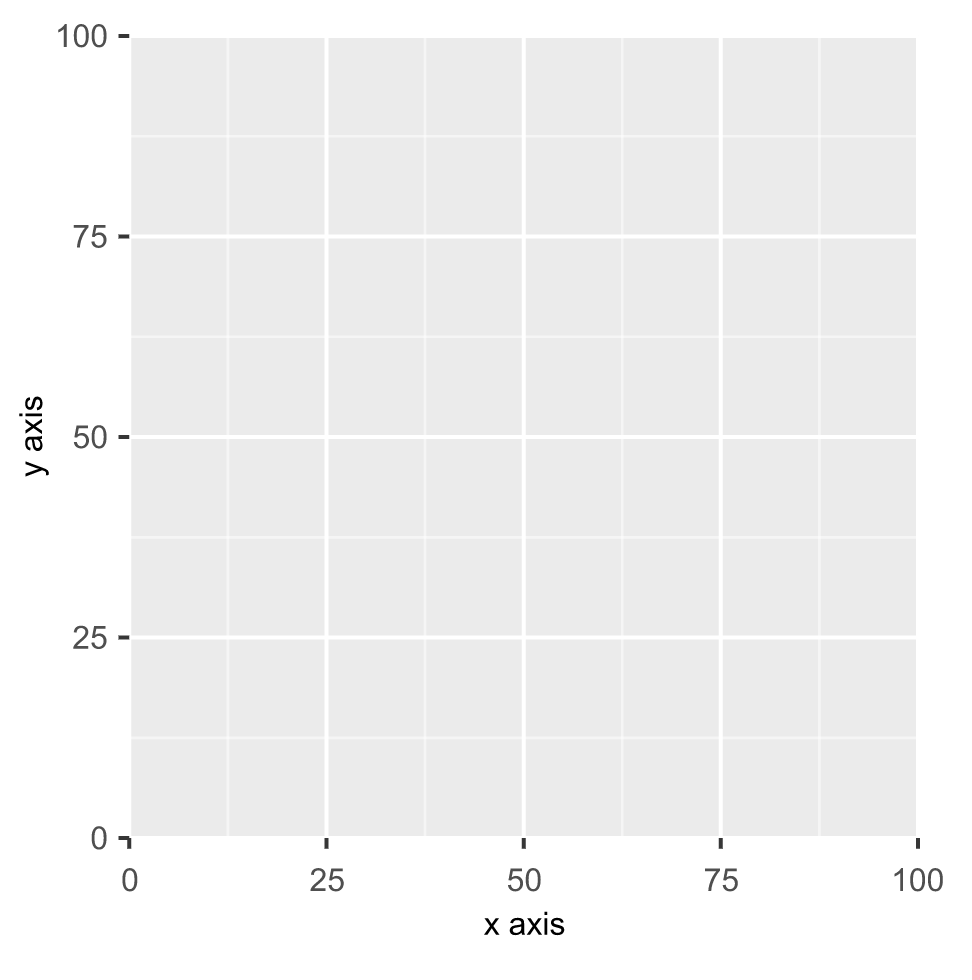
| this looks kind of close | |
| set_theme!( | |
| font = "Arial", | |
| fontsize = 12, | |
| Axis = ( | |
| backgroundcolor = :gray92, | |
| xgridcolor = :white, | |
| ygridcolor = :white, | |
| xminorgridcolor = (:white, 0.5), | |
| xminorgridvisible = true, | |
| yminorgridcolor = (:white, 0.5), | |
| yminorgridvisible = true, | |
| leftspinevisible = false, | |
| rightspinevisible = false, | |
| bottomspinevisible = false, | |
| topspinevisible = false, | |
| xminorticksvisible = false, | |
| yminorticksvisible = false, | |
| xtickcolor = :gray21, | |
| ytickcolor = :gray21, | |
| spinewidth = 0, | |
| xticklabelcolor = :gray31, | |
| yticklabelcolor = :gray31, | |
| xticksize = 4, | |
| yticksize = 4, | |
| xtickwidth = 1.5, | |
| ytickwidth = 1.5, | |
| xgridwidth = 1.5, | |
| ygridwidth = 1.5, | |
| xlabelpadding = 3, | |
| ylabelpadding = 3 | |
| ) | |
| ) | |
| fig = Figure(resolution = (400, 400)) | |
| Axis(fig[1, 1], xlabel = "x axis", ylabel = "y axis") | |
| fig |
Author
jkrumbiegel
commented
Jan 29, 2021
Sign up for free
to join this conversation on GitHub.
Already have an account?
Sign in to comment