Last active
March 3, 2020 23:35
-
-
Save jmcastagnetto/8aab20ecba6b9bfb3f53c3b66ae9e502 to your computer and use it in GitHub Desktop.
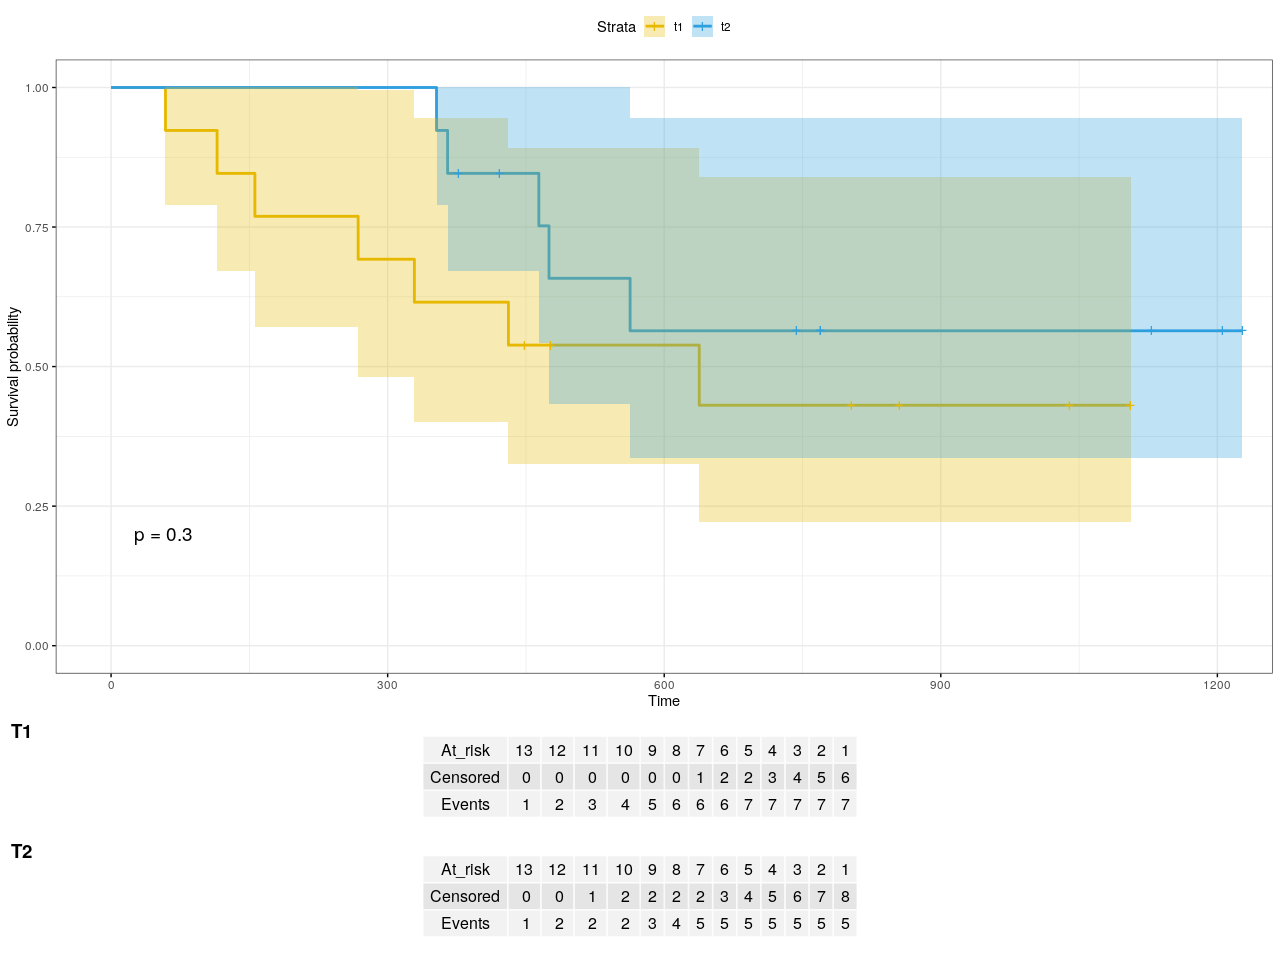
Trying to make something like Fig 5 from http://dx.doi.org/10.1136/bmjopen-2019-030215 using gridExtra, cowplot and survminer (ref: https://twitter.com/tmorris_mrc/status/1234946869362601984)
This file contains hidden or bidirectional Unicode text that may be interpreted or compiled differently than what appears below. To review, open the file in an editor that reveals hidden Unicode characters.
Learn more about bidirectional Unicode characters
| library(tidyverse) | |
| library(survminer) | |
| library(survival) | |
| library(cowplot) | |
| library(gridExtra) | |
| fit <- survfit(Surv(futime, fustat) ~ rx, data = ovarian) | |
| p1 <- ggsurvplot( | |
| fit, | |
| data = ovarian, | |
| size = 1, # change line size | |
| palette = c("#E7B800", "#2E9FDF"), # custom color palettes | |
| conf.int = TRUE, # Add confidence interval | |
| pval = TRUE, # Add p-value | |
| legend.labs = c("t1", "t2"), # Change legend labels | |
| ggtheme = theme_bw() # Change ggplot2 theme | |
| ) | |
| df <- surv_summary(fit, data = ovarian) | |
| t1 <- df %>% | |
| filter(rx == "1") %>% | |
| select(1,2,4,3) %>% | |
| mutate( | |
| Censored = cumsum(n.censor), | |
| Events = cumsum(n.event) | |
| ) %>% | |
| rename( | |
| At_risk = n.risk | |
| ) %>% | |
| select(-n.censor, -n.event) %>% | |
| t() %>% | |
| as_tibble( | |
| rownames = "item" | |
| ) %>% | |
| slice(2:4) | |
| t2 <- df %>% | |
| filter(rx == "2") %>% | |
| select(1,2,4,3) %>% | |
| mutate( | |
| Censored = cumsum(n.censor), | |
| Events = cumsum(n.event) | |
| ) %>% | |
| rename( | |
| At_risk = n.risk | |
| ) %>% | |
| select(-n.censor, -n.event) %>% | |
| t() %>% | |
| as_tibble( | |
| rownames = "item" | |
| ) %>% | |
| slice(2:4) | |
| tab1 <- tableGrob(t1, cols = NULL, rows = NULL) | |
| tab2 <- tableGrob(t2, cols = NULL, rows = NULL) | |
| plot_grid(p1$plot, tab1, tab2, | |
| labels = c("", "T1", "T2"), | |
| ncol = 1, rel_heights = c(6, 1, 1)) |
Author
jmcastagnetto
commented
Mar 3, 2020
Sign up for free
to join this conversation on GitHub.
Already have an account?
Sign in to comment