Created
January 15, 2020 16:34
-
-
Save jmcastagnetto/fe7ae108b7515b42dfa7b443b107dabc to your computer and use it in GitHub Desktop.
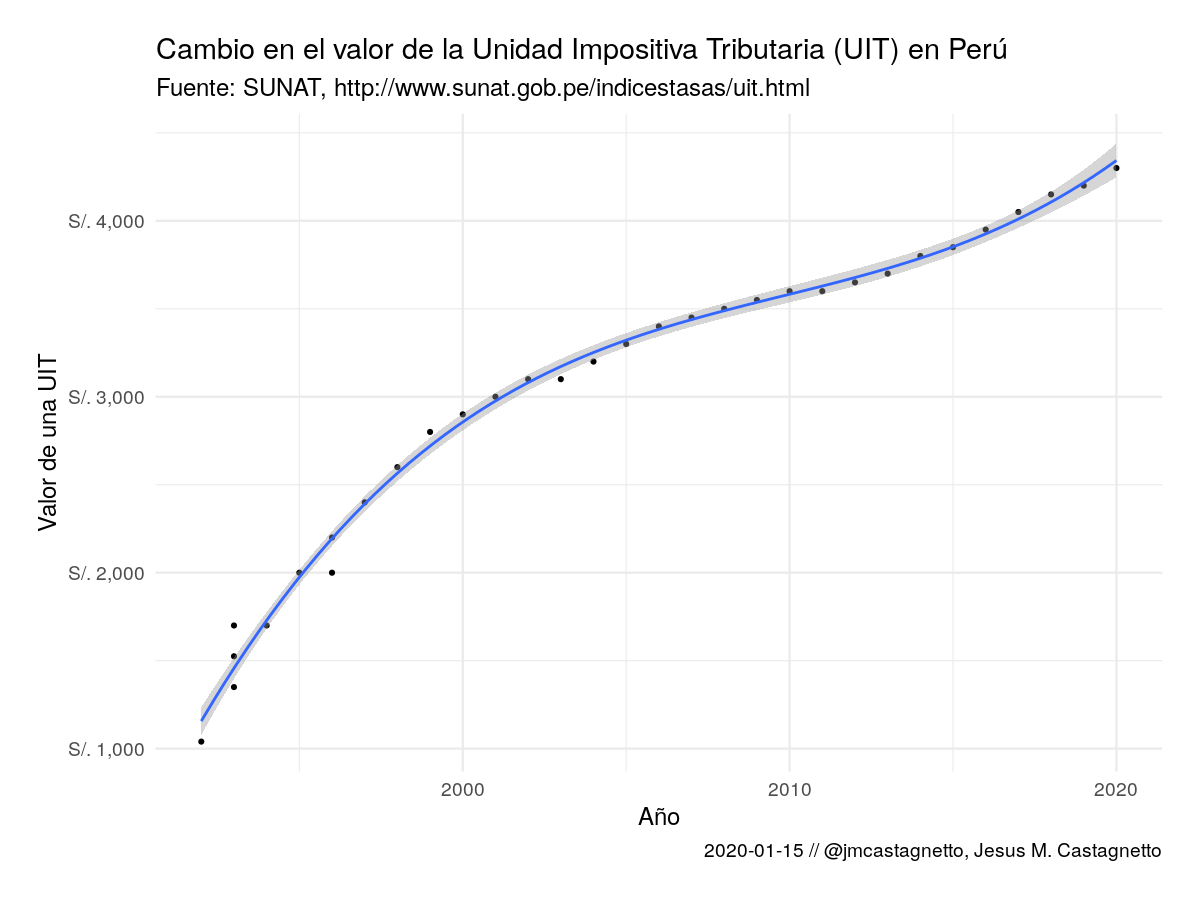
Cambio del valor de una UIT en el Perú a lo largo del tiempo
This file contains hidden or bidirectional Unicode text that may be interpreted or compiled differently than what appears below. To review, open the file in an editor that reveals hidden Unicode characters.
Learn more about bidirectional Unicode characters
| library(tidyverse) | |
| library(rvest) | |
| url <- "http://www.sunat.gob.pe/indicestasas/uit.html" | |
| uit_table <- html(url) %>% | |
| html_node(xpath = "/html/body/div[2]/div/div[1]/div[4]/div[1]/div[1]/center/table") %>% | |
| html_table(header = TRUE) %>% | |
| janitor::clean_names() | |
| uit_df <- uit_table %>% | |
| mutate( | |
| base_legal = str_squish(base_legal), | |
| observaciones = str_squish(observaciones), | |
| valor_s = str_remove(valor_s, ",") %>% | |
| str_remove("\\.") %>% | |
| as.numeric() | |
| ) %>% | |
| separate( | |
| col = ano, | |
| into = c("yr", "periodo"), | |
| sep = " ", | |
| convert = TRUE | |
| ) %>% | |
| mutate( | |
| periodo = ifelse(is.na(periodo), "", periodo), | |
| observaciones = ifelse(is.na(observaciones), | |
| "", | |
| observaciones), | |
| ) %>% | |
| unite("obs", | |
| c(periodo, observaciones), | |
| sep = " ") %>% | |
| mutate(obs = str_squish(obs) %>% str_trim()) %>% | |
| rename(observaciones = obs, | |
| valor_uit = valor_s) %>% | |
| select(yr, valor_uit, base_legal, observaciones) | |
| ggplot(uit_df, aes(x = yr, y = valor_uit)) + | |
| geom_point() + | |
| geom_smooth(method = "glm", formula = y ~ poly(x, 3)) + | |
| labs( | |
| y = "Valor de una UIT", | |
| x = "Año", | |
| title = "Cambio en el valor de la Unidad Impositiva Tributaria (UIT) en Perú", | |
| subtitle = "Fuente: SUNAT, http://www.sunat.gob.pe/indicestasas/uit.html", | |
| caption = "2020-01-15 // @jmcastagnetto, Jesus M. Castagnetto" | |
| ) + | |
| scale_y_continuous(labels = scales::dollar_format(prefix = "S/. ")) + | |
| theme_minimal(18) + | |
| theme( | |
| plot.margin = unit(rep(1, 4), "cm") | |
| ) | |
| #--- a naive polynomial model | |
| model <- glm(valor_uit ~ poly(yr, 3), | |
| data = uit_df, | |
| family = "gaussian") | |
| future <- data.frame( | |
| yr = 2021:2025 | |
| ) | |
| future$valor_uit <- predict(model, future) | |
| future | |
| # yr valor_uit | |
| # 1 2021 4486.444 | |
| # 2 2022 4648.920 | |
| # 3 2023 4832.154 | |
| # 4 2024 5037.848 | |
| # 5 2025 5267.703 |
Author
jmcastagnetto
commented
Jan 15, 2020
Sign up for free
to join this conversation on GitHub.
Already have an account?
Sign in to comment