Created
January 13, 2020 04:15
-
-
Save johnbaums/d8a82fbce9662435636d029b5b741a78 to your computer and use it in GitHub Desktop.
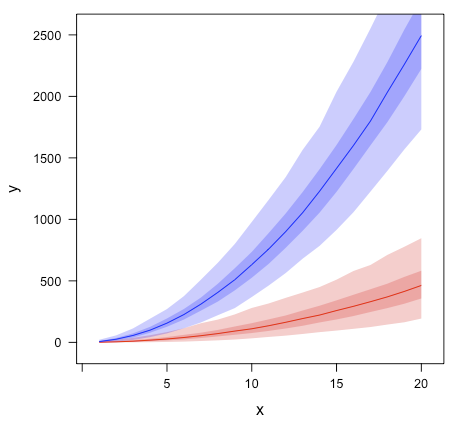
Shaded, semi-transparent uncertainty/error bands for lattice
This file contains hidden or bidirectional Unicode text that may be interpreted or compiled differently than what appears below. To review, open the file in an editor that reveals hidden Unicode characters.
Learn more about bidirectional Unicode characters
| # based on https://stackoverflow.com/q/51209112/489704 | |
| library(lattice) | |
| library(dplyr) | |
| library(tidyr) | |
| my.panel.bands <- function(x, y, upper, lower, fill, col, subscripts, ..., | |
| font, fontface) { | |
| upper <- upper[subscripts] | |
| lower <- lower[subscripts] | |
| panel.polygon(c(x, rev(x)), c(upper, rev(lower)), col=fill, border=FALSE, ...) | |
| } | |
| d1 <- replicate(1000, (cumsum(pmax(0, rnorm(20, 1))))^2) %>% | |
| as.data.frame %>% | |
| dplyr::as.tbl() %>% | |
| dplyr::mutate(x=dplyr::row_number()) %>% | |
| tidyr::gather(i, val, -x) %>% | |
| dplyr::group_by(x) %>% | |
| dplyr::do( | |
| data.frame(t(quantile(.$val, probs = c(0.025, 0.25, 0.5, 0.75, 0.975)))) | |
| ) | |
| d2 <- replicate(1000, (cumsum(pmax(0, rnorm(20, 2.5))))^2) %>% | |
| as.data.frame %>% | |
| dplyr::as.tbl() %>% | |
| dplyr::mutate(x=dplyr::row_number()) %>% | |
| tidyr::gather(i, val, -x) %>% | |
| dplyr::group_by(x) %>% | |
| dplyr::do( | |
| data.frame(t(quantile(.$val, probs = c(0.025, 0.25, 0.5, 0.75, 0.975)))) | |
| ) | |
| d <- list(d1=d1, d2=d2) %>% | |
| dplyr::bind_rows(.id='grp') %>% | |
| setNames(gsub('X|\\.$', '', names(.))) | |
| lattice::xyplot(`50`~x, data=d, groups=grp, | |
| ylab='y', scales=list(tck=1:0), | |
| panel=function(x, y, ...) { | |
| panel.superpose(x, y, panel.groups=my.panel.bands, upper=d$`97.5`, lower=d$`2.5`, | |
| type='l', fill=c('#ff000040', '#0000ff40'), ...) | |
| panel.superpose(x, y, panel.groups=my.panel.bands, upper=d$`75`, lower=d$`25`, | |
| type='l', fill=c('#ff000040', '#0000ff40'), ...) | |
| panel.xyplot(x, y, type='l', cex=0.6, lty=1, col=c('#ff0000', '#0000ff'), ...) | |
| }) |
Author
johnbaums
commented
Jan 13, 2020
Sign up for free
to join this conversation on GitHub.
Already have an account?
Sign in to comment