
Last active
January 30, 2021 22:10
-
-
Save johnmackintosh/1f55dc1321cf1253268b79d3f163a385 to your computer and use it in GitHub Desktop.
preppindata week 3 https://preppindata.blogspot.com/2021/01/2021-week-3.html
This file contains hidden or bidirectional Unicode text that may be interpreted or compiled differently than what appears below. To review, open the file in an editor that reveals hidden Unicode characters.
Learn more about bidirectional Unicode characters
| library(lubridate) | |
| library(dplyr) | |
| library(tidyr) | |
| library(readxl) | |
| library(purrr) | |
| library(here) | |
| setwd(here("2021-03")) | |
| wb <- "PD 2021 Wk 3 Input.xlsx" | |
| all_sheets <- wb %>% | |
| excel_sheets() %>% | |
| set_names() | |
| data <- map_dfr(all_sheets, | |
| ~ read_excel(wb, sheet = .x), | |
| .id = "sheet") %>% | |
| rename(Store = sheet) | |
| store_data <- data %>% | |
| gather('metric','Products_Sold', -c(Store, Date)) %>% | |
| separate(.,metric, sep = ' - ', into = c('Customer_Type','Product')) %>% | |
| mutate(Quarter = quarter(Date)) | |
| out1 <- store_data %>% | |
| group_by(Product, Quarter) %>% | |
| summarise(`Products Sold` = sum(Products_Sold), .groups = 'keep') | |
| out2 <- store_data %>% | |
| group_by(Store, Customer_Type, Product) %>% | |
| summarise(`Products Sold` = sum(Products_Sold), .groups = 'keep') | |
| write.csv(out1,'Product_Quarter_Output.csv') | |
| write.csv(out2,'Store_Customer_Product_Output.csv') |

Author
Author
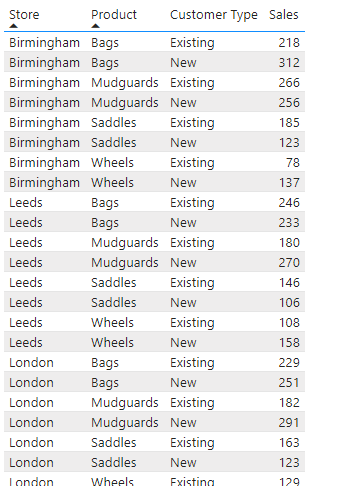
power bi output 2 - sales by store, product and customer type
Sign up for free
to join this conversation on GitHub.
Already have an account?
Sign in to comment
power bi output 1 - sales by quarter and product