Brief was to “make sure that all values displayed are consistent”. What's going on in this page (particularly the SQL and subsequent query hacking?)
Setting up is fairly straightforward
pip install django-debug-toolbarIndex: openly_mohinga/openly_mohinga/settings.py
IDEA additional info:
Subsystem: com.intellij.openapi.diff.impl.patch.CharsetEP
<+>UTF-8
===================================================================
--- openly_mohinga/openly_mohinga/settings.py (date 1508647785000)
+++ openly_mohinga/openly_mohinga/settings.py (revision )
@@ -134,6 +134,7 @@
]
MIDDLEWARE_CLASSES = (
+ 'debug_toolbar.middleware.DebugToolbarMiddleware',
'django.middleware.locale.LocaleMiddleware',
'django.middleware.common.CommonMiddleware',
'django.contrib.sessions.middleware.SessionMiddleware',
@@ -238,7 +239,8 @@
# project specific apps below
'myanmar',
'simple_locations',
- 'leaflet'
+ 'leaflet',
+ 'debug_toolbar'
)
LANGUAGES = (Index: openly_mohinga/openly_mohinga/urls.py
IDEA additional info:
Subsystem: com.intellij.openapi.diff.impl.patch.CharsetEP
<+>UTF-8
===================================================================
--- openly_mohinga/openly_mohinga/urls.py (date 1508647785000)
+++ openly_mohinga/openly_mohinga/urls.py (revision )
@@ -21,3 +21,9 @@
if 'rosetta' in settings.INSTALLED_APPS:
urlpatterns.append(url(r'^rosetta/', include('rosetta.urls')))
+
+if settings.DEBUG:
+ import debug_toolbar
+ urlpatterns = [
+ url(r'^__debug__/', include(debug_toolbar.urls)),
+ ] + urlpatterns
- Remember, goal is to be able to track and verify what's being queried wrt transaction amounts
- DJDT Lists SQL statements and time taken to execute statements on the page
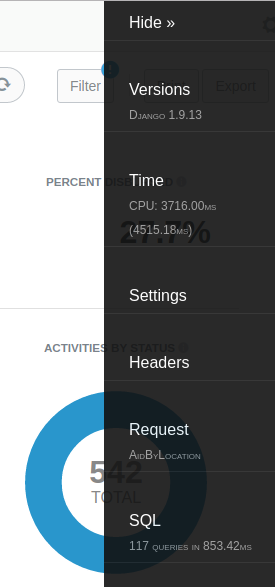
- 117 queries / 853ms
- A bit slow – but that’s not the biggest issue...
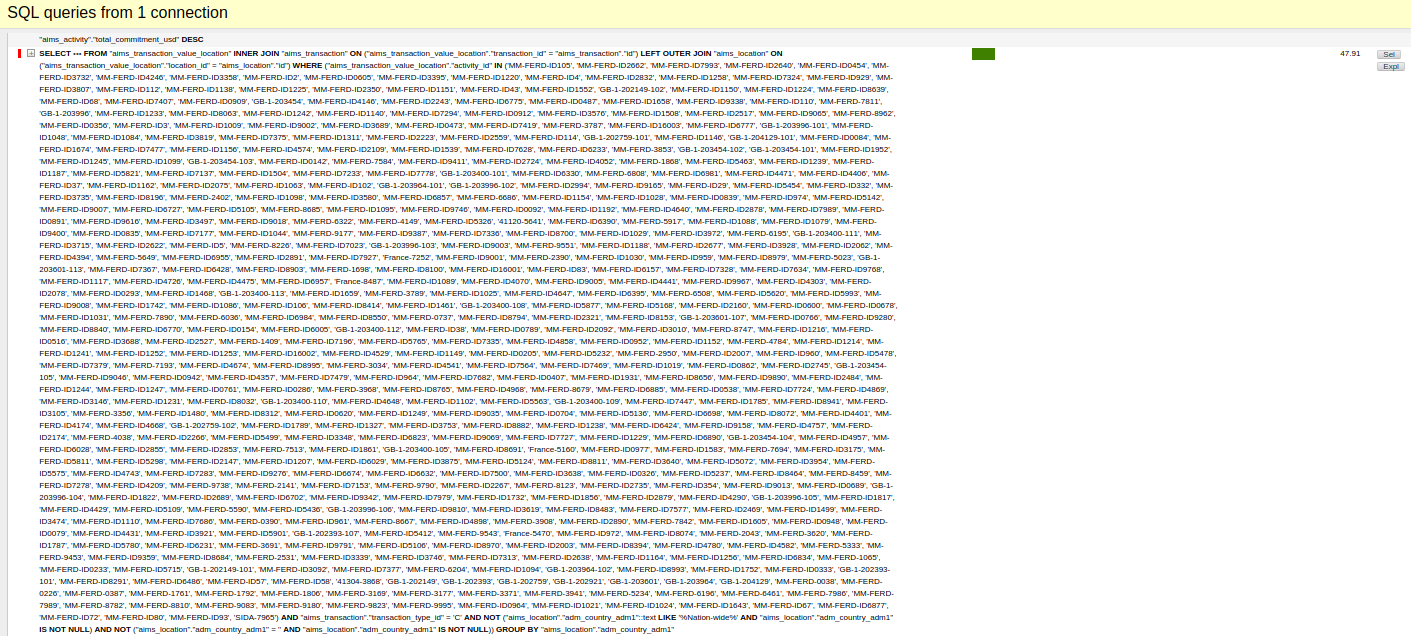
Select from really big list of ID’s? That can’t be good! Similar cases happened repeatedly.
2 issues:
- It's hard to see what's being queried here
- It's probably far less performant than it could be
DJDT gives the function name and the line it's called at
def commitments_by_state(activity_queryset, states_queryset):
    '''
    aid_by: state
    '''
    states = states_queryset.values('name', 'adm1_code')
    states_dict = {state['name'].lower(): state['adm1_code'] for state in states}
    commitments_by_location = {state['adm1_code']: 0 for state in states}

    activity_queryset = list(activity_queryset)
    locations = aims.TransactionValueLocation.objects.filter(activity__in=activity_queryset,
                                                             transaction__transaction_type='C')\
                                                     .exclude(location__adm_country_adm1__contains="Nation-wide")\
                                                     .exclude(location__adm_country_adm1='')\
                                                     .values('location__adm_country_adm1')\
                                                     .annotate(dollars=Sum('dollars'))

    for location in locations:
        state = location['location__adm_country_adm1'].lower()
        try:
            commitments_by_location[states_dict[state]] = base_utils.prettify_compact(location['dollars'])
        except KeyError:
            state = location['location__adm_country_adm1'].lower().split(' ')[0]
            commitments_by_location[states_dict[state]] = base_utils.prettify_compact(location['dollars'])
        commitments_by_location[states_dict[state] + '_natural'] = location['dollars']

    commitments_by_location = str(commitments_by_location).replace("u'", "'")

    return commitments_by_location
Looks pretty innocuous, but that list(queryset) is the culprit
Lesson 1:
in(list(queryset)) is really inefficient! And unneccessary in this case
There's still some lists of IDs being passed to SQL there - but we'll deal with those later...
We were using activity.sector_categories in the template This was causing two extra queries per activity sector on the page
If we comment out the relevant part of the template...
Index: openly/dashboard/templates/dashboard/activity_page.html
IDEA additional info:
Subsystem: com.intellij.openapi.diff.impl.patch.CharsetEP
<+>UTF-8
===================================================================
--- openly/dashboard/templates/dashboard/activity_page.html	(revision 5054bc79ada82bbf03c22de73013a99c1ccc4c5f)
+++ openly/dashboard/templates/dashboard/activity_page.html	(revision )
@@ -10,7 +10,7 @@
        <td class="no-wrap" {% if activity.id|to_int %} sorttable_customkey = "{{activity.id|to_int}}" {% endif %}><a href="{% url 'activity_profile' iati_identifier=activity.id %}"> {{activity.id}} </a></td>
        <td> {{activity.title}} </td>
        <td>
-            {% for sector_category in activity.sector_categories %} <br> {{sector_category}} {% endfor %}
+{#            {% for sector_category in activity.sector_categories %} <br> {{sector_category}} {% endfor %}#}
        </td>
        <td> {{activity.activity_status.name}} </td>
        <td class="no-wrap" style="text-align: right">
Cut the number of queries from ~130 to ~30! How then should we do ‘activity.sector_categories’?
Use Prefetch:
-
ONE extra query
-
Joined in Python
-
Prefetch makes one query per queryest
-
Basic difference between select_related and prefetch_related is that Prefetch works with M2M relationships
-
Note that Prefetch is very powerful - it supports filtering and select_related within a Prefetch
- Looping through a QuerySet and appending things to it?
- There it is! What it the purpose of this loop?
- It's appending .first_sector and .financing_organisation to each activity.
- Usages?... None??
- Often this view is used in pagination, so it's sliced after this calculation anyway.
- Django Func / Agg might be more appropriate if necessary
- We can use curl to get time to first byte with less overhead than Chrome Devtools
Something like
# Get a page 10 times and show the  time to first byte
curl -o /dev/null -s "http://127.0.0.1:8001/en/dashboard/location/?p=[1-10]" -w "%{time_starttransfer}\n"
Results (openly_mohinga @ master, DJDT Off)
| Saving (ms) | Load time ms | Saving ms | Saving (%) |
|---|---|---|---|
| Master | 2268 | ||
| First Opt : Prefetching Sectors | 2113 | 155 | 7% |
| Second Opt: Using QuerySet not List | 2039 | 229 | 10% |
| Third opt: Drop Unused Calulated Properties | 922 | 1346 | 59% |
| All Optimisations | 566 | 1702 | 75% |
This is another approach to finding bottlenecks which goes beyond the SQL calls
Profileserver:
manage.py runprofileserver 8001 --prof-path=/home/josh/Desktop/prof --use-cprofile –kcachegrind
Every call to the page will have a huge stats dump
- ./manage.py runprofileserver
- Curl/Wget/Chrome/FF/whatever the "dashboard/location" page
- Open the dump in kcachegrind
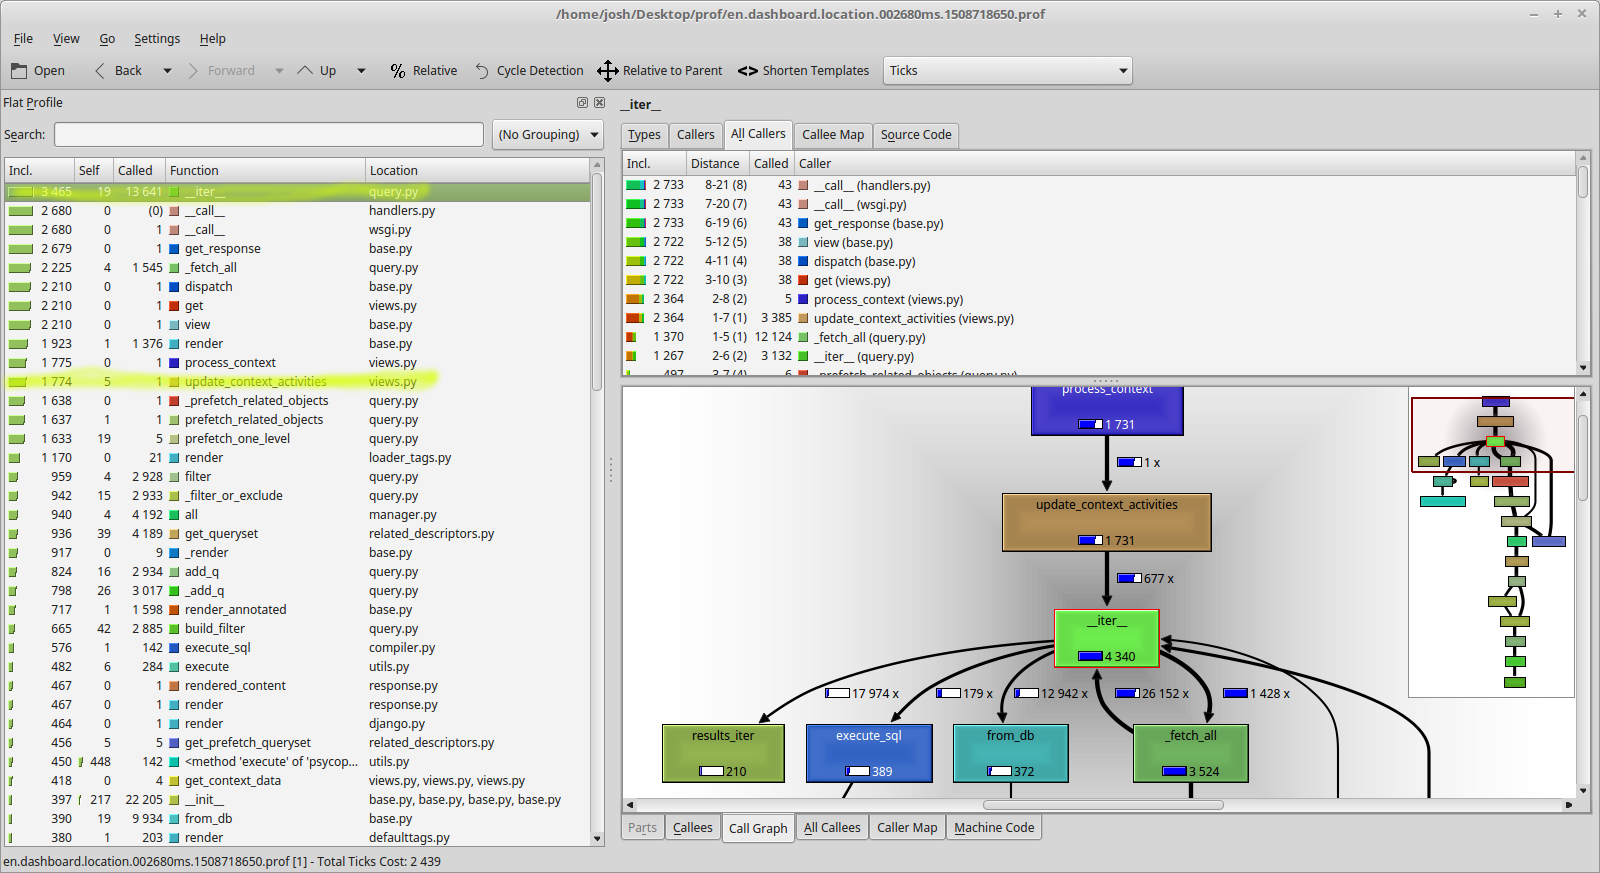
- Most of our effort is spent on 'iter', looping through something in a query...
- Our "prefetch"ing is pretty expensive too
- Iter is being called mostly in update_context_activities and we can track this back to dashboard/views
- We're looking for a loop in dashboard.views.update_context_activities()
So, this can sometimes lead us to the same conclusions as looking at DJDT output
def update_context_activities(self, context):
  activities = context['object_list'].prefetch_related(
      Prefetch('participating_organisations',
               queryset=aims.ActivityParticipatingOrganisation.objects.filter(role='Funding').order_by('id')),
      'title_set',
      'sector',
      'transaction_set__provider_organisation',
  ).select_related('activity_status')
  for activity in activities:
      # use try..except instead of .first() to use the prefetched organisations and sectors
      try:
          activity.financing_organisation = activity.participating_organisations.all()[0]
      except IndexError:
          activity.financing_organisation = None
      try:
          activity.first_sector = list(activity.sector.all())[0]
      except IndexError:
          activity.first_sector = None
  context['object_list'] = activities
dashboard.views.update_context_activities() now hardly registers in our timing iter is no longer our most time consuming thing Our time to fetch this page dropped by a huge amount! (Note that while we could see some inefficient SQL code with DJDT, we didn't see the cost of this reflected in DJDT since it's processing happening in Python not SQL)
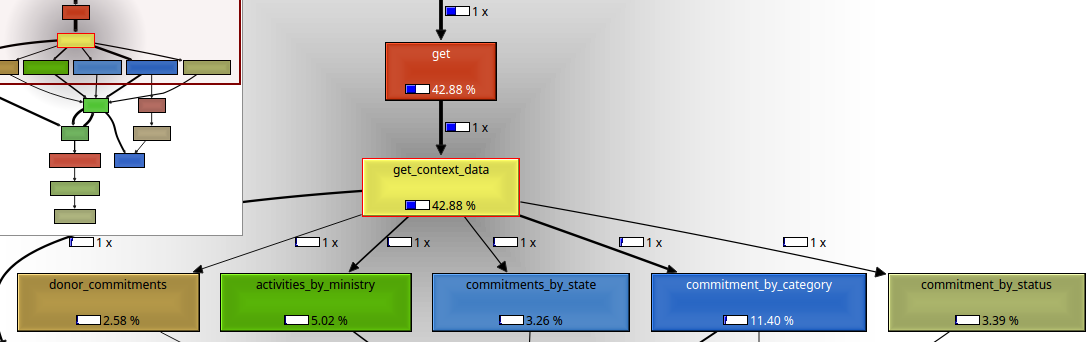
- Most of the list is now Django page rendering
- There might be some gains in get_context_data
- This is also the code which I was trying to work with in the first place anyway
- Call Graph shows us where the effort is being spent
- Incidentally, good function names can help a lot here
def commitment_by_category(activities, transactions, limit=3, json=True):

    vocabularies = ['DAC-3', 'DAC-5']

    # Tuple everything in "transactions"
    transactions_by_sector = tuple(
        transactions.filter(transaction_type='C').values_list(
            ...
        )
    )

    # Add a tuple element for "unspecified"
    unspecified_value = transactions.exclude(
        ...
    ).filter(
        ...
    ).aggregate(
        Sum('value_in__dollars')
    )['value_in__dollars__sum']

    transactions_by_sector += (('DAC-3', 'Not Specified', -1, 100.0, unspecified_value),)

    # Filter out vocabularies other than DAC-3 and adjust value by percentage
    transactions_by_sector = [t for t in transactions_by_sector if t[0] in vocabularies and t[1] is not None]
    transactions_by_sector = [(t[1], t[2], float(t[3] or 0) / 100 * (t[4] or 0)) for t in transactions_by_sector]

    commitment_by_category = []
    for sector, code in set([(t[0], t[1]) for t in transactions_by_sector]):
        transactions_for_sector = [t for t in transactions_by_sector if t[0] == sector]
        value = sum([t[2] for t in transactions_for_sector])
        commitment_dict = {'name': sector,
                           'value': value,
                           'pretty': base_utils.prettify_compact(value),
                           'code': int(code)}

        commitment_by_category.append(commitment_dict)

    commitment_by_category = sorted(commitment_by_category, key=lambda item: item['value'], reverse=True)

    if json:
        commitment_by_category = sorted(commitment_by_category, key=lambda category: category['value'], reverse=True)[:limit]
        commitment_by_category = str(commitment_by_category).replace(" u'", " '").replace(' u"', ' "')

    return commitment_by_category
(Check out the commit history for this part - in Pycharm right click and "annotate" This function creates a tuple from our queryset, mangles it into a list of dicts, returns it as a string representation. Oh, and possibly slicing it on the way...
Basically we're writing SQL with Python lists...
To cut a long story short, a lot of this was filtering, conditional sums etc - things which the PostgreSQL layer can do efficiently and easily via the ORM
Don't underestimate the power of the ORM!
Most of this code can be replaced with a single query.
- Select the right model to start with (i.e. the one you want to have the summary for)
- Use sensible filters
- Check out what annotations can do
  objects = aims.models.SectorCategory.objects.filter(**f)\
      .annotate(count=Count('sector__activitysector__activity'))\
      .annotate(
      dollars=Sum(
          F('sector__activitysector__percentage') *
          F('sector__activitysector__activity__transaction__value_in__dollars') /
          100,
      )
  ).order_by('-dollars')
output_commitment_by_category.md
This is also part of the first problem I was trying to solve - making sure these queries are clear and consistent! (Actually these were rewritten before profiling) Rewriting these to take advantage of the ORM reduced our average time to 398 ms
| Saving (ms) | Load time ms | Saving ms | Saving (%) |
|---|---|---|---|
| Master | 2268 | ||
| Previous Opts | 566 | 1702 | 75% |
| Replace Python loops with ORM | 383 | 1885 | 83% |
DJDT is a great tool to help profile poorly executed or multiple SQL queries, which would normally be the bottleneck in a page. Using the ORM efficiently and using select_related, prefetch_related efficiently can save hundreds of queries and in this case of the Openly Location dashboard reduced response time by ~75%
Once the queries "look" right, further gains could be had by using the output of the runprofileserver command to dive into the internals of your code
In this case response time was reduced by 80%+
- Compare the percentage split between "render" and "context":
- In dot file output from kcachegrind, the split between "render" and "view" changes from about 80:20 to 50:50 to 25:75
- Compare the difference between SQL times on openly@master and openly@editor_currencies_improvement
- This code identifies which currencies to show in the "Currency" select box on Transaction editor
- ~2.5 seconds saved by a really quick refactor!