Feb 24, 2021
by Keith Jenkins, GIS Librarian at Mann Library, Cornell University
uMap lets you create you own interactive maps by adding points, lines, and polygons manually or by importing existing geospatial data sources. It offers a wide variety of basemaps, and allows you to customize how your data appears on the map, and how users will interact with it. Maps and the underlying data can be easily shared and embedded in external websites like a Wordpress site.
uMap website: https://umap.openstreetmap.fr/en/
uMap is built by members of the OpenStreetMap (OSM) community, but it is a separate project. Many of the basemaps available in uMap are derived from OSM data. Any data you add to a map in uMap remains separate from the data in OSM.
-
Create a uMap login (using a github, bitbucket, twitter, or openstreetmap account)
- If you don't already have one of those, I recommend creating an openstreetmap
-
Create a map
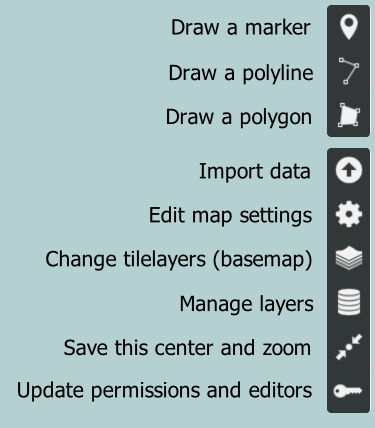
Here's a guide to the basic tools found on the right side of the map:
-
Add a point by clicking the Draw a marker tool
- Enter a "name" and "description"
- ignore the shape properties and interaction options for now -- this can be set for the entire layer
-
Enhance the description with basic formatting, images, and links
- Link with text:
[[http://example.com|text of the link]] - Image:
{{http://image.url.com}} - click the the '?' next to Description for more details
- Link with text:
Layers let us group together a set of similar features on the map, and set a consistent style for all the features in that layer. For example, we could have one point layer for churches, one for private houses, and another layer of lines showing routes.
- Edit the layer by clicking the Manage layers tool (stack of discs)
- Set the name
- Add a brief description (if we want to explain the layer to viewers of our map)
- Shape properties
- Interaction options
The basemap is the map that appears underneath your data, containing a standard map with boundaries, rivers, roads, placenames, and more. uMap offers several styles to choose from, most of which have been generated from OpenStreetMap data.
- Change the basemap by clicking the Change tilelayers tool (stack of squares)