Skip to content

Instantly share code, notes, and snippets.

@kiliman
Last active June 20, 2024 20:46
Show Gist options
  • Save kiliman/a9d7c874af03369a1d105a92560d89e9 to your computer and use it in GitHub Desktop.
Save kiliman/a9d7c874af03369a1d105a92560d89e9 to your computer and use it in GitHub Desktop.
Debug server-side Remix using VSCode

💡 HOWTO: Debug your server-side Remix code using VSCode

✨ New in Remix v1.3.5

The latest release of Remix fixes sourcemaps so you no longer need to use any hacks to set breakpoints in your route modules. Simply start the debugger and Remix will hit the breakpoint in your loaders and actions.

Debugging session even survives edits and Live Reload.

🐛 Launch VSCode debugger

There are a couple of options. You can use one of the launch configuration listed below, or simply open the Command Pallete and type: debug npm script. Then select the one you want to run. NOTE: Since this will relaunch your app, make sure you've stopped any running servers.

Debugging npm script

image

Attaching to a process

Pick the node process that is running the ./server/index.js file image

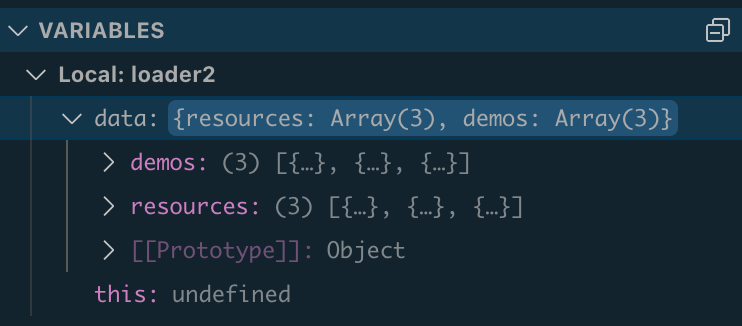
👀 View local variables

image

{
// Use IntelliSense to learn about possible attributes.
// Hover to view descriptions of existing attributes.
// For more information, visit: https://go.microsoft.com/fwlink/?linkid=830387
"version": "0.2.0",
"configurations": [
{
"command": "npm run dev",
"name": "Run npm run dev",
"request": "launch",
"type": "node-terminal",
"cwd": "${workspaceFolder}"
},
{
"name": "Attach by Process ID",
"processId": "${command:PickProcess}",
"request": "attach",
"skipFiles": ["<node_internals>/**"],
"type": "pwa-node"
}
]
}
@mdotmoment11
Copy link

@kiliman
I've gone through your video on this a few times (https://remix.guide/resources/HAFZri2Zbg1A) and although everything is in place (proper config, sourcemap set to true, debug function (and its import), breakpoint set), when I run the debugger, VSCode does not stop at the breakpoints I set.

They are visible in the 'BREAKPOINTS' section and the Terminal output says 'Debugger attached'. They proper command is being called within VSCode (npm run dev), but again, the Debug Console does not stop at the breaks. Any ideas?

@mdotmoment11
Copy link

@kiliman I've gone through your video on this a few times (https://remix.guide/resources/HAFZri2Zbg1A) and although everything is in place (proper config, sourcemap set to true, debug function (and its import), breakpoint set), when I run the debugger, VSCode does not stop at the breakpoints I set.

They are visible in the 'BREAKPOINTS' section and the Terminal output says 'Debugger attached'. They proper command is being called within VSCode (npm run dev), but again, the Debug Console does not stop at the breaks. Any ideas?

OK. Found your comment on adding a debugger statement and that worked. Thanks

@kiliman
Copy link
Author

kiliman commented Feb 9, 2024

@mdotmoment11 Interesting. The video was from a very early version of Remix. Debugging and breakpoints should just work. You shouldn't need to use debugger anymore.

Which version of Remix are you on now? Also what adapter are you using: Remix App Server, Express, Vercel, etc.?

@Shah-Sahab
Copy link

Shah-Sahab commented Mar 4, 2024

Followed the instructions above to create launch.json.
Versions below,

VSCode Version: 1.87.0.
"@remix-run/node": "^2.5.1",
    "@remix-run/react": "^2.5.1",
    "@remix-run/serve": "^2.5.1",

Copied the launch.json form above,

{
  // Use IntelliSense to learn about possible attributes.
  // Hover to view descriptions of existing attributes.
  // For more information, visit: https://go.microsoft.com/fwlink/?linkid=830387
  "version": "0.2.0",
  "configurations": [
    {
      "command": "npm run dev",
      "name": "Run npm run dev",
      "request": "launch",
      "type": "node-terminal",
      "cwd": "${workspaceFolder}"
    },
    {
      "name": "Attach by Process ID",
      "processId": "${command:PickProcess}",
      "request": "attach",
      "skipFiles": ["<node_internals>/**"],
      "type": "node"
    }
  ]
}

Tried pwa-node and just node both but no difference, same results. Debug points are disabled anytime the debugger is attached to the running process or directly started with the debugger.
image

@wayjake
Copy link

wayjake commented Apr 4, 2024

this appears to do the trick with my setup (fairly default create remix app with vite)

{
      "name": "Debug App",
      "type": "node-terminal",
      "request": "launch",
      "command": "yarn dev",
      "cwd": "${workspaceFolder}"
}

Sign up for free to join this conversation on GitHub. Already have an account? Sign in to comment