Document created for Cylc meetup in NIWA Wellington on February 2020.
Cylc 8 is mainly Python for the backend, and JS for the frontend. I use PyCharm when working on the backend, and WebStorm when on the frontend.
Here's a useful page on debugging & profiling that mentions pdb too, a command line debugger.
And the following will describe how I debug Cylc with PyCharm and WebStorm, two graphical IDE's.
- Python
- JS
In my IDE setup, I have normally three projects cloned/open.
cylc-uiservercylc-flowjupyterhub
Each project is cloned to a separate directory. Each project has its own virtual environment. But they are linked via Python egg-links.
Here's how I set up these projects, after they have been cloned (for jupyterhub, I checkout the tag matching the pip version!, e.g. .1.0.0) and their virtual environments have been initialized (i.e. pip install -e . on each application folder).
$ # Install Cylc UI Server first (editable)
$ cd cylc-uiserver
$ virtualenv venv
$ . venv/bin/activate
(venv) $ pip install -e .

$ # Then install Cylc Flow (editable), forcing it to uninstall the previous version first
(venv) $ cd ../cylc-flow
(venv) $ pip install -e .
...
...
Requirement already satisfied: promise<3,>=2.2 in /home/kinow/Development/python/workspace/cylc-uiserver/venv/lib/python3.7/site-packages (from graphql-relay<3,>=2->graphene<3,>=2.1->cylc-flow==8.0a1) (2.3)
Requirement already satisfied: rx<2,>=1.6 in /home/kinow/Development/python/workspace/cylc-uiserver/venv/lib/python3.7/site-packages (from graphql-core<3,>=2.1->graphene<3,>=2.1->cylc-flow==8.0a1) (1.6.1)
Installing collected packages: cylc-flow
  Attempting uninstall: cylc-flow
    Found existing installation: cylc-flow 8.0a1
    Uninstalling cylc-flow-8.0a1:
      Successfully uninstalled cylc-flow-8.0a1
  Running setup.py develop for cylc-flow
Successfully installed cylc-flow

(venv) $ # Then install JupyterHub (editable), forcing it to uninstall the previous version first
(venv) $ cd ../jupyterhub
(venv) $ pip install -e .
...
...
Requirement already satisfied: cryptography>=2.8 in /home/kinow/Development/python/workspace/cylc-uiserver/venv/lib/python3.7/site-packages (from pyopenssl->certipy>=0.1.2->jupyterhub==1.0.0) (2.8)
Requirement already satisfied: cffi!=1.11.3,>=1.8 in /home/kinow/Development/python/workspace/cylc-uiserver/venv/lib/python3.7/site-packages (from cryptography>=2.8->pyopenssl->certipy>=0.1.2->jupyterhub==1.0.0) (1.13.2)
Requirement already satisfied: pycparser in /home/kinow/Development/python/workspace/cylc-uiserver/venv/lib/python3.7/site-packages (from cffi!=1.11.3,>=1.8->cryptography>=2.8->pyopenssl->certipy>=0.1.2->jupyterhub==1.0.0) (2.19)
Installing collected packages: jupyterhub
  Attempting uninstall: jupyterhub
    Found existing installation: jupyterhub 1.0.0
    Uninstalling jupyterhub-1.0.0:
      Successfully uninstalled jupyterhub-1.0.0
  Running setup.py develop for jupyterhub
Successfully installed jupyterhub

(venv) $ cd ../cylc-uiserver
(venv) $ ls -lah venv/lib/python3.7/site-packages/cylc-flow.egg-link
-rw-rw-r-- 1 kinow kinow 52 Feb  4 12:22 venv/lib/python3.7/site-packages/cylc-flow.egg-link
(venv) $ cat venv/lib/python3.7/site-packages/cylc-flow.egg-link
/home/kinow/Development/python/workspace/cylc-flow
N.B: This means that jupyterhub and cylc-flow are normal development environments for each respective project. But my Cylc UI Server is an environment where I am running the code from each separate folder, which means I can easily put breakpoints with the IDE in each project - see section about Cylc UI Server to see how I use it.
I normally debug Cylc Flow as a Python program. And Cylc UI Server too, but attaching to a running process. I don't describe here how to attach to a running Cylc Flow WFS, but if you liked the option 2 of debugging Cylc UI Server, the same can be applied for a running background job or Cylc flow Python process.
The WFS (Workflow Service) is where the scheduler and its main loop run. The scheduler interacts with code that deals with database, xtrigger, the task pool, etc.
Debugging it with PyCharm is really simple, assuming you have already cloned Cylc Flow, then your next step is to open it on PyCharm.
After that, you can set a breakpoint somewhere in the main loop.

Then create a run configuration to launch a workflow.

Press the debug button, and that's it. You should now have the scheduler main loop stopped on your breakpoint, waiting for you to step into functions, step over, etc.

You should also have access to the stack frames, variables, threads, and also the console output.
In case you are troubleshooting an error, you may want to remove the breakpoint, but use a special breakpoint for exceptions. This kind of breakpoint is activated only when an exception happens.

In the conditions box, you can also write simple python code that is evaluated to decide whether the breakpoint must
be activated or not. For example, in the main loop, you could be looking for an exception that happens
when self.pool.do_reload is True. You can simply write self.pool.do_reload there.
The debugger also allows you to change values, watch variables, among other options. Pretty much everything you
can do with pdb, but with a GUI.
The script part of a task/job is not executed in the same Python process as the WFS. It's delegated to a
batch system manager, using the background one by default. But what is detailed here can be applied for at,
PBS, etc.
First you will need to set a breakpoint somewhere in the code where the batch system manager will find.

If you re-run the previous example of the WFS and the workflow five, the breakpoint will never be
activated. That's because we are debugging the WFS Python process. So we will need to use PyCharm's
[Remote Debugging(https://www.jetbrains.com/help/pycharm/remote-debugging-with-product.html) feature.
We will need to run the cylc run five debug configuration, but first we need to create a Python
Remote Debug configuration.

Note that I've used the port 12345. That updates the text block above the port text field. We now need
to copy that text, and paste somewhere in the code so that the Python process will execute this code.
If you do not want (or cannot) modify the source code, you can use a Python
site-specific configuration hook like a .pth or a
sitecustomize.py module.
In my case, I normally add the text to a __init__.py module, for example, cylc.flow.batch_sys_handlers.__init__.py.

The IDE will complain about not finding the pydev_pycharm import, but that's alright. It will be loaded
when you run your debug configuration.
Start the Python remote debugging configuration first. That should initialize a Python server listening for incoming connections.

Now start the cylc run five debug configuration as it was explained in the previous section.

At this point you should have two debugging sessions. One with the Cylc WFS, and one for the remote debugging
configuration. Any time a job is submitted to execute your script in the background, your breakpoint will be
activated.
This gives you the chance to inspect the job execution stack frame, variables, environment variables, or just pause it while you check the database, files, etc.
You can also choose which jobs you would like the breakpoint to be activated by using a condition in your breakpoint.

In the image above, it will stop the program execution for each foo job.

When debugging, you may want to know what's the size of certain objects, or how many objects
you have in memory. You can normally do that with smaller scripts, using cProfile, objgraph,
tracemalloc, pympler, etc.
But with Cylc Flow, you may find it easier to run an expression while your program is running, or when a breakpoint is activated, instead of modifying the source code to print or log that information.
Install one of these modules first, for example:
(venv) cylc-flow $ pip install objgraph
Collecting objgraph
  Using cached objgraph-3.4.1-py2.py3-none-any.whl (17 kB)
Collecting graphviz
  Using cached graphviz-0.13.2-py2.py3-none-any.whl (17 kB)
Installing collected packages: graphviz, objgraph
Successfully installed graphviz-0.13.2 objgraph-3.4.1
Now run the cylc run five debug configuration from the first section. Once the program
execution hits the breakpoint, click on the icon that looks like a calculator. That's the evaluate expression
option.

There you can paste something similar to this:
import objgraph
objgraph.show_most_common_types(limit=12)
And open the console to see the objgraph output.

In the first versions of the UI Server (or UIS), it could be executed as a standalone application. But that
changed once we delegated authentication to the hub. So the first thing we need when debugging Cylc UI Server
is an instance of jupyterhub.
It can be helpful to debug it too. Here's how you can launch a debug configuration from the Cylc UI Server project in PyCharm.
Create a new Python debug configuration, and specify venv/bin/jupyterhub as the script. And one last thing
that is important, is to specify the working directory. So that the application finds the correct
jupyterhub_config.py file.

Assuming you have set up your projects using egg-links (see top section for more), you should be able to set breakpoints in the jupyterhub project now.
An example of a useful place to set a breakpoint, is in the jupyterhub.spawner.LocalProcessSpawner#start
function, which is the default spawner used for development, responsible for spawning the process with
Cylc UI Server.

After starting jupyterhub, if you set a breakpoint in one of the Tornado handlers, it will never
be activated. That's because cylc-uiserver is running its own Python process. So we need to debug
that process if we want to use breakpoints in cylc-uiserver.
I know two ways to debug Cylc UI Server in PyCharm. I use option 1 normally when working on spawners, authenticators, or something related to JupyterHub.
For all other cases, especially when it involves UI requests, I use option 2.
Note: you do not need to be running jupyterhub in the debugger, you can run in a separate terminal,
unless you need breakpoints there too, or you are using the remote debugging method.
We will need a [Remote Debugging(https://www.jetbrains.com/help/pycharm/remote-debugging-with-product.html) configuration, just as in the case of Cylc Flow batch system managers.
That's because jupyterhub is spawning the Cylc UI Server. So that's the only way if we want to capture the
execution as soon as the cylc-uiserver process is launched.
Set a breakpoint somewhere like cylc.uiserver.main.py.

Add a remote debugging configuration for cylc-uiserver.

And add the pydev_pycharm code block somewhere like cylc.uiserver.__init__.py.

Now launch the remote debugging configuration first. Then start jupyterhub and once you access http://localhost:800
and select the option to launch - if not done automatically - your breakpoint should be activated.

This is the option that I use most of the times. And it's also pretty simple.
First, start jupyterhub in a terminal. Then navigate to http://localhost:8000 in your browser, until
it launches the cylc-uiserver. Now, in your IDE, set a breakpoint in Cylc UI Server. For example, in the
Tornado handler for WebSockets, cylc.uiserver.handlers.SubscriptionHandler.
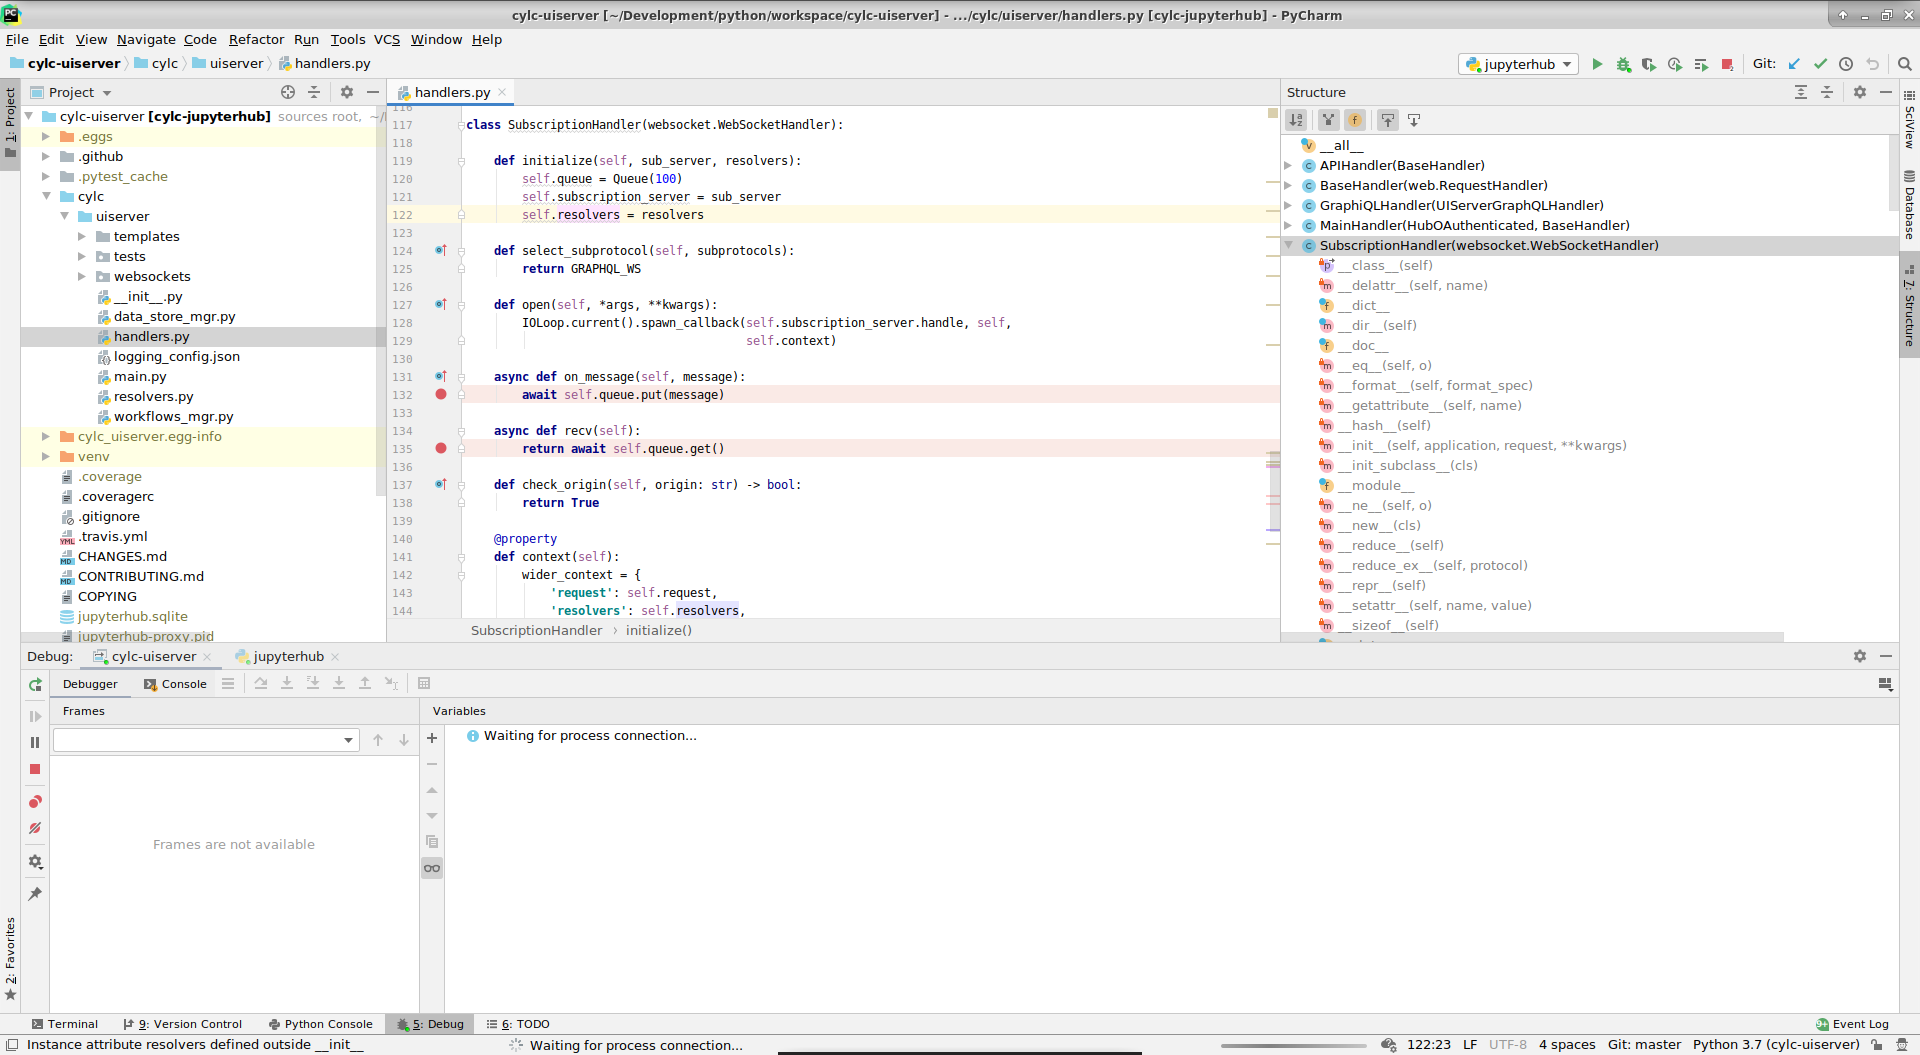
Now using the PyCharm menu, select "Run", then "Attach to Process". That will bring up a dialogue listing all Python processes found in your local environment.
Choose the one with cylc-uiserver.

Once done, the debugger should appear as running, and you should see your program execution halting once your UI sends a WebSocket request.

I don't have the configuration for debugging remote Python scripts on Docker containers, or on the HPC environment. But I used the remote debugging for PHP scripts in Docker.
It works similarly to the remote debugging configurations mentioned in the previous sections. The only difference being that you need to work how to get network connectivity from the container or HPC node back to your workstation.
Once that's done, you can start a remote debugging configuration listening to a port, and add the code block that connects back to the remote debugging server in the code on Docker or HPC.
That's useful when troubleshooting errors that happen only inside a container, or only in the HPC.
I have four ways of debugging the JS code in Cylc UI. Five if I include adding console.log statements all over
the code (which I try to avoid as I either get lost later, or forget to remove them occasionally).
This method works with Chrome or Firefox. And with npm run serve or npm run build:watch. In development,
we should have a sourcemap that allows us to debug the code.
You just need to press F12 (on Firefox Linux at least) to bring up the development tools, choose "Debugger",
then expand app.js or one of the other chunks produced by
dynamic imports / chunks (e.g. 1.js).
Once you find the place you want to stop the program execution, refresh the page and that should bring the debugger once the code hits the breakpoint.

You can view variables, the stack frames, evaluate expressions, etc. It supports breakpoints based on conditions, or when there are exceptions. Just like any other debugger, with more features like breaking on DOM changes, or based on events, but all running in your browser, with no IDE required.
Besides the browser debugger, you may want to try an extension like Vue Dev Tools. This extension gives your information about components, Vue application structure, events, Vuex state, and more.

Another nice trick, is that you can click on an element in the Vue Dev Tools under "Components" and Vue Dev Tools will create a local variable for you with a name like $vm0.

Going back to the "Console" tab, you should be able to use that $vm0 variable to access the selected component.
This allows you to inspect the Vue component instance programmatically, as well as invoke methods on it.

This mode of running Cylc UI will start a Node.js web server, which will serve the generated files to clients. We have an applicaiton mode called "offline" that loads mocked services and mocked data, so that developers can use certain components while the backend is offline.
So you just need to start the UI with npm run serve, or NODE_ENV="offline" npm run serve.
Set a breakpoint somewhere in the code. For example, in the Dashboard view in src/views/Dashboard.vue,
which gets loaded when you start the application.

Then create a JavaScript debug configuration.

Run it with the "Debug" button. That should launch a browser as per your configuration.

You can use the debugger pretty much the same way as with the browser debugger, or with the Python debugger. Step into functions, step out, return, inspect and watch variables, see the stack calls, etc.

There are also global variables that you can use, for example:
windowdocumentthis.$workflowService- etc
This mode of running Cylc UI will start the UI in development mode, watching for changes. The development
mode does less optimizations, so it builds much faster. Whenever you change a .js file within the src
directory tree, or .scss/.css files, it will re-build the project automatically.
If you have a browser tab open, it may try to talk to the backend via a WebSocket too. When the project is
re-build, the npm CLI will send a message to the browser to refresh automatically - doesn't always
happen, depending on other clients, etc.
Note that you will need the jupyterhub running, and wait for it to spawn cylc-uiserver, or launch it
via the UI.
Start the UI in this mode with npm run build:watch (alternatively, you can use a different mode with npm run build:watch -- --mode=production).
Set a breakpoint somewhere in the code. For example, in the Dashboard view in src/views/Dashboard.vue,
which gets loaded when you start the application.
Then create a JavaScript debug configuration.

Run it with the "Debug" button. That should launch a browser as per your configuration.

You can use the debugger pretty much the same way as with the browser debugger, or with the Python debugger. Step into functions, step out, return, inspect and watch variables, see the stack calls, etc.
There are also global variables that you can use, for example:
windowdocumentthis.$workflowService- etc
This is a mode that you may not need to use, but good to have documented anyway. Some time ago a user reported an issue with Firefox 60.8 LTS. I didn't have that browser, so downloaded from Mozilla FTP.
However, my debugger at that time was having issues with the launch configuration. And the source map (which was probably the issue) was hard to use to find where to put the breakpoint.
Firefox allows you to run a server debugger, for remote debugging.
So I started Firefox with ~/Downloads/firefox-60.8/bin/firefox --start-debugger-server, as per instructions
from the link above. And used port number 6000.
And created the following Firefox Remote configuration on WebStorm.

Launching it, the WebStorm debugger will work in-sync with the browser debugger. If you open the browser window and the IDE window side by side, you should see your actions reflecting on both.
When you jump into a function, it will happen on both. You can see the console log and variable on both windows too.
p.s. I normally configure everything to have Eclipse key bindings / shortcuts. So I avoided mentioning any shortcuts, but you can do pretty much everything you are seeing on the screenshots with very little mouse use.