n-dimensional hyperplane (line for 2D, plane for 3D) fitting via singular value decomposition method
Last active
October 28, 2023 18:12
-
-
Save lambdalisue/7201028 to your computer and use it in GitHub Desktop.
n-dimensional hyperplane (line for 2D, plane for 3D) fitting via singular value decomposition method
This file contains hidden or bidirectional Unicode text that may be interpreted or compiled differently than what appears below. To review, open the file in an editor that reveals hidden Unicode characters.
Learn more about bidirectional Unicode characters
| #!/usr/bin/env nosetests -vs | |
| # coding=utf-8 | |
| """ | |
| Linear algebra standard fitting module | |
| (C) 2013 hashnote.net, Alisue | |
| """ | |
| __author__ = 'Alisue (lambdalisue@hashnote.net)' | |
| __version__ = '0.1.0' | |
| __date__ = '2013-10-28' | |
| __all__ = ['standard_fit', 'projection', 'distance', 'function'] | |
| import numpy as np | |
| def standard_fit(X): | |
| """ | |
| Find (n - 1) dimensional standard (e.g. line in 2 dimension, plane in 3 | |
| dimension, hyperplane in n dimension) via solving Singular Value | |
| Decomposition. | |
| The idea was explained in the following references | |
| - http://www.caves.org/section/commelect/DUSI/openmag/pdf/SphereFitting.pdf | |
| - http://www.geometrictools.com/Documentation/LeastSquaresFitting.pdf | |
| - http://www.ime.unicamp.br/~marianar/MI602/material%20extra/svd-regression-analysis.pdf | |
| - http://www.ling.ohio-state.edu/~kbaker/pubs/Singular_Value_Decomposition_Tutorial.pdf | |
| Example: | |
| >>> XY = [[0, 1], [3, 3]] | |
| >>> XY = np.array(XY) | |
| >>> C, N = standard_fit(XY) | |
| >>> C | |
| array([ 1.5, 2. ]) | |
| >>> N | |
| array([-0.5547002 , 0.83205029]) | |
| Args: | |
| X: n x m dimensional matrix which n indicate the number of the dimension | |
| and m indicate the number of points | |
| Returns: | |
| [C, N] where C is a centroid vector and N is a normal vector | |
| """ | |
| # Find the average of points (centroid) along the columns | |
| C = np.average(X, axis=0) | |
| # Create CX vector (centroid to point) matrix | |
| CX = X - C | |
| # Singular value decomposition | |
| U, S, V = np.linalg.svd(CX) | |
| # The last row of V matrix indicate the eigenvectors of | |
| # smallest eigenvalues (singular values). | |
| N = V[-1] | |
| return C, N | |
| def projection(x, C, N): | |
| """ | |
| Create orthogonal projection matrix of x on the plane | |
| Args: | |
| x: n x m dimensional matrix | |
| C: n dimensional vector whicn indicate the centroid of the standard | |
| N: n dimensional vector which indicate the normal vector of the standard | |
| Returns: | |
| n x m dimensional matrix which indicate the orthogonal projection points | |
| on the plane | |
| """ | |
| rows, cols = x.shape | |
| NN = np.tile(N, (rows, 1)) | |
| D = distance(x, C, N) | |
| DD = np.tile(D, (cols, 1)).T | |
| return x - DD * NN | |
| def distance(x, C, N): | |
| """ | |
| Calculate an orthogonal distance between the points and the standard | |
| Args: | |
| x: n x m dimensional matrix | |
| C: n dimensional vector whicn indicate the centroid of the standard | |
| N: n dimensional vector which indicate the normal vector of the standard | |
| Returns: | |
| m dimensional vector which indicate the orthogonal disntace. the value | |
| will be negative if the points beside opposite side of the normal vector | |
| """ | |
| return np.dot(x-C, N) | |
| def function(x, C, N): | |
| """ | |
| Calculate an orthogonal projection of the points on the standard | |
| Args: | |
| x: (n-1) x m dimensional matrix | |
| C: n dimensional vector whicn indicate the centroid of the standard | |
| N: n dimensional vector which indicate the normal vector of the standard | |
| Returns: | |
| m dimensional vector which indicate the last attribute value of | |
| orthogonal projection | |
| """ | |
| Ck = C[0:-1] # centroid for known parameters | |
| Nk = N[0:-1] # normal for known parmeters | |
| Cu = C[-1] # centroid for unknown parameter | |
| Nu = N[-1] # normal for unknown parameter | |
| return np.dot(x-Ck, Nk) * -1.0 / Nu + Cu | |
| #=============================================================================== | |
| # | |
| # Unittest | |
| # | |
| #=============================================================================== | |
| if __name__ == '__main__': | |
| import doctest; doctest.testmod() |
This file contains hidden or bidirectional Unicode text that may be interpreted or compiled differently than what appears below. To review, open the file in an editor that reveals hidden Unicode characters.
Learn more about bidirectional Unicode characters
| #!/usr/bin/env nosetests -vs | |
| # coding=utf-8 | |
| """ | |
| (C) 2013 hashnote.net, Alisue | |
| """ | |
| __author__ = 'Alisue (lambdalisue@hashnote.net)' | |
| __version__ = '0.1.0' | |
| __date__ = '2013-10-28' | |
| import random | |
| import numpy as np | |
| from functools import wraps | |
| from functools import partial | |
| from nose.tools import * | |
| from nose.plugins.attrib import attr | |
| from testconfig import config | |
| import standard_fit | |
| def multi(default_runs=1): | |
| def inner(fn): | |
| @wraps(fn) | |
| def wrapper(*args, **kwargs): | |
| for i in range(int(config.get('runs', default_runs))): | |
| fn(*args, **kwargs) | |
| return wrapper | |
| return inner | |
| def multi_dimensional(dimension=9): | |
| def inner(fn): | |
| for d in range(1, dimension+1): | |
| @wraps(fn) | |
| def wrapper(d=d, *args, **kwargs): | |
| fn(*args, dimension=d, **kwargs) | |
| wrapper.__name__ += "_%dd" % d | |
| globals()[wrapper.__name__] = wrapper | |
| return inner | |
| def cosine(a, b): | |
| """ | |
| Calculate cosine similarity of two vectors | |
| Args: | |
| a: n dimensional vector A | |
| b: n dimensional vector B | |
| Returns: | |
| cosine value which 1, -1, and 0 indicates a) completely same direction, | |
| b) completely opposite direction, and c) orthgonal direction | |
| respectively. | |
| """ | |
| norma = np.linalg.norm(a) | |
| normb = np.linalg.norm(b) | |
| return np.dot(a, b) / (norma * normb) | |
| @multi_dimensional(9) | |
| @multi(10) | |
| @attr(matplotlib=False) | |
| def test_standard_fit(dimension): | |
| # define true parameters and function | |
| N = np.random.rand(dimension) | |
| N = N / np.linalg.norm(N) | |
| C = np.random.rand(dimension) | |
| F = partial(standard_fit.function, C=C, N=N) | |
| E = (np.random.rand(50) - 0.5) * 0.01 | |
| NN = np.tile(N, (50, 1)) | |
| EE = np.tile(E, (dimension, 1)).T | |
| # create corresponding points with some error | |
| e = np.random.normal(size=50) * 0.01 | |
| xy = np.random.rand(50, dimension-1) | |
| xyz = np.c_[xy, F(xy) + e] | |
| # shift xyz along N vector | |
| xyz = xyz + EE * NN | |
| # run standard_fit | |
| c, n = standard_fit.standard_fit(xyz) | |
| f = partial(standard_fit.function, C=c, N=n) | |
| # normal vector similarity check | |
| similarity_n = cosine(n, N) | |
| ok_(abs(similarity_n) > 0.99, | |
| "similarity_n (%f) is lower than threshold" % abs(similarity_n)) | |
| @multi_dimensional(9) | |
| @multi(10) | |
| @attr(matplotlib=False) | |
| def test_function(dimension): | |
| # define true parameters and function | |
| N = np.random.rand(dimension) | |
| N = N / np.linalg.norm(N) | |
| C = np.random.rand(dimension) | |
| F = partial(standard_fit.function, C=C, N=N) | |
| # create corresponding points with some error | |
| xy = np.random.rand(50, dimension-1) | |
| xyz = np.c_[xy, F(xy)] | |
| # run standard_fit | |
| c, n = standard_fit.standard_fit(xyz) | |
| f = partial(standard_fit.function, C=c, N=n) | |
| xyz_signal = np.c_[xy, F(xy)] | |
| xyz_fitted = np.c_[xy, f(xy)] | |
| np.testing.assert_array_almost_equal( | |
| xyz_signal, xyz_fitted, decimal=6) | |
| @multi_dimensional(9) | |
| @multi(10) | |
| @attr(matplotlib=False) | |
| def test_distance(dimension): | |
| # define true parameters and function | |
| N = np.random.rand(dimension) | |
| N = N / np.linalg.norm(N) | |
| C = np.random.rand(dimension) | |
| F = partial(standard_fit.function, C=C, N=N) | |
| E = (np.random.rand(50) - 0.5) * 0.01 | |
| NN = np.tile(N, (50, 1)) | |
| EE = np.tile(E, (dimension, 1)).T | |
| # create corresponding points with some error | |
| xy = np.random.rand(50, dimension-1) | |
| xyz = np.c_[xy, F(xy)] | |
| # shift xyz along N vector | |
| xyz = xyz + EE * NN | |
| # run standard_fit | |
| c, n = standard_fit.standard_fit(xyz) | |
| D = standard_fit.distance(xyz, C, N) | |
| np.testing.assert_array_almost_equal( | |
| D, E, decimal=6) | |
| d = standard_fit.distance(xyz, c, n) | |
| np.testing.assert_array_almost_equal( | |
| D, d, decimal=1) | |
| @multi_dimensional(9) | |
| @multi(10) | |
| @attr(matplotlib=False) | |
| def test_projection(dimension): | |
| # define true parameters and function | |
| N = np.random.rand(dimension) | |
| N = N / np.linalg.norm(N) | |
| C = np.random.rand(dimension) | |
| F = partial(standard_fit.function, C=C, N=N) | |
| E = (np.random.rand(50) - 0.5) * 0.01 | |
| NN = np.tile(N, (50, 1)) | |
| EE = np.tile(E, (dimension, 1)).T | |
| # create corresponding points with some error | |
| xy = np.random.rand(50, dimension-1) | |
| xyz = np.c_[xy, F(xy)] | |
| # shift xyz along N vector | |
| xyz = xyz + EE * NN | |
| # run standard_fit | |
| c, n = standard_fit.standard_fit(xyz) | |
| projected = standard_fit.projection(xyz, c, n) | |
| PC = projected - c | |
| for i, pc in enumerate(PC): | |
| dot = np.dot(pc, n) | |
| np.testing.assert_almost_equal(dot, 0) | |
| distances = standard_fit.distance(xyz, c, n) | |
| for x, p, d in zip(xyz, projected, distances): | |
| norm = np.linalg.norm(p - x) | |
| np.testing.assert_almost_equal(norm, abs(d)) | |
| try: | |
| import matplotlib.pyplot as pl | |
| from mpl_toolkits.mplot3d import Axes3D | |
| def extend_plt3d(plt3d): | |
| def draw_vector(p1, p2, *args, **kwargs): | |
| from matplotlib.patches import FancyArrowPatch | |
| from mpl_toolkits.mplot3d import proj3d | |
| class Arrow3D(FancyArrowPatch): | |
| def __init__(self, xs, ys, zs, *args, **kwargs): | |
| FancyArrowPatch.__init__(self, (0,0), (0,0), *args, **kwargs) | |
| self._verts3d = xs, ys, zs | |
| self._verts3d = [x.flatten() for x in self._verts3d] | |
| def draw(self, renderer): | |
| xs3d, ys3d, zs3d = self._verts3d | |
| xs, ys, zs = proj3d.proj_transform(xs3d, ys3d, zs3d, renderer.M) | |
| self.set_positions((xs[0],ys[0]),(xs[1],ys[1])) | |
| FancyArrowPatch.draw(self, renderer) | |
| xs = np.array([p1[0], p2[0]]) | |
| ys = np.array([p1[1], p2[1]]) | |
| zs = np.array([p1[2], p2[2]]) | |
| plt3d.add_artist(Arrow3D(xs, ys, zs, *args, | |
| mutation_scale=20, arrowstyle="-|>", **kwargs)) | |
| setattr(plt3d, 'vector', draw_vector) | |
| return plt3d | |
| def create_vector(top, tail=(0, 0, 0)): | |
| return np.array([tail, top]) | |
| def rotate(vector, normal, theta): | |
| x, y, z = normal | |
| R = np.array([ | |
| [0, -z, y], | |
| [z, 0, -x], | |
| [-y, x, 0], | |
| ]) | |
| I = np.identity(3) | |
| M = I + np.sin(theta) * R + (1 - np.cos(theta)) * np.dot(R, R) | |
| return np.dot(M, vector) | |
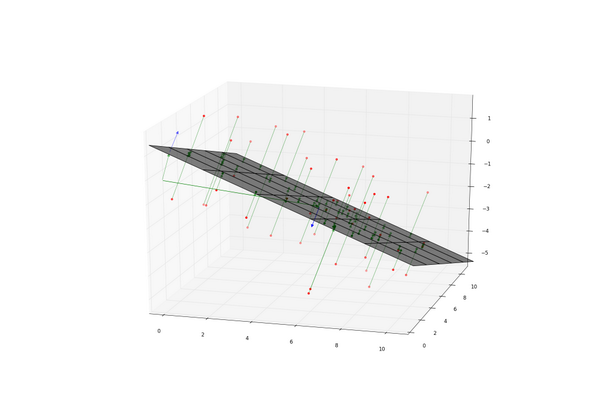
| @attr(matplotlib=True) | |
| def test_plot_standard_plane(): | |
| scale = 10 | |
| # define true parameters and function | |
| O = np.array([0, 0, 0]) | |
| N = np.random.rand(3) | |
| N = N / np.linalg.norm(N) | |
| C = np.random.rand(3) | |
| F = partial(standard_fit.function, C=C, N=N) | |
| E = (np.random.rand(50) - 0.5) * scale / 2 | |
| NN = np.tile(N, (50, 1)) | |
| EE = np.tile(E, (3, 1)).T | |
| # create corresponding points with some error | |
| xy = np.random.rand(50, 2) * scale | |
| xyz = np.c_[xy, F(xy)] | |
| # shift xyz along N vector | |
| xyz = xyz + EE * NN | |
| # run standard_fit | |
| c, n = standard_fit.standard_fit(xyz) | |
| # projection | |
| prj = standard_fit.projection(xyz, c, n) | |
| # find farthest point | |
| norms = np.apply_along_axis(np.linalg.norm, 1, prj - c) | |
| ind = np.argmax(norms) | |
| farthest = prj[ind] | |
| # find surface minimum and maximum value of each axis | |
| p1 = rotate(farthest - c, n, np.pi/4) + c | |
| ps = np.array([ | |
| p1, | |
| rotate(p1 - c, n, np.pi/2) + c, | |
| rotate(p1 - c, n, np.pi) + c, | |
| rotate(p1 - c, n, -np.pi/2) + c, | |
| ]) | |
| pmin = np.min(ps, axis=0) | |
| pmax = np.max(ps, axis=0) | |
| xmin, xmax = pmin[0], pmax[0] | |
| ymin, ymax = pmin[1], pmax[1] | |
| zmin, zmax = pmin[2], pmax[2] | |
| # create surface grid | |
| zf = lambda x, y: (n[0]*(x-c[0])+n[1]*(y-c[1])) * -1.0 / n[2] + c[2] | |
| mgx, mgy = np.meshgrid( | |
| np.linspace(xmin, xmax), | |
| np.linspace(ymin, ymax), | |
| ) | |
| mgz = zf(mgx, mgy) | |
| # draw | |
| plt3d = pl.subplot(111, projection='3d') | |
| plt3d = extend_plt3d(plt3d) | |
| plt3d.scatter(*np.hsplit(xyz, 3), color='r') | |
| plt3d.scatter(*np.hsplit(prj, 3), color='g') | |
| plt3d.plot_surface(mgx, mgy, mgz, color="k", alpha=0.5) | |
| plt3d.vector(O, c, color='g') | |
| plt3d.vector(O, C, color='g', alpha=0.5) | |
| plt3d.vector(c, n+c, color='b') | |
| plt3d.vector(C, N+C, color='b', alpha=0.5) | |
| for o, p in zip(xyz, prj): | |
| plt3d.vector(o, p, color='g', alpha=0.5) | |
| pl.show() | |
| except ImportError: | |
| pass |
Sign up for free
to join this conversation on GitHub.
Already have an account?
Sign in to comment