Created
November 25, 2021 16:16
-
-
Save maurapintor/d5ef09ad79fe415bcc822300280313e3 to your computer and use it in GitHub Desktop.
Plot debugging curves with secml
This file contains bidirectional Unicode text that may be interpreted or compiled differently than what appears below. To review, open the file in an editor that reveals hidden Unicode characters.
Learn more about bidirectional Unicode characters
| import matplotlib.pyplot as plt | |
| from secml.adv.attacks import CFoolboxPGD | |
| from secml.array import CArray | |
| from secml.core.constants import inf | |
| from secml.data.loader import CDataLoaderMNIST | |
| from secml.ml import CNormalizerMinMax | |
| from secml.ml.peval.metrics import CMetric | |
| from secml.model_zoo import load_model | |
| class CMetricScoreDifference: | |
| def __init__(self, clf): | |
| self._clf = clf | |
| def score_difference(self, x, y0, y_t=None): | |
| _, scores_x = self._clf.predict(x, return_decision_function=True) | |
| rows = CArray.arange(x.shape[0]) | |
| if y_t is not None: | |
| score_maximize = scores_x[rows, y_t].ravel() | |
| score_minimize = self.competing_score(scores_x, exclude=y_t) | |
| else: | |
| score_maximize = self.competing_score(scores_x, exclude=y0) | |
| score_minimize = scores_x[rows, y0].ravel() | |
| score_diff = score_minimize - score_maximize | |
| return score_maximize.ravel(), score_minimize.ravel(), \ | |
| score_diff.ravel() | |
| def competing_score(self, logits, exclude): | |
| other_logits = logits.deepcopy() | |
| other_logits[:, exclude] = -inf | |
| return other_logits.max(-1).ravel() | |
| n_tr = 1000 | |
| n_ts = 250 | |
| random_state = 0 | |
| lb = 0.0 | |
| ub = 1.0 | |
| loader = CDataLoaderMNIST() | |
| digits = (1, 5, 9) | |
| tr = loader.load('training', digits=digits) | |
| ts = loader.load('testing', digits=digits, num_samples=n_ts) | |
| clf = load_model('mnist159-cnn') | |
| nmz = CNormalizerMinMax() | |
| tr.X = nmz.fit_transform(tr.X) | |
| ts.X = nmz.transform(ts.X) | |
| label_torch = clf.predict(ts.X, return_decision_function=False) | |
| metric = CMetric.create('accuracy') | |
| acc_torch = metric.performance_score(ts.Y, label_torch) | |
| print("Model Accuracy: {}".format(acc_torch)) | |
| # create adversarial example | |
| idx = 20 | |
| pt1 = ts[idx, :] | |
| y_target = None | |
| p = inf | |
| if p == 1: | |
| norm, dual_norm, distance, dmax = 1, inf, 'l1', 20 | |
| elif p == 2: | |
| norm, dual_norm, distance, dmax = 2, 2, 'l2', 3 | |
| elif p == inf: | |
| norm, dual_norm, distance, dmax = inf, 1, 'linf', 0.3 | |
| else: | |
| raise NotImplementedError | |
| attack = CFoolboxPGD(steps=100, classifier=clf, y_target=y_target, | |
| lb=lb, ub=ub, epsilons=dmax, distance=distance, | |
| random_start=False) | |
| y_pred, _, adv_ds, _ = attack.run(pt1.X, pt1.Y) | |
| # compute info for plotting | |
| path = attack.x_seq | |
| grad_path = CArray.zeros(path.shape) | |
| for i in range(path.shape[0]): | |
| grad_path[i, :] = \ | |
| attack.objective_function_gradient(path[i, :]) | |
| y_pred, scores = \ | |
| clf.predict(path, return_decision_function=True) | |
| # score difference | |
| score_maximize, score_minimize, score_diff = \ | |
| CMetricScoreDifference(clf).score_difference(path, pt1.Y, y_target) | |
| # loss functions and slope | |
| atk_loss = attack.objective_function(path) | |
| distance = CArray.norm_2d(pt1.X - path, axis=-1, order=norm).ravel() | |
| grad_norm = CArray.norm_2d(CArray.zeros(pt1.X.shape) - grad_path, axis=-1, order=dual_norm).ravel() | |
| scores_path = clf.decision_function(path) | |
| # plotting | |
| from secml.figure import CFigure | |
| num_rows = 2 | |
| num_cols = 3 | |
| fig = CFigure(5 * num_rows, 5 * num_cols) | |
| fig.subplot(num_rows, num_cols, 1) | |
| fig.sp.plot(score_diff, label='diff') | |
| fig.sp.plot(score_maximize, label='atk score') | |
| fig.sp.plot(score_minimize, label='def score') | |
| fig.sp.legend() | |
| fig.sp.title("score diff") | |
| fig.sp.xlabel("steps") | |
| fig.subplot(num_rows, num_cols, 2) | |
| fig.sp.plot(atk_loss, label='atk loss') | |
| fig.sp.title("loss function") | |
| fig.sp.legend() | |
| fig.sp.xlabel("steps") | |
| fig.subplot(num_rows, num_cols, 3) | |
| fig.sp.plot(distance) | |
| fig.sp.title("distance from x0") | |
| fig.sp.xlabel("steps") | |
| fig.subplot(num_rows, num_cols, 4) | |
| fig.sp.plot(grad_norm) | |
| fig.sp.title("grad norm") | |
| fig.sp.xlabel("steps") | |
| fig.subplot(num_rows, num_cols, 5) | |
| fig.sp.plot(scores_path) | |
| fig.sp.title("Scores") | |
| fig.sp.xlabel("steps") | |
| plt.tight_layout() | |
| fig.savefig('plots.png') | |
| fig.show() |
Sign up for free
to join this conversation on GitHub.
Already have an account?
Sign in to comment
The script produces debugging curves for adversarial attacks, to inspect how the optimization is going.
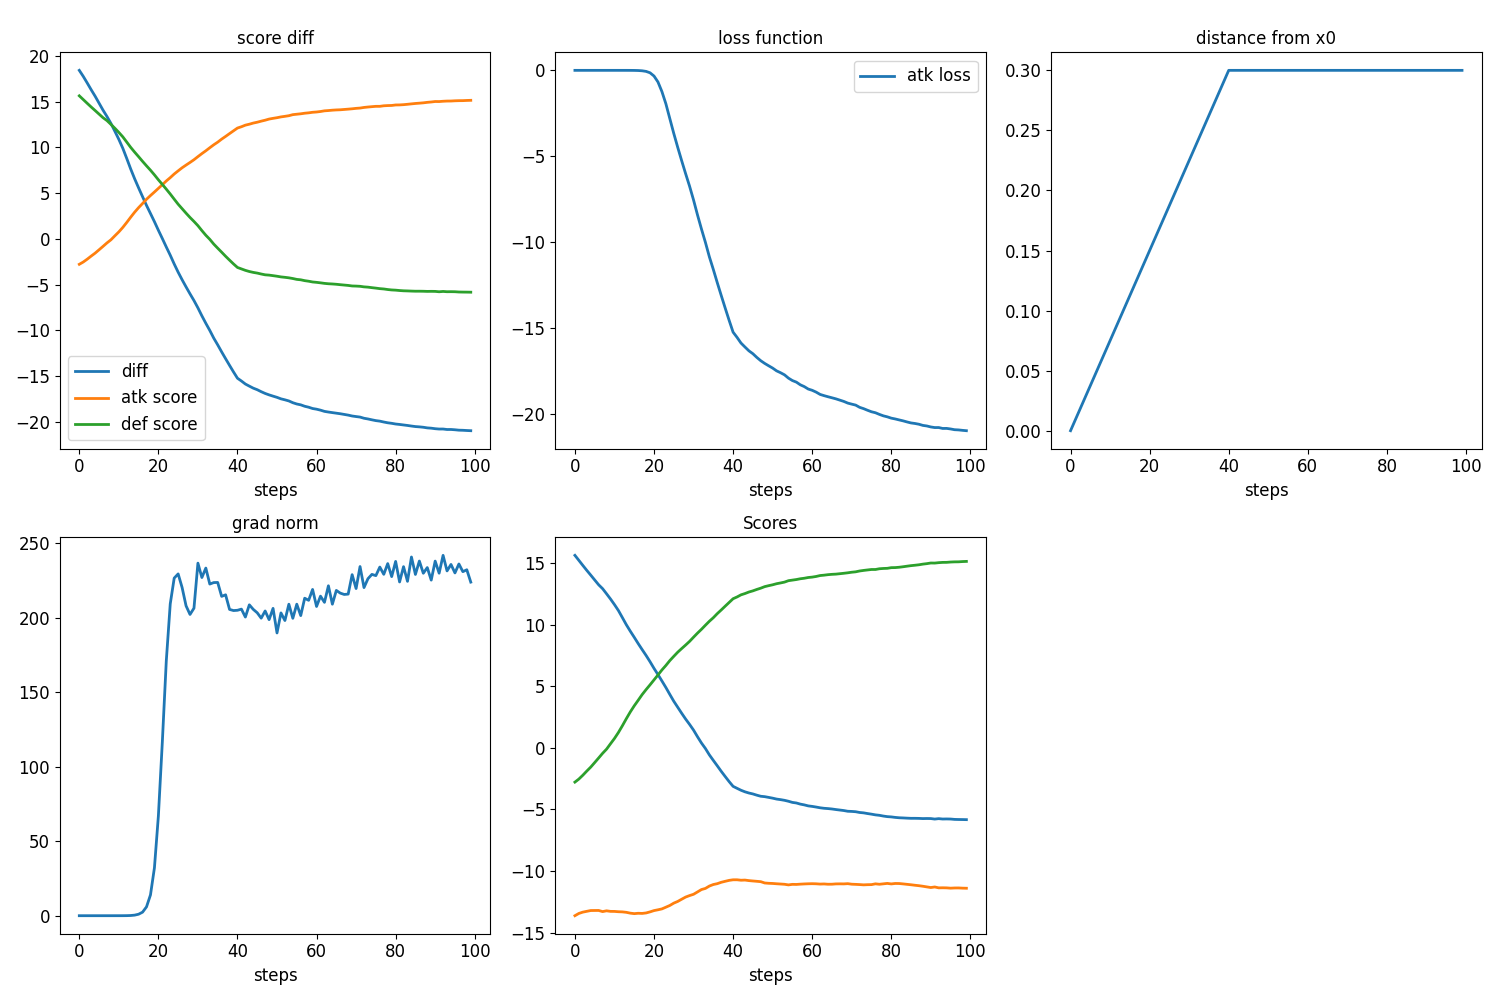
The result should look like this: