Last active
June 22, 2021 09:03
-
-
Save maxnoe/41730e6ca1fac01fc06f0feab5c3566d to your computer and use it in GitHub Desktop.
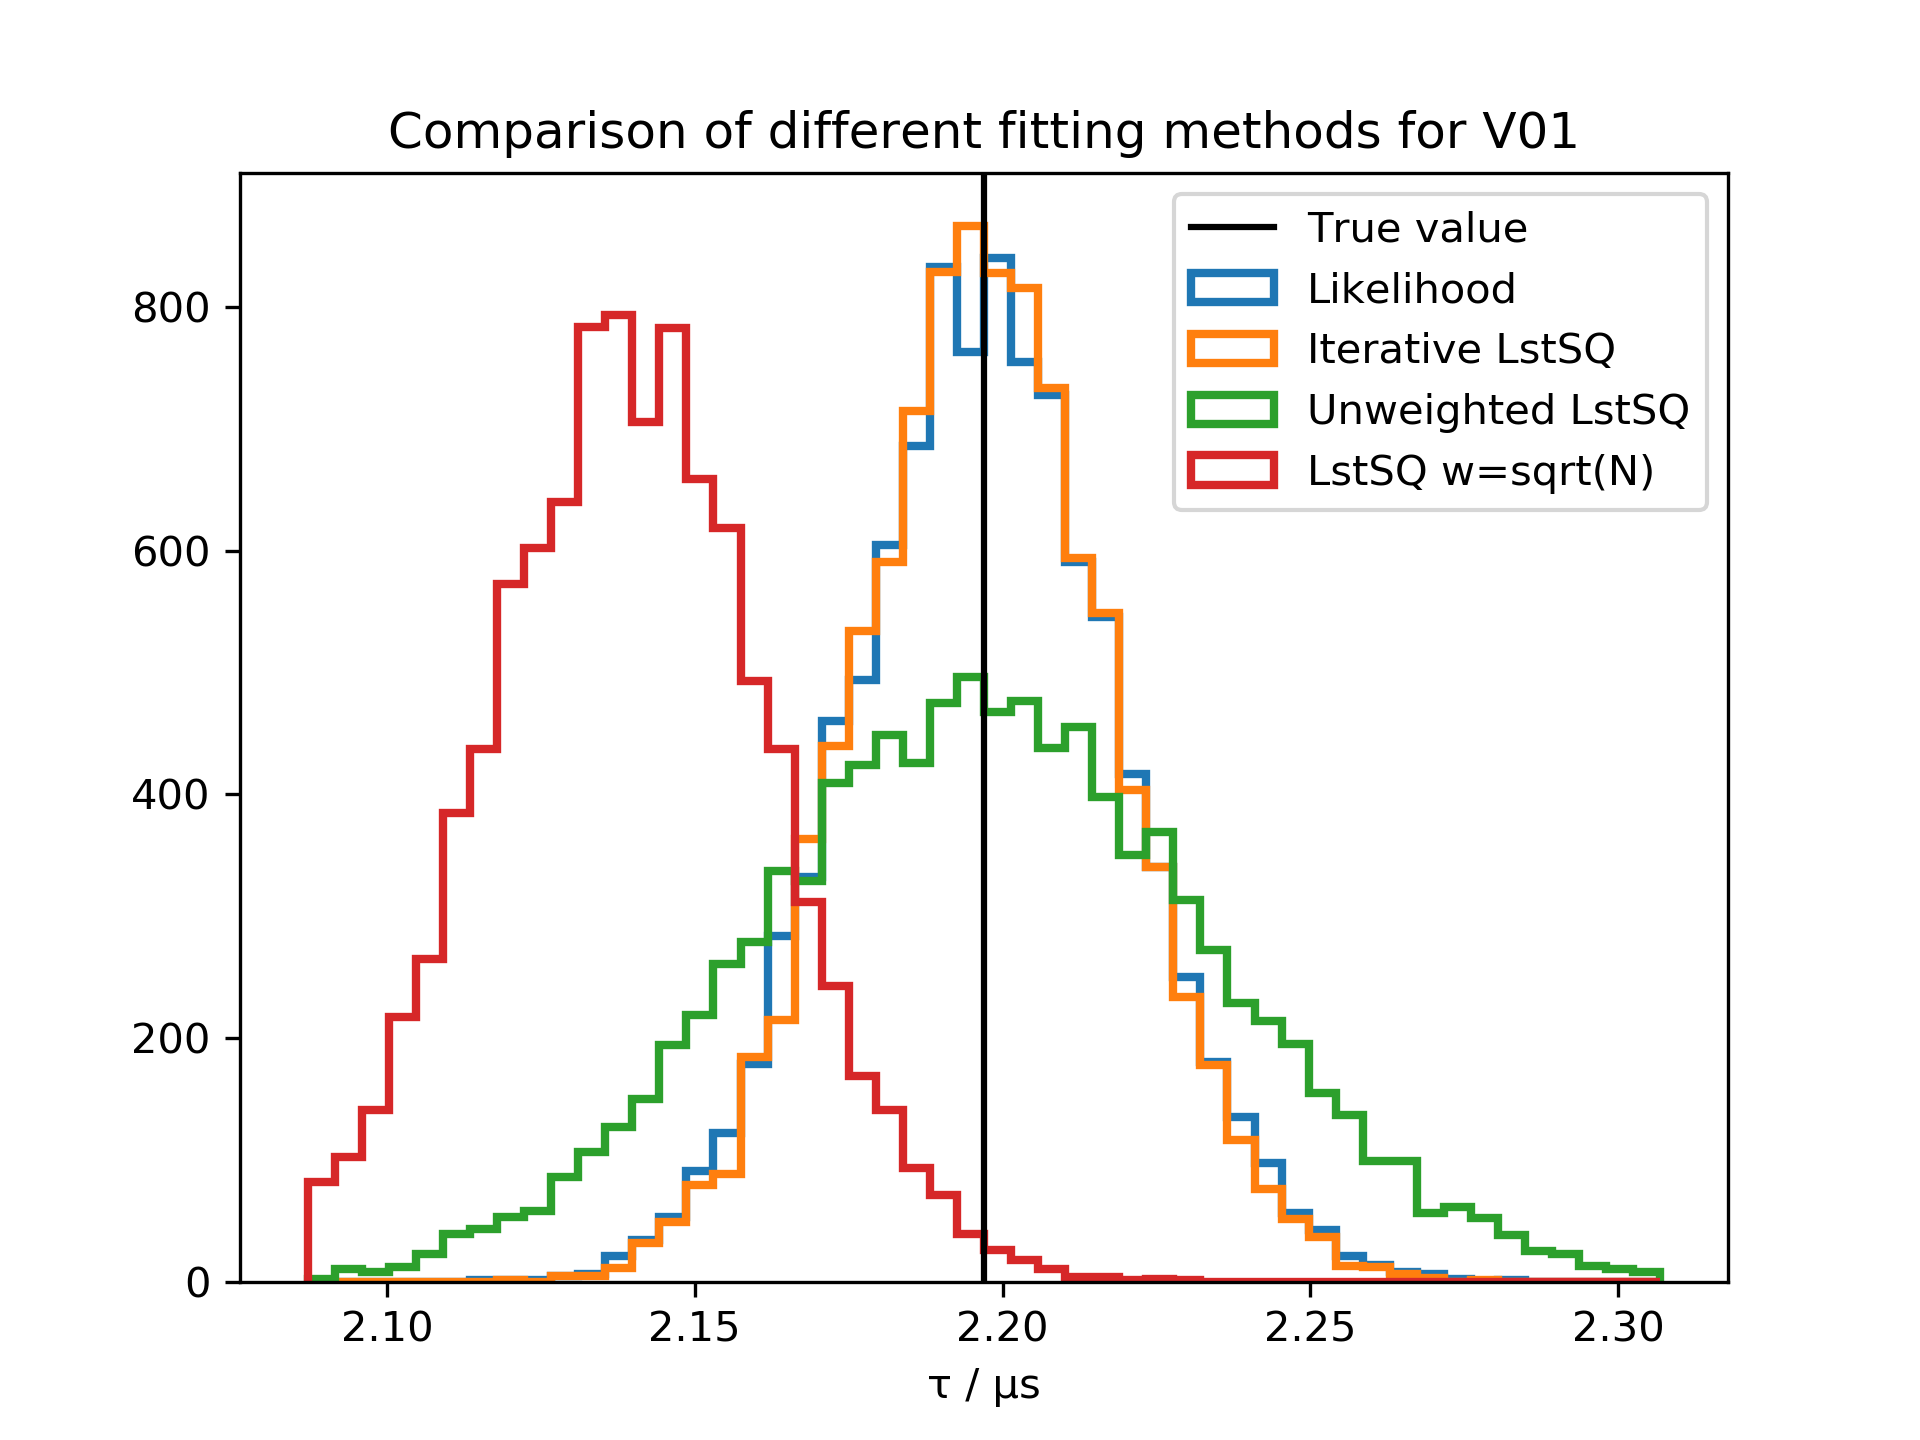
Fitting histograms of muon lifetimes. Do not estimate weights from your data!
This file contains hidden or bidirectional Unicode text that may be interpreted or compiled differently than what appears below. To review, open the file in an editor that reveals hidden Unicode characters.
Learn more about bidirectional Unicode characters
| import numpy as np | |
| from scipy.optimize import curve_fit, minimize | |
| import matplotlib.pyplot as plt | |
| from tqdm import tqdm | |
| from scipy.stats import poisson | |
| MUON_LIFETIME = 2.196_981_1 | |
| bins = np.linspace(0.5, 12, 150) | |
| bin_centers = 0.5 * (bins[1:] + bins[:-1]) | |
| bin_width = np.diff(bins)[0] | |
| N = 15000 | |
| def exponential(t, tau): | |
| return np.exp(-t / tau) / tau | |
| def integrate_exponential(bins, tau): | |
| return np.exp(-bins[:-1] / tau) - np.exp(-bins[1:] / tau) | |
| def f(t, tau): | |
| res = N * bin_width * exponential(t, tau) | |
| return res | |
| def muon_experiment(N): | |
| times = np.random.exponential(MUON_LIFETIME, size=N) | |
| hist, _ = np.histogram(times, bins=bins) | |
| return hist | |
| def fit_unweighted(hist): | |
| '''Unweighted Least Squares Fit''' | |
| opt, cov = curve_fit( | |
| f, bin_centers, hist, | |
| p0=[2.2], | |
| bounds=(1e-10, 1e10), | |
| ) | |
| return opt, cov | |
| def fit_sqrt_n(hist): | |
| '''Least Squares Fit using sqrt(N) as error''' | |
| non_zero = hist > 0 | |
| opt, cov = curve_fit( | |
| f, bin_centers[non_zero], hist[non_zero], | |
| sigma=np.sqrt(hist[non_zero]), | |
| absolute_sigma=True, | |
| p0=[2.2], | |
| bounds=(1e-10, 1e10), | |
| ) | |
| return opt, cov | |
| def fit_likelihood(hist): | |
| def poisson_neg_llh(params, hist): | |
| '''Poissonian negative log likelihood, to be minimized to get tau''' | |
| tau = params[0] | |
| # correct for not sampling the full lifetime range [0, oo] | |
| norm = integrate_exponential(bins[[0, -1]], tau) | |
| expected = np.sum(hist) * integrate_exponential(bins, tau) / norm | |
| return -0.001 * np.sum(poisson.logpmf(hist, expected)) | |
| result = minimize( | |
| poisson_neg_llh, | |
| x0=[2.1], | |
| args=(hist, ), | |
| bounds=[ | |
| (1e-10, 1e10), # tau must be positive | |
| ] | |
| ) | |
| if not result.success: | |
| print(result) | |
| raise ValueError('likelihood fit failed') | |
| return result.x, result.hess_inv | |
| def fit_iterative(hist, eps=1e-15, max_iterations=100): | |
| ''' | |
| Least Squares Fit using sqrt(lambda) as error. | |
| First iteration is unweighted, then we iterate using the previous | |
| solution as error estimation until we converge | |
| ''' | |
| opt, cov = curve_fit(f, bin_centers, hist, p0=[2.2], bounds=[1e-15, np.inf]) | |
| # refit with error estimation from previous fit until converged | |
| delta = np.inf | |
| i = 0 | |
| while delta > eps: | |
| assert i < max_iterations, 'Fit does not converge' | |
| # calculate error from last solution | |
| sigma = np.sqrt(f(bin_centers, *opt)) | |
| old_opt = opt | |
| opt, cov = curve_fit( | |
| f, bin_centers, hist, | |
| p0=opt, # use previous iteration as initial guess | |
| sigma=sigma, absolute_sigma=True, | |
| bounds=[1e-15, np.inf], | |
| ) | |
| delta = np.sum(np.abs(opt - old_opt)) | |
| i += 1 | |
| return opt, cov | |
| tau_sqrt_n = [] | |
| tau_it = [] | |
| tau_likelihood = [] | |
| tau_unweighted = [] | |
| for i in tqdm(range(10000)): | |
| hist = muon_experiment(15000) | |
| opt, cov = fit_unweighted(hist) | |
| tau_unweighted.append(opt[0]) | |
| opt, cov = fit_sqrt_n(hist) | |
| tau_sqrt_n.append(opt[0]) | |
| opt, cov = fit_iterative(hist) | |
| tau_it.append(opt[0]) | |
| opt, cov = fit_likelihood(hist) | |
| tau_likelihood.append(opt[0]) | |
| results = { | |
| 'Likelihood': np.array(tau_likelihood), | |
| 'Iterative LstSQ': np.array(tau_it), | |
| 'Unweighted LstSQ': np.array(tau_unweighted), | |
| 'LstSQ w=sqrt(N)': np.array(tau_sqrt_n), | |
| } | |
| w = max(len(k) for k in results) | |
| for key, value in results.items(): | |
| print(f'{key:{w}}: {value.mean():.3f} ± {value.std():.3f}') | |
| eps = 0.05 | |
| low = (1 - eps) * MUON_LIFETIME | |
| high = (1 + eps) * MUON_LIFETIME | |
| kwargs = dict(bins=50, range=[low, high], histtype='step', lw=2) | |
| for label, values in results.items(): | |
| plt.hist( | |
| values, | |
| **kwargs, | |
| label=label, | |
| ) | |
| plt.axvline(MUON_LIFETIME, color='k', label='True value') | |
| plt.xlabel('τ / µs') | |
| plt.title('Comparison of different fitting methods for V01') | |
| plt.legend() | |
| plt.savefig('muon_lifetime_fit_comparison.png', dpi=300) |
Sign up for free
to join this conversation on GitHub.
Already have an account?
Sign in to comment
Result:
Plot: