I was trying to see how hard it would be to port Paste to Python 3.
Paste uses nose. nosetests prints something like
FAILED (errors=90, failures=5)
at the end of the test run. I wanted to plot the number of failures to see how I was progressing:
./run32
vi ...
./run32
vi ...
./run32
./plot
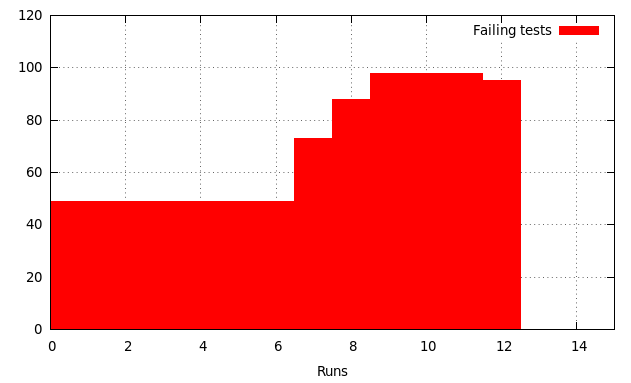
You see the number of failures increasing initially, since fixing an ImportError lets nose try to run more and more tests, and some of those, unsurprisingly, fail.
My test run script (run33):
#!/bin/sh
savelog -l -q -c 100 .testoutput
tox -e py33 2>&1 | tee .testoutput
grep -a '^\(ERROR:\|FAIL:\|FAILED\)' .testoutput
less .testoutput
it uses tox, which is awesome, with this trivial tox.ini:
[tox]
envlist = py26,py27

[testenv]
deps = nose
commands = nosetests
And here's the horrible plot script:
#!/usr/bin/python
import glob, re, subprocess
files = glob.glob('.testoutput*')
age = {fn: -1 if fn == '.testoutput' else int(fn.split('.')[-1])
       for fn in files if fn == '.testoutput' or fn.split('.')[-1].isdigit()}
files.sort(key=age.get, reverse=True)
failures = {}
rx = re.compile(r'^FAILED \(errors=(\d+), failures=(\d+)\)$', re.MULTILINE)
max_errors = 120
with open('.plot', 'w') as p:
    for fn in files:
        with open(fn) as f:
            for line in f:
                m = rx.match(line)
                if m:
                    errors, failures = [int(g) for g in m.groups()]
                    p.write('%d %d %d\n' % (errors, failures, errors+failures))
                    max_errors = max(max_errors, errors+failures)
p = subprocess.Popen(['gnuplot'], stdin=subprocess.PIPE)
p.stdin.write('set xr [0:%d]\n' % len(files))
p.stdin.write('set yr [0:%d]\n' % max_errors)
p.stdin.write('set style fill solid\n')
p.stdin.write('set xlabel "Runs"\n')
p.stdin.write('plot ".plot" using 3 title "Failing tests" with boxes\n')
p.stdin.flush()
p.wait() # have to ^C it :(
I used gnuplot because I didn't want to muck about with installing matplotlib in a virtualenv or something. I kind of regret that now, because gnuplot is not very friendly. I should've just apt-get installed python-matplotlib, I think.