Created
September 17, 2019 23:33
-
-
Save mitsuhisaT/6127b2abc01c6bfe91d592c3574cc842 to your computer and use it in GitHub Desktop.
sample running mean temperature used numpy.convolve()
This file contains hidden or bidirectional Unicode text that may be interpreted or compiled differently than what appears below. To review, open the file in an editor that reveals hidden Unicode characters.
Learn more about bidirectional Unicode characters
| #!/usr/bin/env python | |
| """Draw line graph of 118 years August temperature line graph. | |
| Past data of temperature gets from | |
| https://www.data.jma.go.jp/gmd/risk/obsdl/index.php | |
| Sample original data | |
| 2018,8,8,30.3,8,2,35.1,8,2,24.8,8,2 | |
| 2018,8,9,31.2,8,2,37.3,8,2,26.7,8,2 | |
| 2018,8,10,30.5,8,2,35.4,8,2,27.3,8,2 | |
| 2018,8,11,29.8,8,2,34.1,8,2,26.1,8,2 | |
| 2018,8,12,30.4,8,2,34.7,8,2,27.2,8,2 | |
| Replace two times | |
| s/(\d{4}),8,(\d{1})/'$1-08-0$3'/ | |
| s/(\d{4}),8,(\d{2})/'$1-08-$3'/ | |
| Imput data | |
| '2018-08-08',30.3,8,2,35.1,8,2,24.8,8,2 | |
| '2018-08-09',31.2,8,2,37.3,8,2,26.7,8,2 | |
| '2018-08-10',30.5,8,2,35.4,8,2,27.3,8,2 | |
| '2018-08-11',29.8,8,2,34.1,8,2,26.1,8,2 | |
| '2018-08-12',30.4,8,2,34.7,8,2,27.2,8,2 | |
| """ | |
| from matplotlib import pyplot as plt | |
| from matplotlib import dates as mdates | |
| import numpy as np | |
| dt = np.dtype({ | |
| 'names': ['date', 'mean', 'max', 'min'], | |
| 'formats': ['f4', 'f4', 'f4', 'f4'] | |
| }) | |
| datas = np.loadtxt('data/august-temperature.csv', dtype=dt, skiprows=1, | |
| delimiter=',', | |
| converters={0: lambda s: mdates.datestr2num(s.decode())}, | |
| usecols=(0, 1, 4, 7)) | |
| # calculate mean max temperature evey years | |
| BEGIN_YEAR = 1901 | |
| END_YEAR = 2018 | |
| maxdatas = np.amax(datas[0:31].tolist(), axis=0, keepdims=True) | |
| for year in range(BEGIN_YEAR + 1, END_YEAR): | |
| # 0 - 30, 31 - 61, 62 - 92,... | |
| s = (year - BEGIN_YEAR) * 31 | |
| e = s + 31 | |
| maxdatas = np.append(maxdatas, np.amax(datas[s:e].tolist(), axis=0, | |
| keepdims=True), | |
| axis=0) | |
| # Save and read, because I cannot convert labelled ndarray on memory. | |
| np.savetxt('data/max-temperature.csv', maxdatas, | |
| fmt='%5.1f,%2.2f,%2.2f,%2.2f') | |
| maxdatas = np.loadtxt('data/max-temperature.csv', dtype=dt, skiprows=0, | |
| delimiter=',') | |
| # calculate running average | |
| n = 5 | |
| ra_max = np.convolve(maxdatas['max'], np.ones(n)/float(n), 'valid') | |
| ra_mean = np.convolve(maxdatas['mean'], np.ones(n)/float(n), 'valid') | |
| ra_min = np.convolve(maxdatas['min'], np.ones(n)/float(n), 'valid') | |
| # composit to ['date', 'mean', 'max', 'mean'] | |
| shp = (len(ra_max), 1) | |
| rngmean = np.resize(maxdatas['date'][2:115], shp) | |
| rngmean = np.append(rngmean, np.resize(ra_mean, shp), axis=1) | |
| rngmean = np.append(rngmean, np.resize(ra_max, shp), axis=1) | |
| rngmean = np.append(rngmean, np.resize(ra_min, shp), axis=1) | |
| # Save and read, because I cannot convert labelled ndarray on memory. | |
| np.savetxt('data/rngmean-temperature.csv', rngmean, | |
| fmt='%5.1f,%2.2f,%2.2f,%2.2f') | |
| rngmean = np.loadtxt('data/rngmean-temperature.csv', dtype=dt, | |
| skiprows=0, delimiter=',') | |
| datemin = np.datetime64(mdates.num2date(rngmean['date'][0]), 'Y') | |
| datemax = np.datetime64(mdates.num2date(rngmean['date'][-1]), 'Y') | |
| + np.timedelta64(1, 'Y') | |
| fig, ax = plt.subplots() | |
| ax.set_xlim(datemin, datemax) | |
| # format the cords message box | |
| ax.format_xdata = mdates.DateFormatter('%Y') | |
| ax.format_ydata = lambda x: '$%2.1f' % x # format the temperature. | |
| ax.grid(True) | |
| ax.plot('date', 'max', data=rngmean, label='max') | |
| ax.plot('date', 'mean', data=rngmean, label='mean') | |
| ax.plot('date', 'min', data=rngmean, label='min') | |
| ax.legend() | |
| # rotates and right aligns the x labels, and moves the bottom of the | |
| # axes up to make room for them | |
| fig.autofmt_xdate() | |
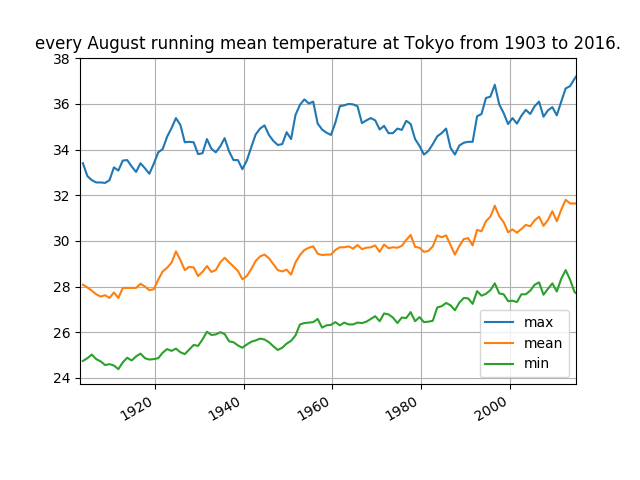
| plt.title('every August running mean temperature at Tokyo from 1903 to 2016.') | |
| plt.show() |
Author
Sign up for free
to join this conversation on GitHub.
Already have an account?
Sign in to comment
used from 1901 to 2018 mean, max, min temperature datas.