Last active
January 28, 2025 07:07
-
-
Save mraspaud/4d44d6dfe26d9a87732fea0b3b4db690 to your computer and use it in GitHub Desktop.
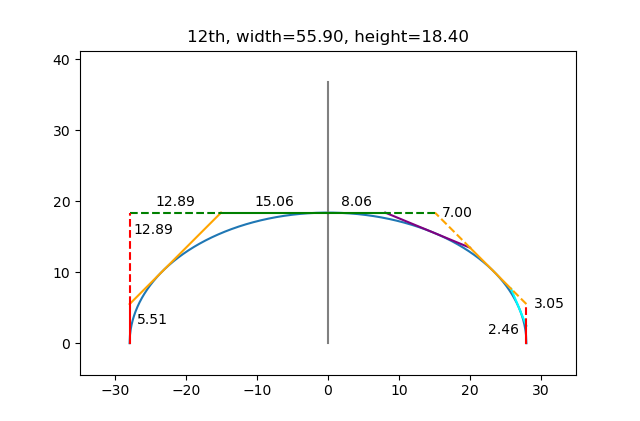
Quick and dirty python script to compute the facet sizes for shaping a guitar neck
This file contains hidden or bidirectional Unicode text that may be interpreted or compiled differently than what appears below. To review, open the file in an editor that reveals hidden Unicode characters.
Learn more about bidirectional Unicode characters
| #!/usr/bin/python | |
| # Copyright (c) 2019. | |
| # | |
| # Author(s): | |
| # Martin Raspaud <[email protected]> | |
| # This program is free software: you can redistribute it and/or modify | |
| # it under the terms of the GNU General Public License as published by | |
| # the Free Software Foundation, either version 3 of the License, or | |
| # (at your option) any later version. | |
| # | |
| # This program is distributed in the hope that it will be useful, | |
| # but WITHOUT ANY WARRANTY; without even the implied warranty of | |
| # MERCHANTABILITY or FITNESS FOR A PARTICULAR PURPOSE. See the GNU | |
| # General Public License for more details. | |
| # | |
| # You should have received a copy of the GNU General Public License | |
| # along with this program. If not, see <http://www.gnu.org/licenses/>. | |
| import numpy as np | |
| import matplotlib.pyplot as plt | |
| def tangent_params(angle, a, b): | |
| slope = np.tan(angle) | |
| intercept = np.sqrt(a ** 2 * slope ** 2 + b ** 2) | |
| return slope, intercept | |
| def tangent(x, angle, a, b): | |
| slope, intercept = tangent_params(angle, a, b) | |
| return slope * x + intercept | |
| def plot_neck(ax2, b, title='Neck'): | |
| # neck shape: oval | |
| a = ax2 / 2 | |
| x = np.linspace(-a, a, 1000) | |
| y = b / a * np.sqrt(a ** 2 - x ** 2) | |
| plt.plot(x, y) | |
| # axis of symmetry | |
| plt.plot([0, 0], [0, b * 2], color='grey') | |
| # first intersection | |
| inter1 = -a, tangent(-a, np.pi / 4, a, b) | |
| # print(inter1) | |
| plt.annotate(('%.2f' % inter1[1]), (-a + 1, inter1[1] / 2)) | |
| plt.annotate(('%.2f' % (b - inter1[1])), (-a + .5, (b + inter1[1]) * 2 / 3), va='center') | |
| # second intersection | |
| slope, intercept = tangent_params(np.pi / 4, a, b) | |
| inter2 = (b - intercept) / slope, b | |
| # print(inter2) | |
| plt.annotate(('%.2f' % abs(inter2[0])), (inter2[0] / 2, b + 1), ha='center') | |
| plt.annotate(('%.2f' % (a - abs(inter2[0]))), ((-a + inter2[0]) / 2, b + 1), ha='center') | |
| # first tangent | |
| x = np.array([inter1[0], inter2[0]]) | |
| y = tangent(x, np.pi / 4, a, b) | |
| plt.plot(x, y, color='orange', linestyle='-') | |
| # horizontal line | |
| y = tangent(np.array([-a, inter2[0]]), 0, a, b) | |
| plt.plot(np.array([-a, inter2[0]]), y, 'g--') | |
| y = tangent(np.array([inter2[0], 0]), 0, a, b) | |
| plt.plot(np.array([inter2[0], 0]), y, 'g-') | |
| # vertical line | |
| plt.plot([-a, -a], [0, inter1[1]], 'r-') | |
| plt.plot([-a, -a], [inter1[1], b], 'r--') | |
| # Second part | |
| # first intersection | |
| inter1 = a, tangent(a, -np.pi / 4, a, b) | |
| # second intersection | |
| slope, intercept = tangent_params(-np.pi / 4, a, b) | |
| inter2 = (b - intercept) / slope, b | |
| slope45 = slope | |
| intercept45 = intercept | |
| # third intersection | |
| inter3 = a, tangent(a, -3 * np.pi / 8, a, b) | |
| plt.annotate(('%.2f' % inter3[1]), (a - 1, inter3[1] / 2), ha='right') | |
| # fourth intersection | |
| slope, intercept = tangent_params(-3 * np.pi / 8, a, b) | |
| x_inter = (intercept - intercept45) / (slope45 - slope) | |
| inter4 = x_inter, slope45 * x_inter + intercept45 | |
| plt.plot([inter3[0], inter4[0]], [inter3[1], inter4[1]], color='cyan') | |
| dst = np.linalg.norm(np.array(inter1) - np.array(inter4)) | |
| plt.annotate('%.2f' % dst, (inter1[0] + 1, inter1[1]), ha='left', va='center') | |
| # fifth intersection | |
| slope, intercept = tangent_params(-np.pi / 8, a, b) | |
| x_inter = (intercept - intercept45) / (slope45 - slope) | |
| inter5 = x_inter, slope45 * x_inter + intercept45 | |
| dst = np.linalg.norm(np.array(inter2) - np.array(inter5)) | |
| plt.annotate('%.2f' % dst, (inter2[0] + 1, inter2[1]), ha='left', va='center') | |
| # sixth intersection | |
| inter6 = (b - intercept) / slope, b | |
| plt.plot([inter6[0], inter5[0]], [inter6[1], inter5[1]], color='purple') | |
| plt.annotate(('%.2f' % abs(inter6[0])), (inter6[0] / 2, b + 1), ha='center') | |
| # vertical line | |
| plt.plot([a, a], [0, inter3[1]], 'r-') | |
| plt.plot([a, a], [inter3[1], inter1[1]], 'r--') | |
| # first tangent | |
| x = np.array([inter1[0], inter4[0]]) | |
| y = tangent(x, -np.pi / 4, a, b) | |
| plt.plot(x, y, color='orange', linestyle='--') | |
| x = np.array([inter4[0], inter5[0]]) | |
| y = tangent(x, -np.pi / 4, a, b) | |
| plt.plot(x, y, color='orange', linestyle='-') | |
| x = np.array([inter5[0], inter2[0]]) | |
| y = tangent(x, -np.pi / 4, a, b) | |
| plt.plot(x, y, color='orange', linestyle='--') | |
| # horizontal line | |
| x = np.array([inter2[0], inter6[0]]) | |
| y = tangent(x, 0, a, b) | |
| plt.plot(x, y, 'g--') | |
| x = np.array([inter6[0], 0]) | |
| y = tangent(x, 0, a, b) | |
| plt.plot(x, y, 'g-') | |
| plt.axis('equal') | |
| plt.axis([-a * 1.25, a * 1.25, 0, b * 2]) | |
| plt.title('%s, width=%.2f, height=%.2f'%(title, ax2, b)) | |
| plt.show() | |
| plot_neck(42.2, 14.3, 'Nut') | |
| plot_neck(55.9, 18.4, '12th') |
Sign up for free
to join this conversation on GitHub.
Already have an account?
Sign in to comment
example output: