It’s the next HomeCamp tomorrow. And in a spectacular feat of bad calendaring, I’ve managed to organise the Letter Lounge to take place on the day I’ve been looking forward to for the last few months are coming away from the initial HomeCamp, utterly inspired by what I saw there.
So to make up for not being able to attend, the least I can do is finally get round to writing about the Tealight, a fun, Homecampy little project James Gardner and I built one evening in the Hub recently.
We did it partly to learn about the Arduino platform, and partly to explore how to make something as complex as demand response intelligible to people who don’t think about this for a living, and well here it is, in all it’s janky, low budget hackish glory:
This green orb constantly polls the national power grid to see how it’s keeping up with demand from everyone watching The Apprentice, and subsequently whether your next cuppa will be a particularly carbon intensive one.
If there’s spare capacity on the grid, the tealight will glows green, it’s basically saying:
‘Go ahead! Make some tea! Knock yourself out!’If there isn’t, the colour shifts to red, saying:
“Now’s not the best time for that cuppa, give it a little while.”The main idea here is that you can glance at the globe from across an office or co-working space, to get an idea about whether making that cup of tea is a good idea right now, without having to think too hard about it.
Think of it as national grid load balancing, using people, and hot beverages.
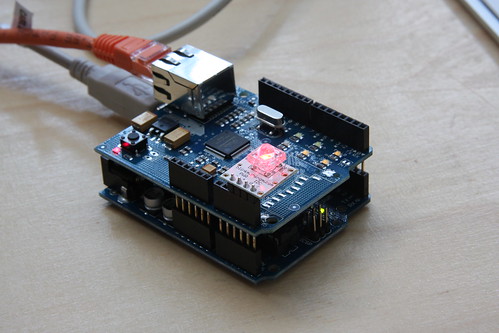
This is thing is almost embarrassingly simple.On the software side, we’re basically polling the api for caniturniton.com a website which scrapes the national grid for power usage data every minute or so, and depending on if the figure returned is higher or lower than the baseline of 50hz, we call a function to tell the BlinkM to change the colour of it’s LED accordingly.
Here’s the shopping list of hardware we used:
- Arduino Diecimila
- Arduino Ethernet
- Blink-M light
- A lampshade from B & Q
When we take the shade off the lamp, it’s quite a bit easier to see how it all works:
The orange cable is a ethernet cable, and the grey one is the usb power, running off a spare iPod I had lying around.
The code has largely been a messy cut and paste job spliced from number of sources, but mostly from this thread in the arduino forums, and the string parsing code example is from a post by Jeff Tanner here on the daniweb forums.
This isn’t really big enough to be considered a project on github, so I’m just chucking a gist up for now:
<script src="http://gist.github.com/101553.js"></script>You could argue so, yes.
But placing it in a relatively high traffic co-working space, full of people working in totally unrelated fields is a great opportunity to speak to them about the ideas inspiring this little toy, and get lots of interesting feedback, and see how best to communicate on issues related to climate change and how massively energy intensive our life styles are.
A number of reasons:
they provide a recognisable power spike for comparing against national averages, and also for graphing against national load averages too. It makes it easier to see if behaviour is changing.
there’s a pattern to making hot beverages at work, but it’s pretty easy to timeshift it, without getting into emotive issues like calling people utter carbon bastards for flying to Spain on holiday.
it’s a usefully mundane , which makes explaining why changing behaviour here could work to smooth out demand on the national grid, meaning the oldest, dirtiest power stations don’t need to be powered up just so everyone can have a cup of tea at the same time.
because a good pun is its own reword.
This builds on ideas and hacks developed by Nick O'Leary at IBM, Tom Dyson at Torchbox Joe Short from Demand Logic, and presented at the last Homecamp. I really wish I was going, but I have a day of letter writing ahead of me instead for Saturday.
Which after this weekend, will be the subject of another post.
