- windows:
<path to chrome>/chrome.exe --remote-debugging-port=9222 - macOS:
/Applications/Google\ Chrome.app/Contents/MacOS/Google\ Chrome --remote-debugging-port=9222 - linux:
google-chrome --remote-debugging-port=9222
-
Open your ember application, add a launch setting in
.vscode/launch.json, here is an example:{ "version": "0.2.0", "configurations": [ { "type": "chrome", "request": "attach", "name": "Attach to Chrome", "port": 9222, "url": "http://localhost:4200/*", "webRoot": "${workspaceFolder}" } ] } -
Enable inline source maps, open
ember-cli-build.jsfile, add an entry like:babel: { sourceMaps: 'inline' }
-
(Optional) If you're using typescript, you need to enable inline source maps in
tsconfig.jsonas well, make sure these settings are correct:"inlineSourceMap": true, "inlineSources": true,
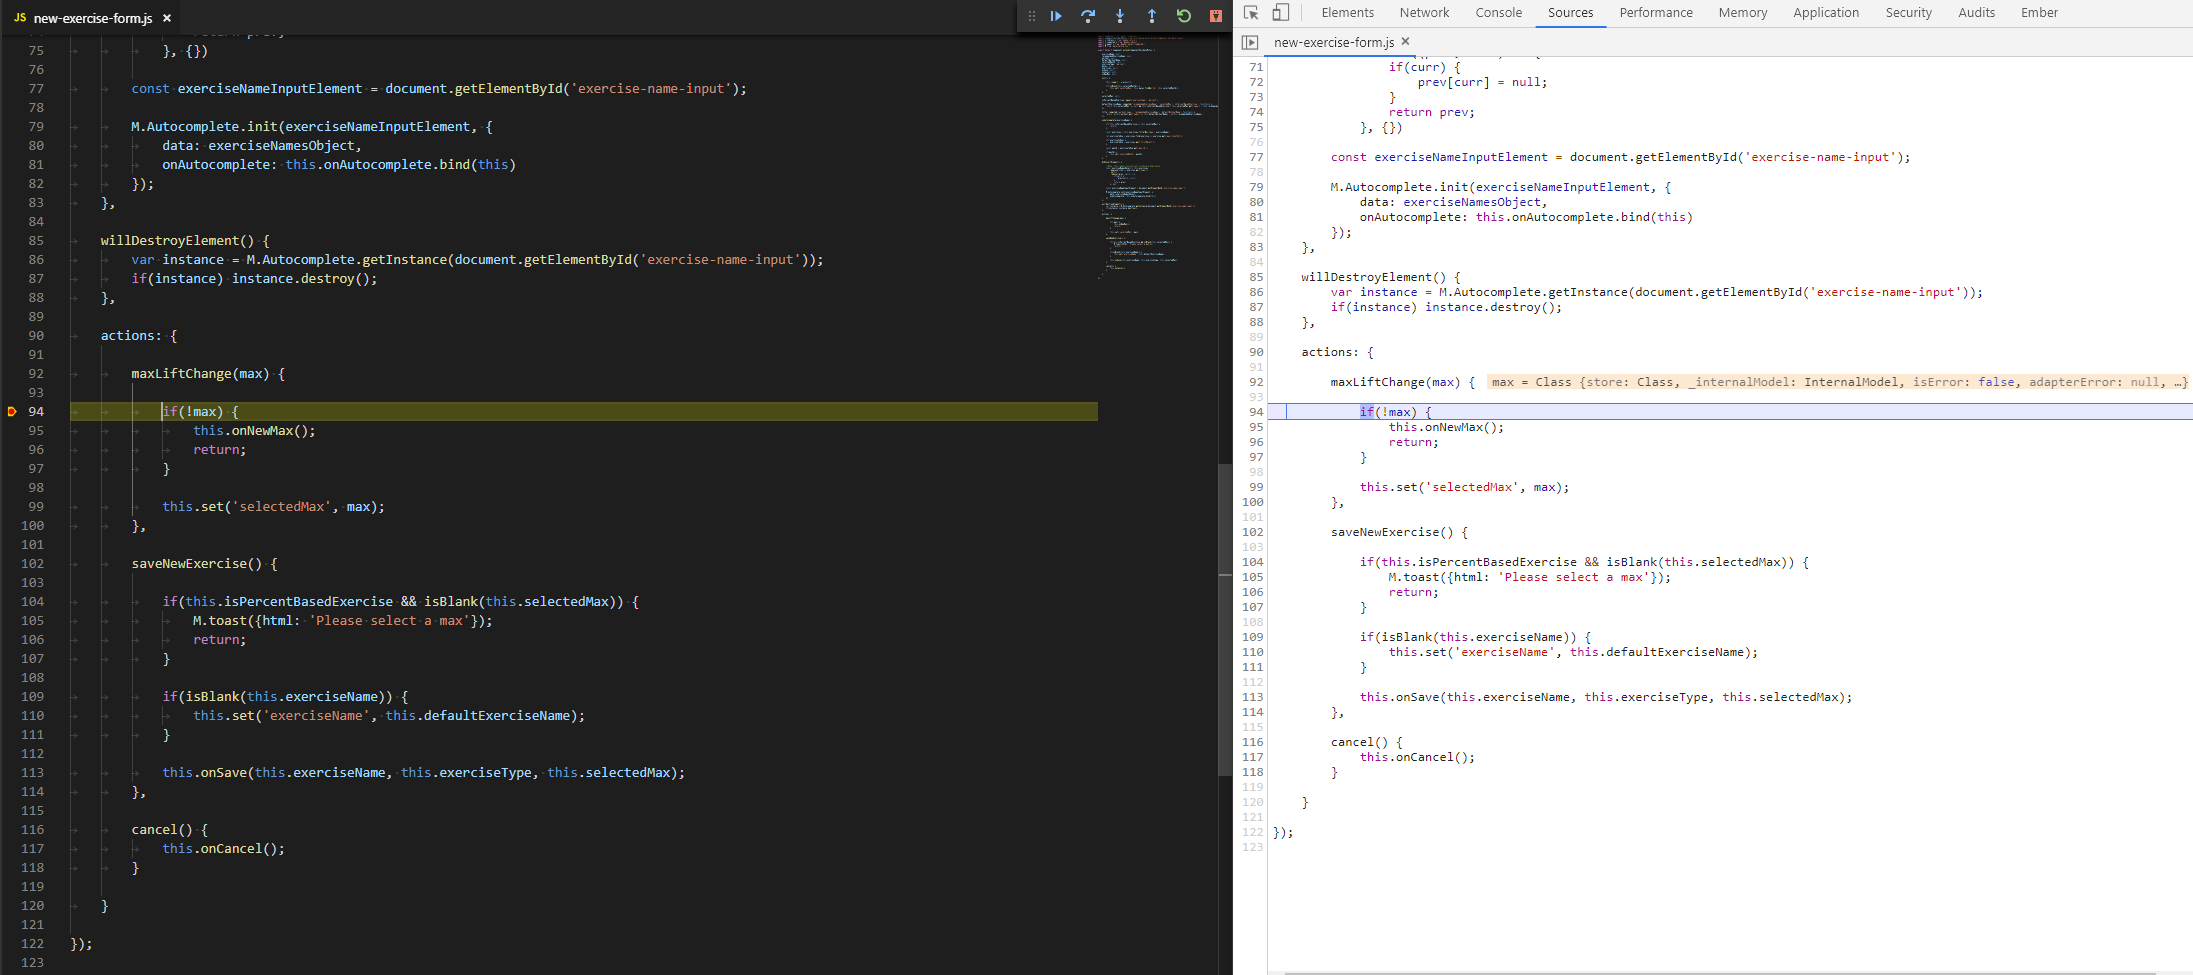
Now, boot up your ember application, open it in the browser, then head back to VS Code and hit f5 key. That's it; you should see something like below:


So I have only been ever to debug ember apps by using "launch" in vscode which is a pain because you have to reopen the browser console everytime and it's a huge waste of time. BUT FINALLY today I got ATTACH working!
I'm on a Windows machine BTW using Windows 10.
My "attach" config looks like:
Then I modified the shortcut to Chrome on my machine to add
"--remote-debugging-port=9222"NOTE: I had to wrap this in double quotes to get it to work for me...
So the "Target" property for me looks like:
Then in
ember-cli-build.jsadd:That looks like:
All this and my breakpoints in vscode hit the correct source:

👊