library(tidyverse)

mock_data <- tribble(
    ~park_name,                  ~count_2015,
    "DISNEY_ANIMAL_KINGDOM",        10262808.79,
    "DISNEY_CALIFORNIA_ADVENTURE", 7859777.858,
       "DISNEY_HOLLYWOOD_STUDIOS", 10161975.17,
                     "DISNEYLAND", 15850608.32,
               "DISNEYLAND_PARIS",  11303153.4,
                          "EPCOT", 11048540.24,
                    "EUROPA_PARK", 4600339.552,
                       "EVERLAND", 7108378.079,
           "HONG_KONG_DISNEYLAND", 6508497.992,
           "ISLANDS_OF_ADVENTURE", 7419398.232,
                  "MAGIC_KINGDOM", 17124831.22,
             "NAGASHIMA_SPA_LAND", 5305896.091,
                     "OCEAN_PARK", 6860359.451,
                    "SEAWORLD_FL", 5440392.711,
                 "TIVOLI_GARDENS", 4249590.638,
               "TOKYO_DISNEY_SEA", 13529866.78,
               "TOKYO_DISNEYLAND", 15279509.39,
           "UNIVERSAL_STUDIOS_FL", 7079618.369,
    "UNIVERSAL_STUDIOS_HOLLYWOOD", 5956300.006,
        "UNIVERSAL_STUDIOS_JAPAN", 9611463.005
    )

library(ggalt)

# geom_dumbbell idea
mock_data %>%
    # add some pseudo predictions
    mutate(count_2016 = (count_2015 + 1000000)) %>%
ggplot(aes(x = count_2015,
           xend = count_2016,
           y = reorder(park_name, count_2016))) +
    geom_dumbbell(point.colour.l = "salmon",
                  point.colour.r = "steelblue")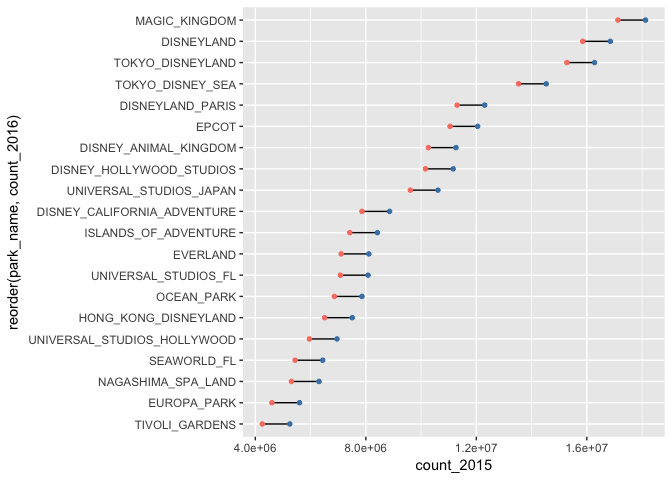
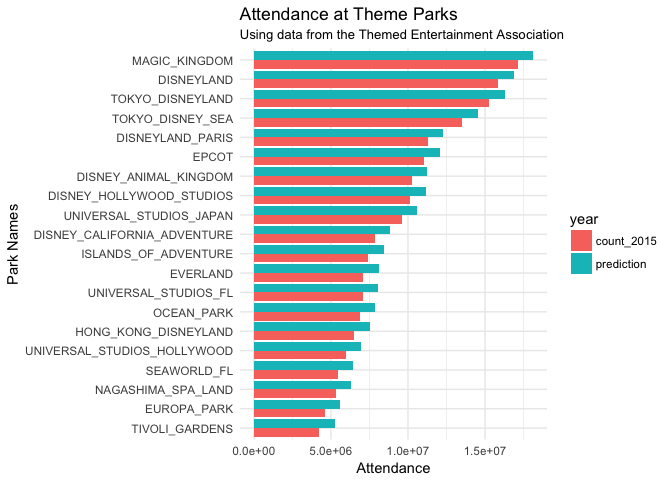
# geom_bar reworking
mock_data %>%
    # add some pseudo predictions
    mutate(prediction = (count_2015 + 1000000)) %>%
    gather(key = "year",
           value = "value",
           -park_name) %>%
    ggplot(aes(x = reorder(park_name, value),
               y = value,
               fill = year)) +
    geom_col(position = "dodge") +
    coord_flip() +
    labs(x = "Park Names",
         y = "Attendance",
         title = "Attendance at Theme Parks",
         subtitle = "Using data from the Themed Entertainment Association") +
    theme_minimal()