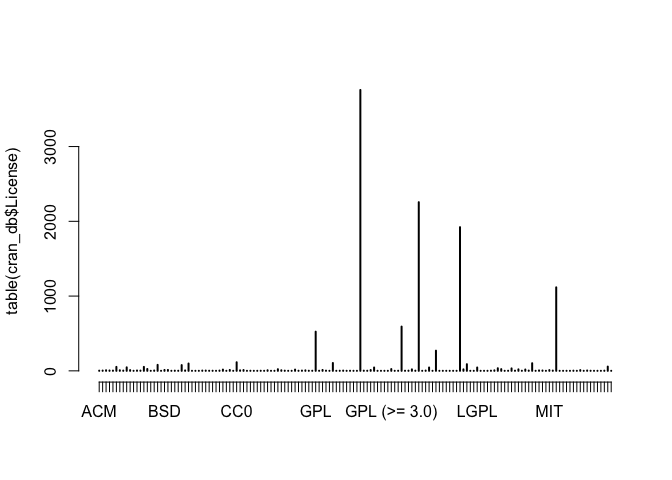
cran_db <- tools::CRAN_package_db()

plot(table(cran_db$License))
cran_db_t <- tibble::tibble(license = cran_db$License)

library(dplyr)
#>
#> Attaching package: 'dplyr'
#> The following objects are masked from 'package:stats':
#>
#>     filter, lag
#> The following objects are masked from 'package:base':
#>
#>     intersect, setdiff, setequal, union

cran_db_t %>%
  group_by(license) %>%
  dplyr::count() %>%
  arrange(-n) %>%
  ungroup() %>%
  mutate(pct = n / n())
#> # A tibble: 150 x 3
#>               license     n        pct
#>                 <chr> <int>      <dbl>
#>  1         GPL (>= 2)  3757 25.0466667
#>  2              GPL-2  2256 15.0400000
#>  3              GPL-3  1922 12.8133333
#>  4 MIT + file LICENSE  1117  7.4466667
#>  5         GPL (>= 3)   592  3.9466667
#>  6                GPL   524  3.4933333
#>  7      GPL-2 | GPL-3   270  1.8000000
#>  8                CC0   115  0.7666667
#>  9       GPL (>= 2.0)   105  0.7000000
#> 10             LGPL-3   102  0.6800000
#> # ... with 140 more rows
