Created
February 8, 2021 02:24
-
-
Save nomissbowling/22b35876ac671b724693f960dc2f5ea1 to your computer and use it in GitHub Desktop.
_test_pin_angle_.py
This file contains hidden or bidirectional Unicode text that may be interpreted or compiled differently than what appears below. To review, open the file in an editor that reveals hidden Unicode characters.
Learn more about bidirectional Unicode characters
| #!/usr/local/bin/python | |
| # -*- coding: utf-8 -*- | |
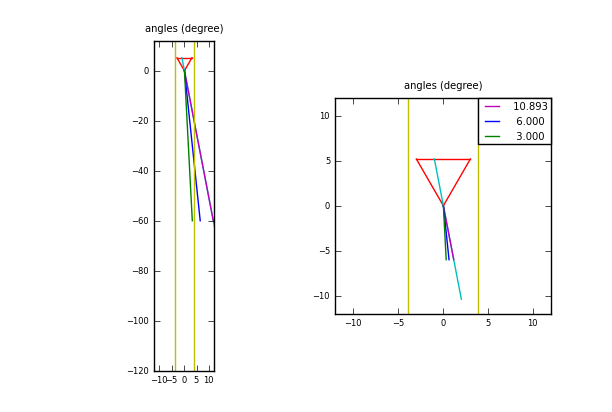
| '''_test_pin_angle_ | |
| pin 8->1 line = sqrt(3)/9 = 0.19245... = tan(0.1901256...) = 10.893... (degree) | |
| tan(10.893 deg) = 0.1924... | |
| tan(6 deg) = 0.1051... | |
| tan(3 deg) = 0.0524... | |
| ''' | |
| import sys, os | |
| import numpy as np | |
| from matplotlib import pyplot as plt | |
| def draw_triangle(axes, r, c): | |
| d = 1 if c else 10 | |
| ax = axes[r][c] | |
| ax.set_aspect('equal') | |
| s = 6 | |
| r = s / 2 | |
| h = r * np.sqrt(3) | |
| pl = (-r, h) | |
| pr = (r, h) | |
| pt = (0, 0) | |
| ax.plot((pl[0], pr[0]), (pl[1], pr[1]), 'r') | |
| ax.plot((pt[0], pr[0]), (pt[1], pr[1]), 'r') | |
| ax.plot((pl[0], pt[0]), (pl[1], pt[1]), 'r') | |
| m = lambda l, r, n: l[n] + (r[n] - l[n]) / 3.0 | |
| n = 2 * d | |
| ax.plot((m(pl, pr, 0), pt[0]), (m(pl, pr, 1), pt[1]), 'c') | |
| ax.plot((-n * m(pl, pr, 0), pt[0]), (-n * m(pl, pr, 1), pt[1]), 'c') | |
| t = lambda a: np.tan(a * np.pi / 180) | |
| u = s * d | |
| for i, a in enumerate(((10.893, 'm'), (6.0, 'b'), (3.0, 'g'))): | |
| ax.plot((pt[0] + u * t(a[0]), pt[0]), (pt[1] - u, pt[1]), a[1], label='%7.3f' % a[0]) | |
| v = 2 * s | |
| w = r * 1.3 | |
| ax.plot((w, w), (-v * d, v), 'y') | |
| ax.plot((-w, -w), (-v * d, v), 'y') | |
| ax.set_xlim((-v, v)) | |
| ax.set_ylim((-v * d, v)) | |
| if c: | |
| ax.legend(bbox_to_anchor=(1, 1), loc='upper right', borderaxespad=0) # , fontsize=6) | |
| ax.set_title('angles (degree)') | |
| def test_pin_angle(): | |
| plt.rcParams['font.size'] = 6 # change all text | |
| plt.rcParams['font.family'] = 'sans-serif' | |
| # plt.rc('legend', fontsize=6) # ok (single property) | |
| fig = plt.figure(figsize=(6, 4), dpi=96) | |
| ROWS, COLS = 1, 2 | |
| axes = [[fig.add_subplot(ROWS * 100 + COLS * (10 + r) + 1 + c) for c in range(COLS)] for r in range(ROWS)] | |
| for r, axr in enumerate(axes): | |
| for c, axc in enumerate(axes[r]): | |
| draw_triangle(axes, r, c) | |
| plt.show() | |
| if __name__ == '__main__': | |
| test_pin_angle() |
Author
nomissbowling
commented
Feb 8, 2021
Sign up for free
to join this conversation on GitHub.
Already have an account?
Sign in to comment