Created
February 8, 2021 05:19
-
-
Save nomissbowling/54fa6c1337f07391aead69dfd6d69139 to your computer and use it in GitHub Desktop.
_test_meshgrid_contour_.py
This file contains hidden or bidirectional Unicode text that may be interpreted or compiled differently than what appears below. To review, open the file in an editor that reveals hidden Unicode characters.
Learn more about bidirectional Unicode characters
| #!/usr/local/bin/python | |
| # -*- coding: utf-8 -*- | |
| '''_test_meshgrid_contour_ | |
| ''' | |
| import sys, os | |
| import numpy as np | |
| from matplotlib import pyplot as plt | |
| from mpl_toolkits.mplot3d import Axes3D | |
| from matplotlib.colors import hsv_to_rgb | |
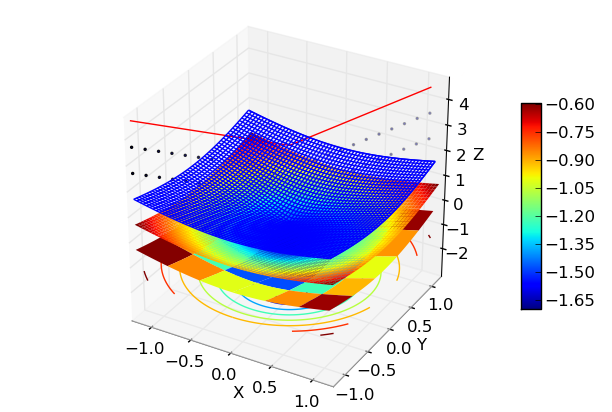
| def hoge(x, y): | |
| return np.sqrt(x*x + y*y) | |
| def hoge_z(X, Y): | |
| Z = np.ndarray(X.shape) | |
| for h in range(len(X)): | |
| for w in range(len(X[0])): | |
| Z[h][w] = hoge(X[h][w], Y[h][w]) | |
| return Z | |
| if __name__ == '__main__': | |
| fig = plt.figure(figsize=(6, 4), dpi=96) | |
| # ax = fig.add_subplot(111, projection='3d') | |
| ax = Axes3D(fig) | |
| ax.set_aspect('equal') | |
| ax.set_xlabel('X') | |
| ax.set_ylabel('Y') | |
| ax.set_zlabel('Z') | |
| x = np.arange(-1.2, 1.2, 0.1) | |
| y = np.arange(-1.2, 1.2, 0.1) | |
| ax.plot(x, y, hoge(x, y) + 3, 'r') # must be shape dimension x == y | |
| ax.scatter(x, y, hoge(x, y) + 2, 'rx') # must be shape dimension x == y | |
| ax.scatter3D(x, y, hoge(x, y) + 1, 'ro') # must be shape dimension x == y | |
| x = np.arange(-1.2, 1.2, 0.04) | |
| y = np.arange(-1.2, 1.2, 0.05) | |
| X, Y = np.meshgrid(x, y) | |
| Z = hoge_z(X, Y) | |
| wire = ax.plot_wireframe(X, Y, Z, linewidth=1) | |
| cont = ax.contour(X, Y, Z - 3, offset=0) | |
| surf = ax.plot_surface(X, Y, Z - 2, cmap=plt.cm.get_cmap(), linewidth=0) | |
| fig.colorbar(surf, shrink=0.5, aspect=10) | |
| x = np.arange(-1.2, 1.2, 0.004) | |
| y = np.arange(-1.2, 1.2, 0.005) | |
| X, Y = np.meshgrid(x, y) | |
| Z = hoge_z(X, Y) | |
| surf = ax.plot_surface(X, Y, Z - 1, cmap=plt.cm.get_cmap(), linewidth=0) | |
| plt.show() |
Author
nomissbowling
commented
Feb 8, 2021
Sign up for free
to join this conversation on GitHub.
Already have an account?
Sign in to comment