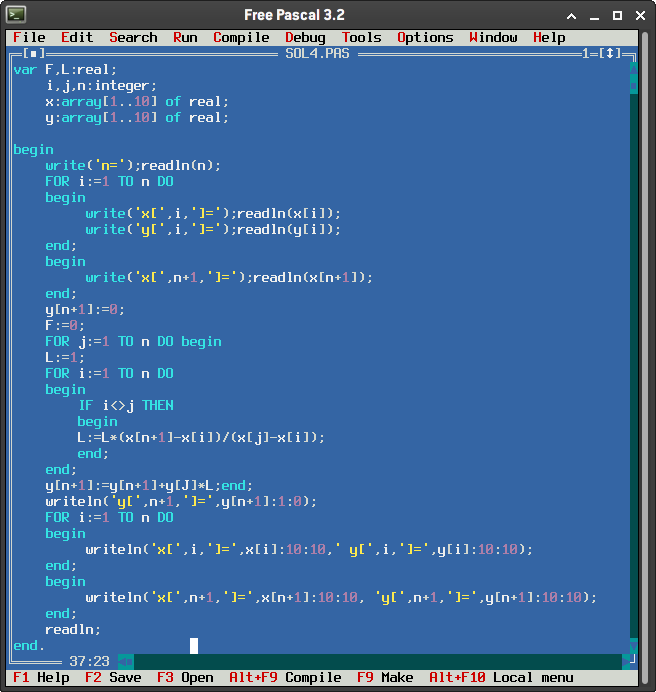
var F,L:real;
	i,j,n: integer;
	x:array[1..101] of real;
	y:array[1..101] of real;

begin
	write('n=');readln(n);
	FOR i:=1 TO n DO
	begin
		write('x[',i,']=');readln(x[i]);
		write('y[',i,']=');readln(y[i]);
	end;
	begin
		write('x[',n+1,']=');readln(x[n+1]);
	end;
	y[n+1]:=0;
	F:=0;
	FOR j:=1 TO n DO begin
	L:=1;
	FOR i:=1 TO n DO
	begin
		IF i<>j THEN
		begin
		L:=L*(x[n+1]-x[i])/(x[j]-x[i]);
		end;
	end;
	y[n+1]:=y[n+1]+y[j]*L;end;
	writeln('y[',n+1,']=',y[n+1]:1:0);
	FOR i:=1 TO n DO
	begin
		writeln('x[',i,']=',x[i]:10:10,' y[',i,']=',y[i]:10:10);
	end;
	begin
		writeln('x[' ,n+1,']=',x[n+1]:10:10, ' y[' ,n+1,']=',y[n+1]:10:10);
	end;
	readln;
end.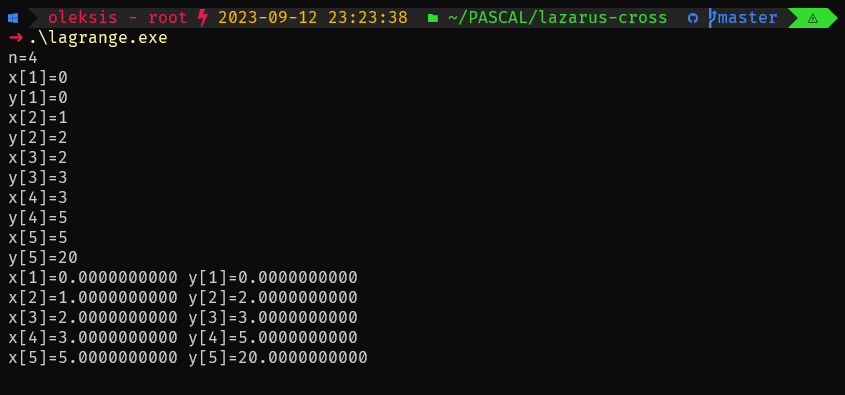
import matplotlib.pyplot as plt
import numpy as np
# Function to perform Lagrange interpolation
def lagrange_interpolation(x, y, n, x_new):
result = 0.0
for j in range(n):
L = 1.0
for i in range(n):
if i != j:
L *= (x_new - x[i]) / (x[j] - x[i])
result += y[j] * L
return result
# Input the number of points
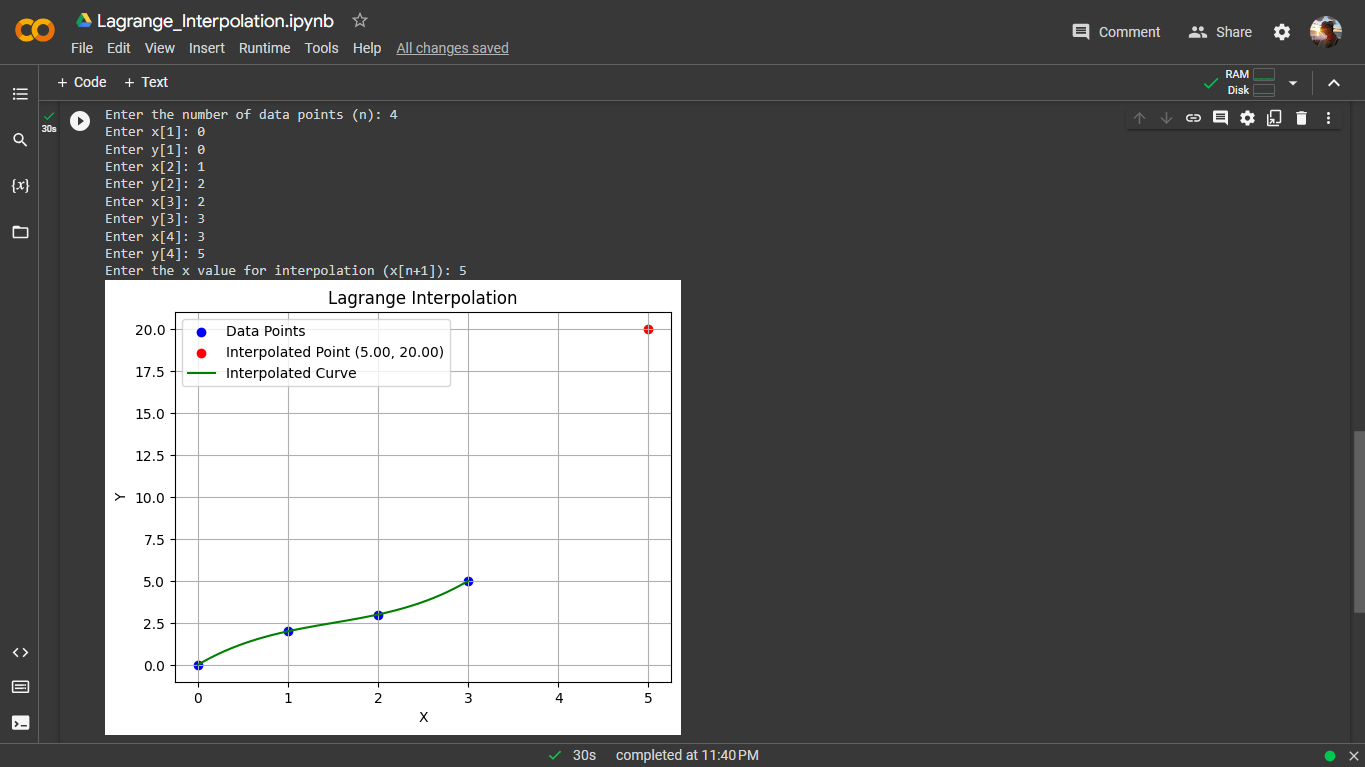
n = int(input("Enter the number of data points (n): "))
# Initialize lists to store x and y values
x_values = []
y_values = []
# Input the x and y values for the data points
for i in range(1, n + 1):
x_i = float(input(f"Enter x[{i}]: "))
y_i = float(input(f"Enter y[{i}]: "))
x_values.append(x_i)
y_values.append(y_i)
# Input the x value for interpolation
x_new = float(input("Enter the x value for interpolation (x[n+1]): "))
# Perform Lagrange interpolation
result = lagrange_interpolation(x_values, y_values, n, x_new)
# Plot the original data points
plt.scatter(x_values, y_values, label='Data Points', color='blue')
# Plot the interpolated point
plt.scatter(x_new, result, label=f'Interpolated Point ({x_new:.2f}, {result:.2f})', color='red')
# Create a smooth curve for the interpolated function
x_smooth = np.linspace(min(x_values), max(x_values), 400)
y_smooth = [lagrange_interpolation(x_values, y_values, n, x) for x in x_smooth]
plt.plot(x_smooth, y_smooth, label='Interpolated Curve', color='green')
# Set labels and legend
plt.xlabel('X')
plt.ylabel('Y')
plt.legend()
# Show the plot
plt.grid(True)
plt.title('Lagrange Interpolation')
plt.show()