I've also posted this as a Github Gist (on which I personally find it easier to read long-form text), so please check it out there as well if you'd like!
If you follow other leagues apart from the Premier League, I'm sure you've wondered what it would be like to play a Fantasy Premier League-esque game for other leagues. Last year, I made a post about this topic, and this post is an update that includes data from the 2019-20 season. You can use this spreadsheet as a way to "scout" new signings from other leagues - for example, Timo Werner would have probably been a €9.5 FWD and scored ~235 points for RB Leipzig last season if he was in FPL. This could also be used to scout players for UCL Fantasy.
The spreadsheet linked above contains estimates of FPL-style fantasy points for every player who started at least one match in at least one season of at least one of the top 5 leagues from the 2014-15 season to the 2019-20 season (14,760 players in total). Calculation of points follows the FPL scheme, as detailed in the "Scoring" section of FPL's rules, with a few exceptions detailed below.
I gathered match-by-match data for all top-5-league matches in Understat's database from 2014-14 to 2019-20. I used this database to calculate the number of points each player would have earned using FPL point-scoring rules.
In the spreadsheet, you may have noticed the columns Start Cost, End Cost, and ΔCost (Cols. O, P, and Q). Start Cost and End Cost are predicted starting and ending costs based on historical FPL cost data. ΔCost is the difference between ending and starting costs.
If you're interested in the method I used to calculate each player's starting and ending costs, please refer to my previous post. The gist of it is that I trained some neural networks on historical FPL price data (gathered from Vaastav's fantastic FPL data repo) to calculate these costs based on a player's stats. I followed the same procedure as I did previously, but this time I had the prices from the upcoming season as additional training data so the neural nets are a bit more accurate this time.
What do you think? I encourage you to have a look for yourself. As far as I'm aware, predicting prices like this hasn't been done before, so I'd be delighted to hear your thoughts on the accuracy of my methods!
The biggest change in my method from last time to this time is that I included a crude estimate of bonus points. There were a few dimensions (e.g., shots missed, tackles, recoveries, etc.) that were missing in my data that prevented me from implementing FPL's bonus system exactly, so I devised a system that calculates raw bonus values for each player in each match they played, similar to FPL's bonus points but with a few adjustments. Here's how my BPS scheme works:
- The ranking for bonus points works the same as in FPL's rules.
- 60+ mins = 6 BPS, 1-59 mins = 3 BPS
- Goals are worth 18 BPS for FWDs, 16 BPS for MIDs, and 14 BPS for DEFs and GKs.
- Assists are worth 9 BPS for FWDs and MIDs but 12 BPS for DEFs and MIDs.
- Clean sheets are worth 15 BPS for GKs, but only 12 BPS for DEFs.
- Since saves are not taken into account, this was intended to reproduce GKs being more likely to receive 2-3 bonus in 0-0 draws and 1-0 wins, which is a pretty common occurrence in FPL.
- Red cards = -9 BPS, Yellow Cards = -3 BPS, Own Goal = -6 BPS, Key Pass = 1 BPS (same as FPL).
- Players also earn BPS based on their xG-Buildup, which is the sum of the expected goals produced by possessions in which they played a part. GKs, DEFs, and MIDs earn BPS equal to 10*xG-Buildup and FWDs earn BPS equal to 6*xG-Buildup (both rounded down to the nearest integer).
- Intuitively, this is a measure of how integral they were to creating chances for their team.
- GKs and DEFs earn -3 BPS rather than -1 BPS for every 2 goals they concede.
On the whole, I found my scheme to be quite accurate at reproducing the "real" bonus points a player got. Adding the raw points and bonus points calculated by my scheme has an error of only a handful of points (~2-10) compared to historical data for most cases. GKs are a significant exception because saves and penalty saves are not taken into account, so their actual vs. predicted points can differ by up to ~40 points.
- Goalkeeper Stats. Understat does not supply any defensive stats, so goalkeepers' points are only a function of their goals, assists, minutes played, cards, clean sheets, and bonus points. Saves and penalty saves are not included in the data.
- Penalty Misses/Saves. In the Match Events section of each match in Understat's database, penalty goals/misses are specified, but penalty misses are not included in their player data for each match.
- "FPL Assists". FPL awards assists for winning a penalty or free-kick, and rebounds off the post to a goalscorer, among other occasions.
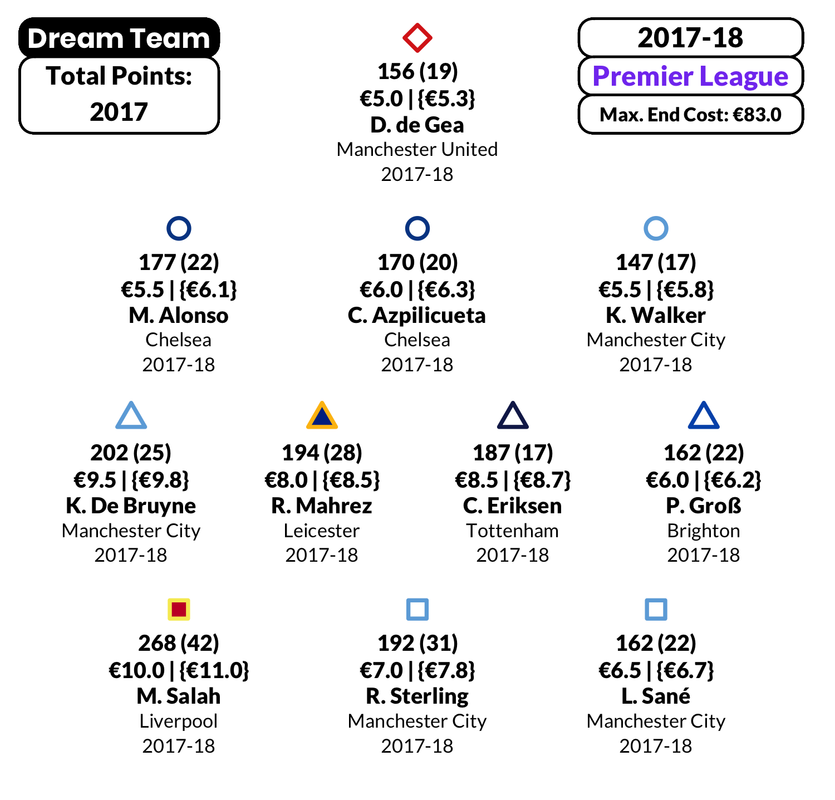
- Player position for each season is based on their position in that season, not the season beforehand. The fantasy position for each player in a season is assigned based on how often they played in each position in the same season. You might have noticed that Mohamed Salah (Liverpool, 2017-18) is listed as a FWD even though he was actually a MID in FPL 17-18; this was because he played more as a FWD in 17-18 than he did as a MID.
- In regards to goals conceded, each player effectively plays the whole match (regardless of whether they were substituted in/out). Since the times of each goal scored are not included in Understat's match player data, each player is penalized for conceding more than 2 goals even if they came on as a substitute after those goals were scored. Case in point: Diego Rico (AFC Bournemouth, 18-19) ended up with a total raw score of -1 because Bournemouth conceded so many goals (19) in the 12 appearances he made, even though he was only on the pitch for a handful of them. This also means that players who were substituted off after the 60th minute of a match with no goals conceded lost their clean sheet if their team conceded a goal afterwards.
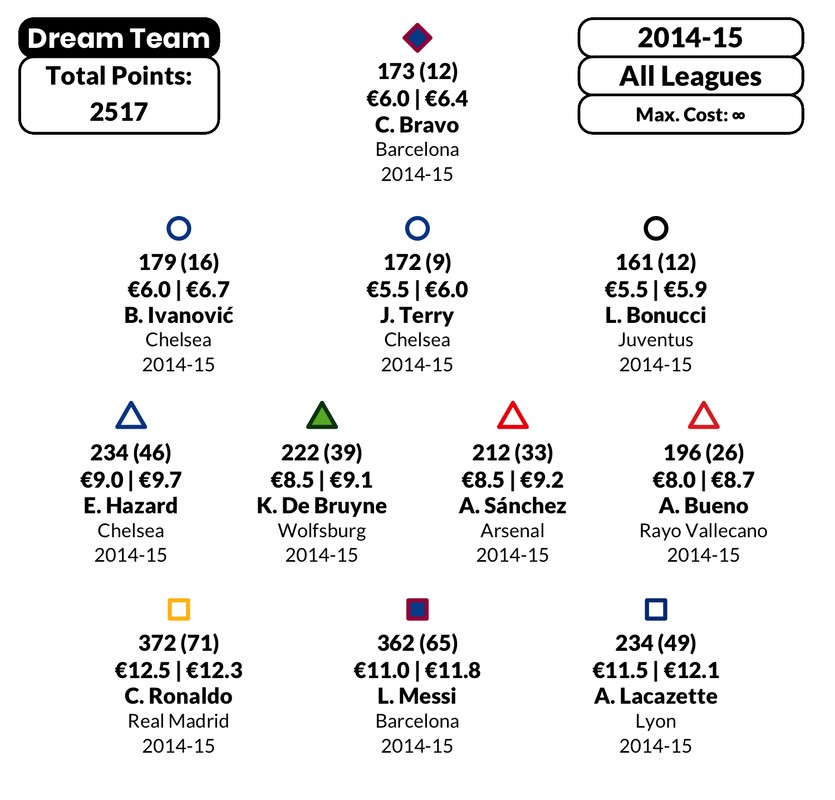
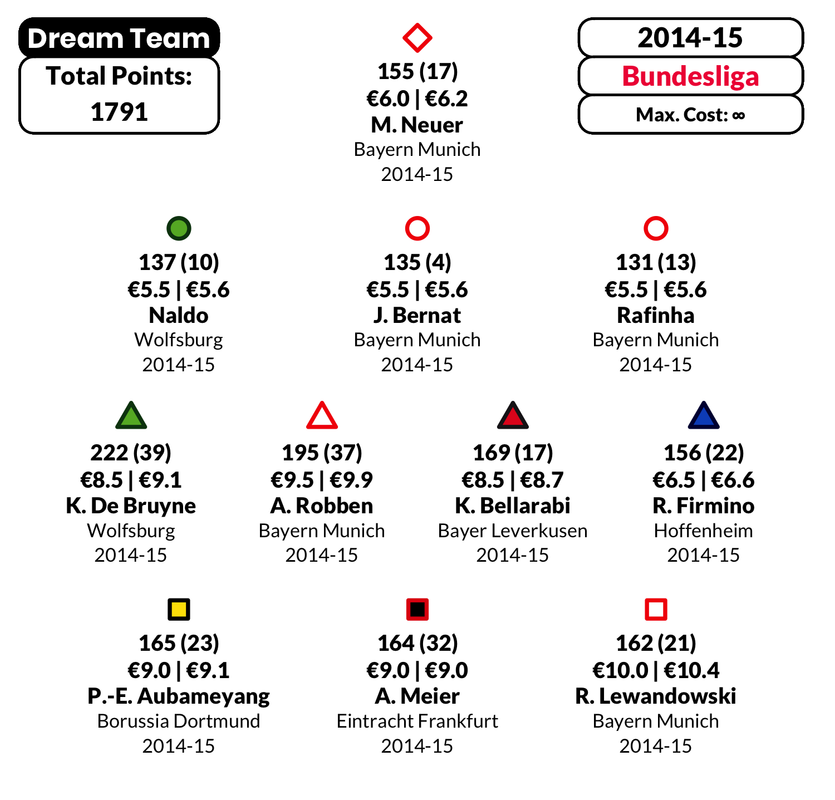
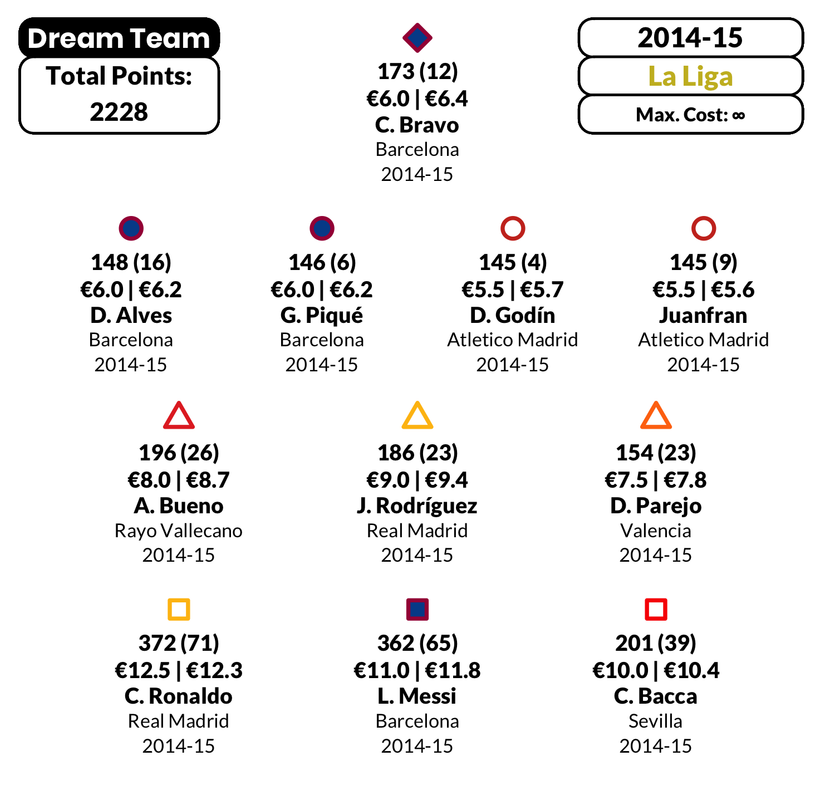
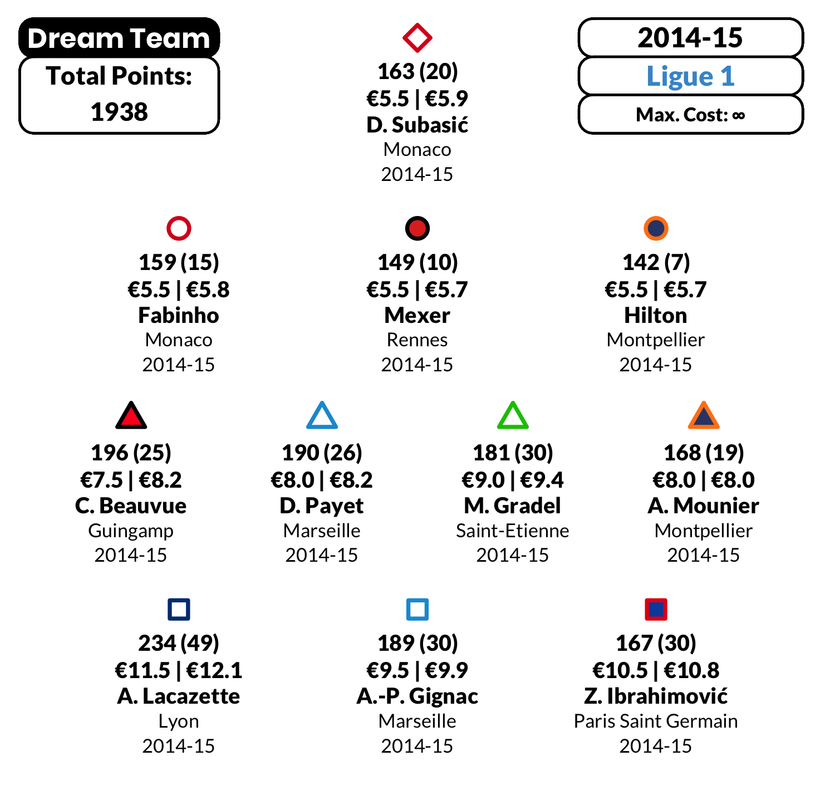
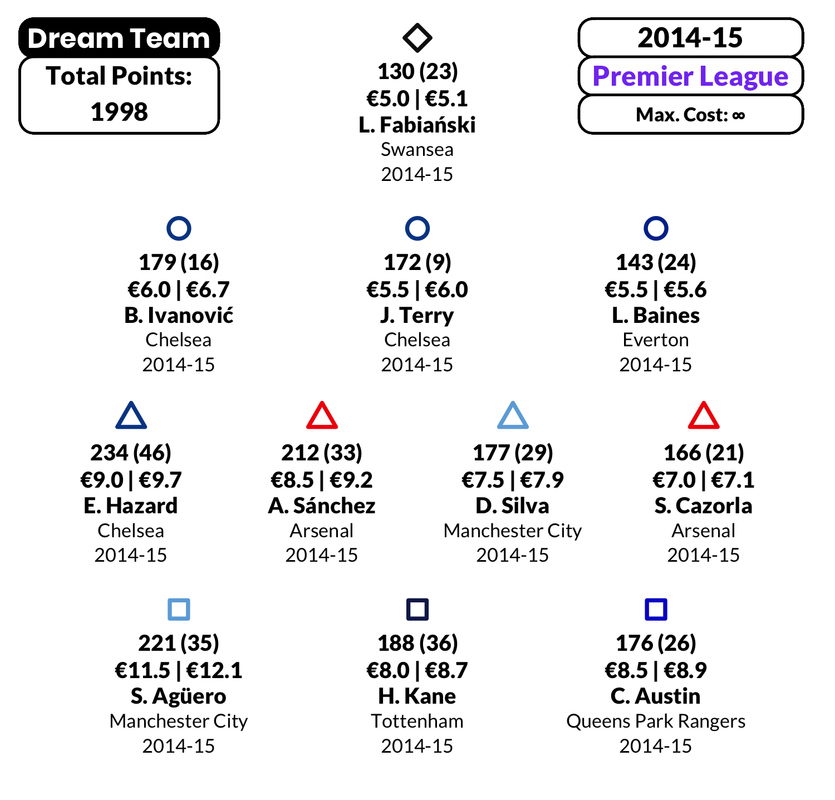
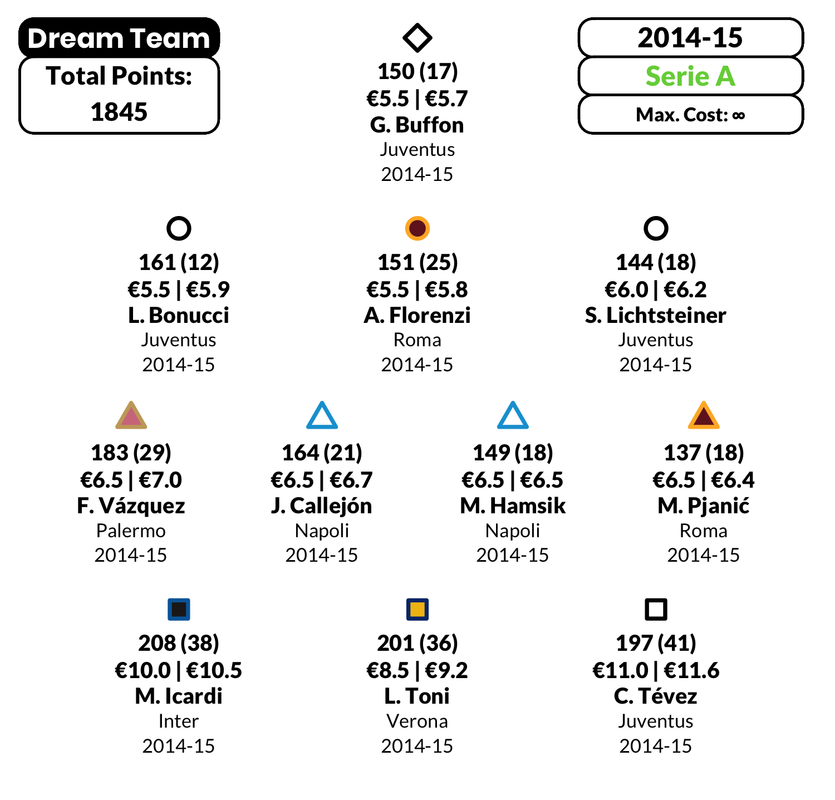
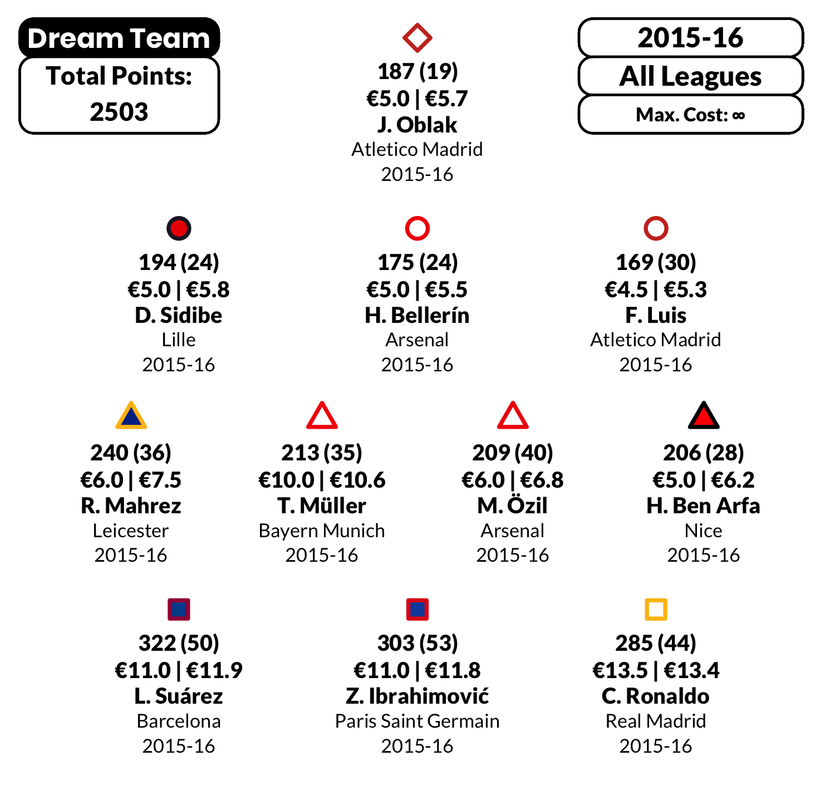
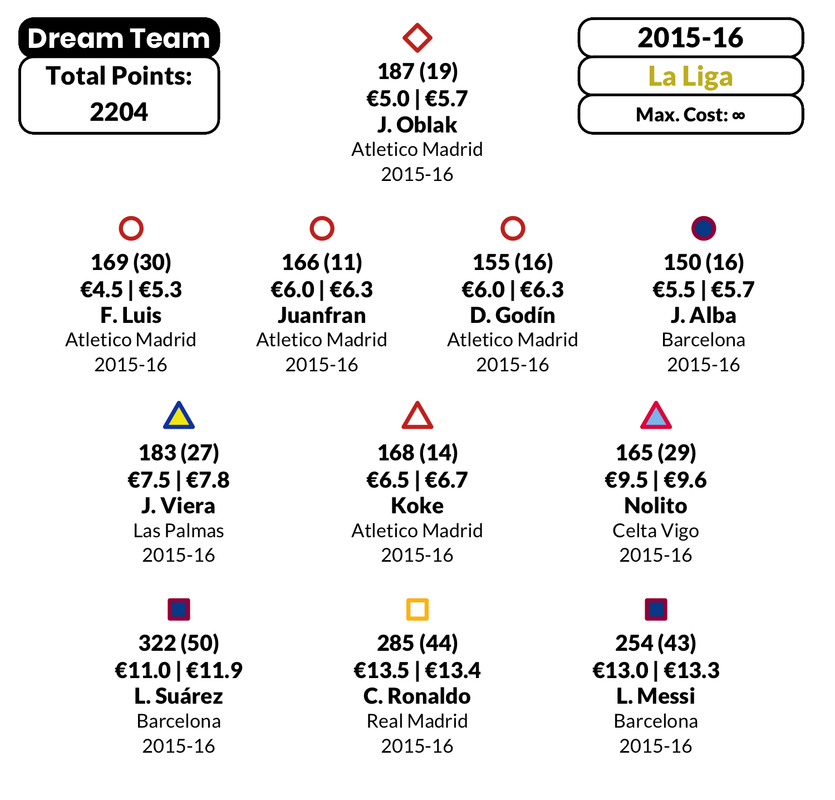
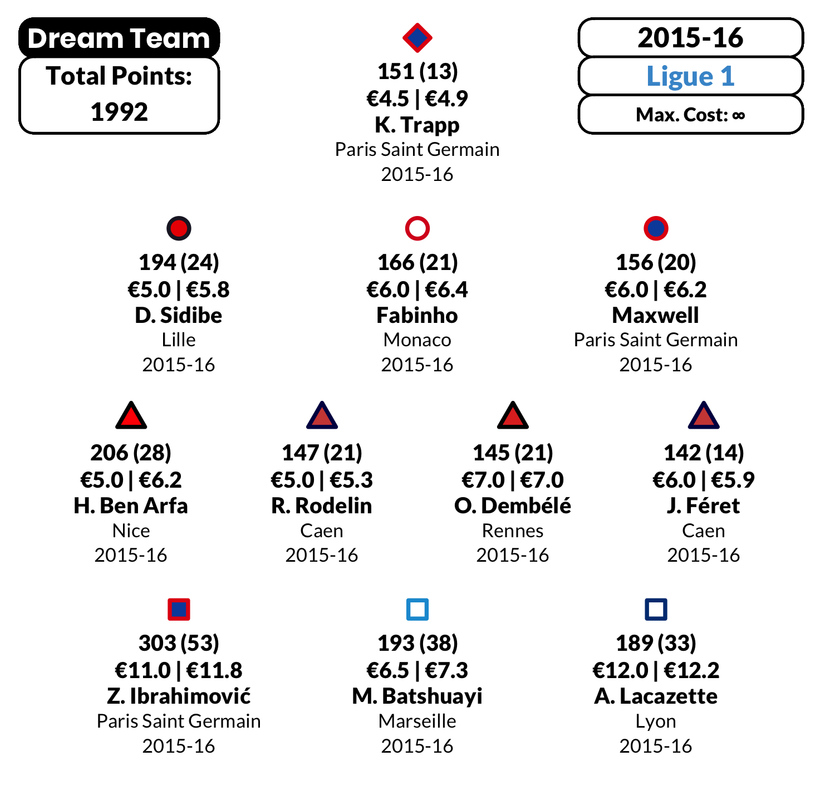
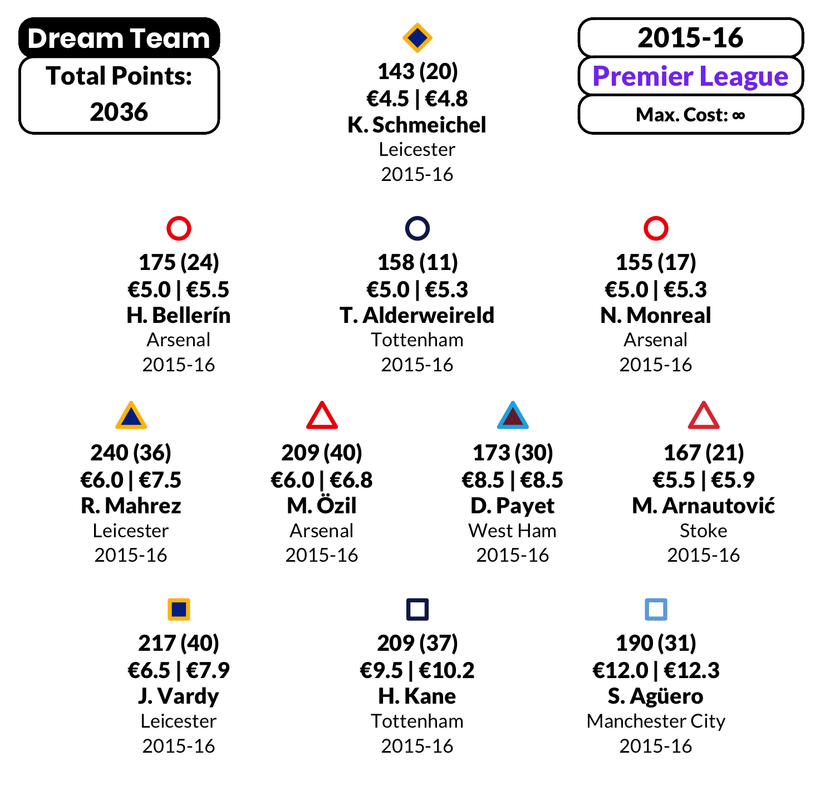
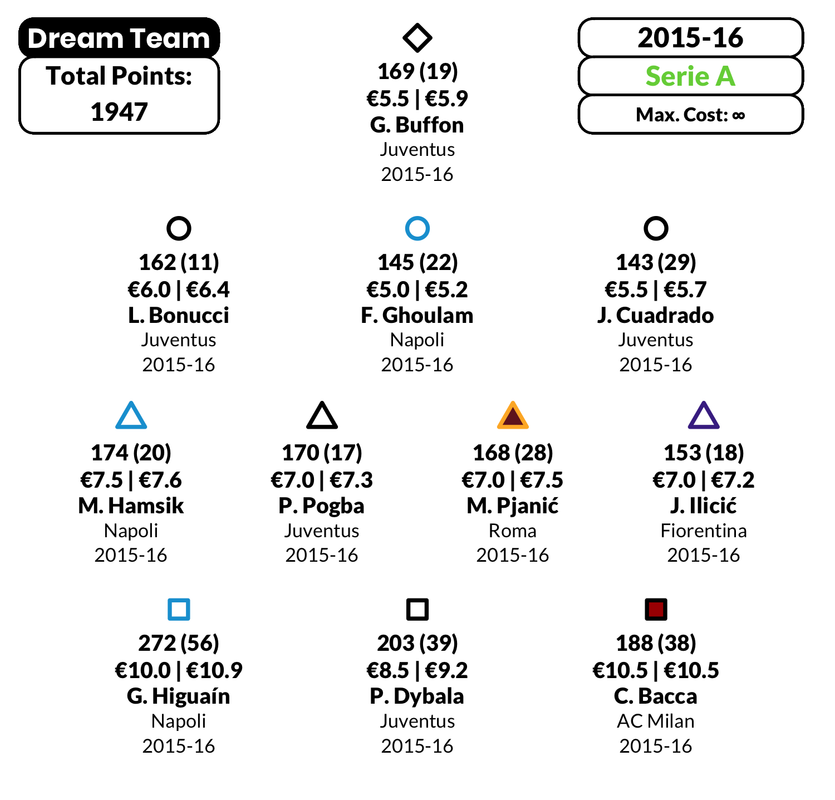
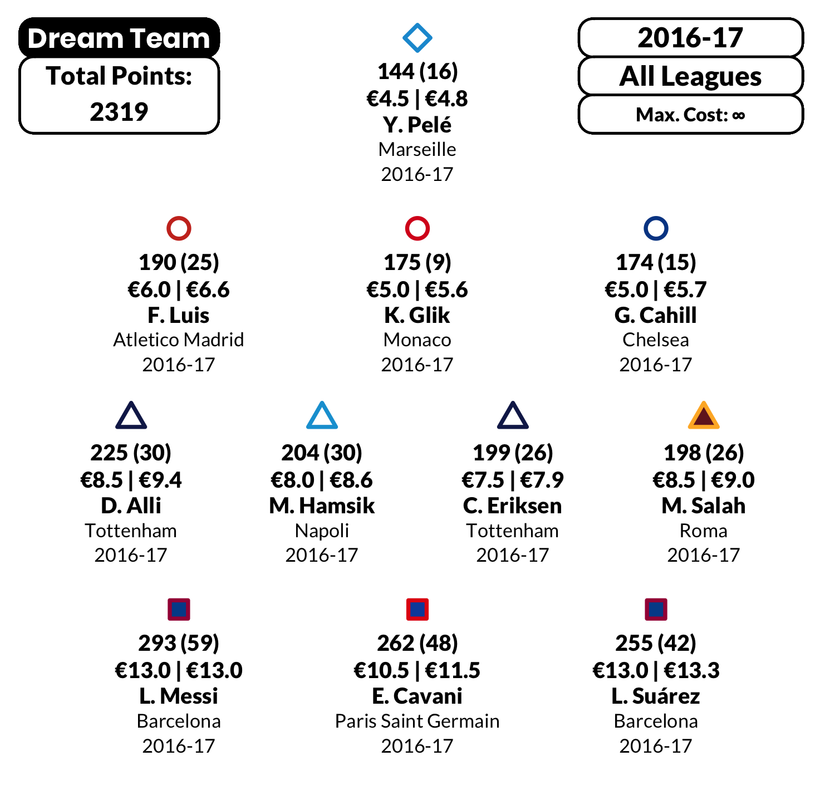
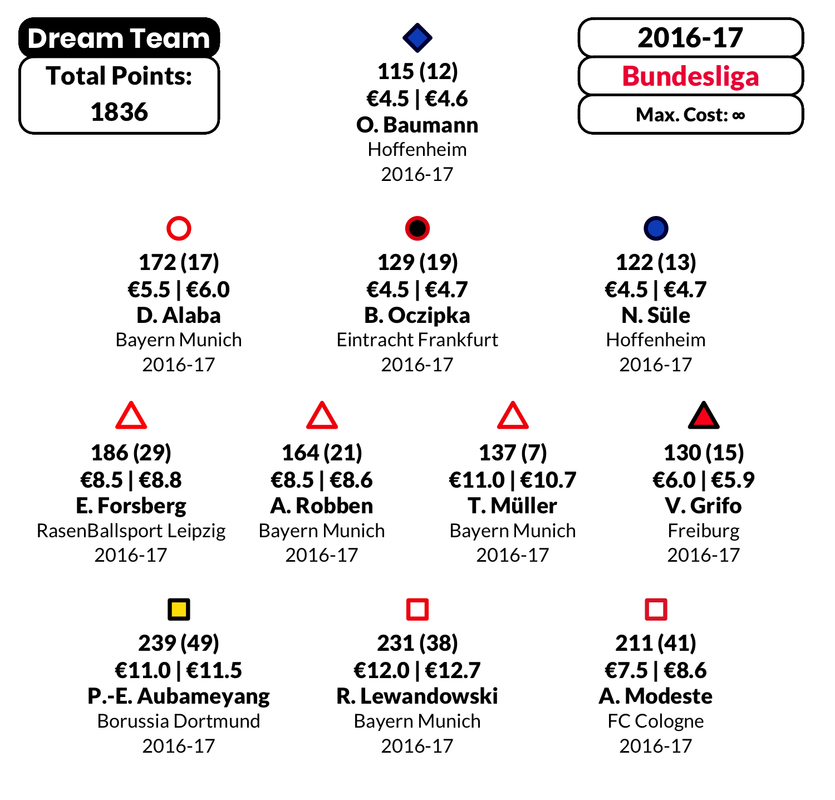
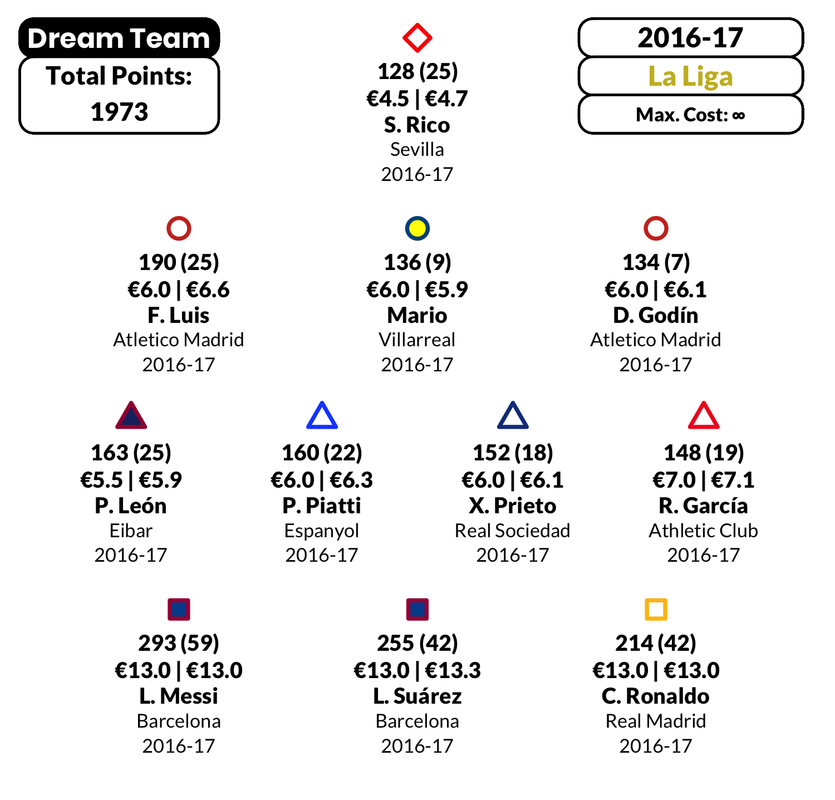
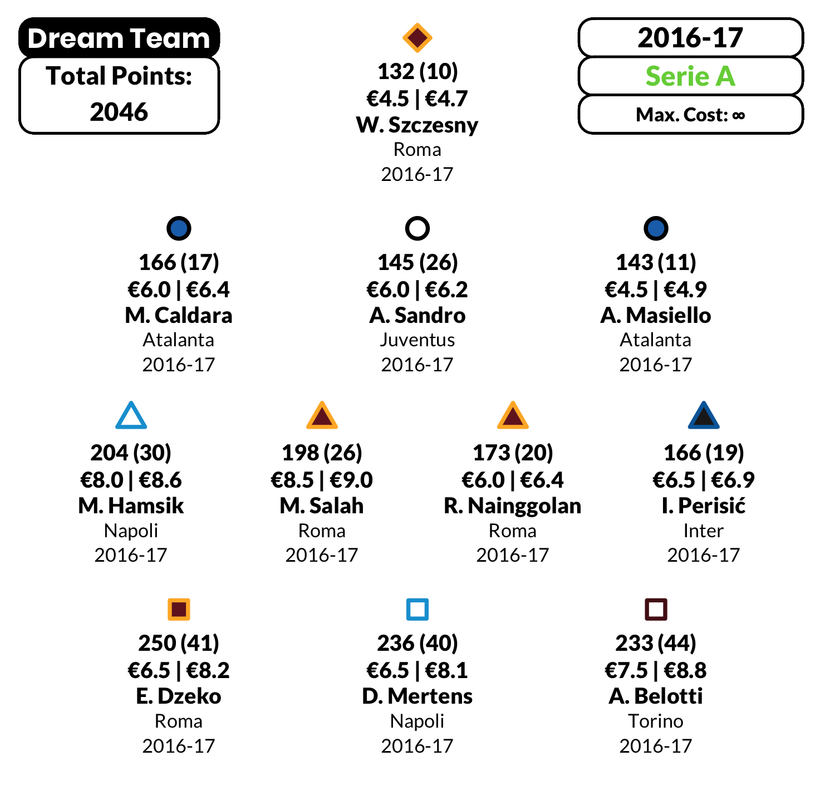
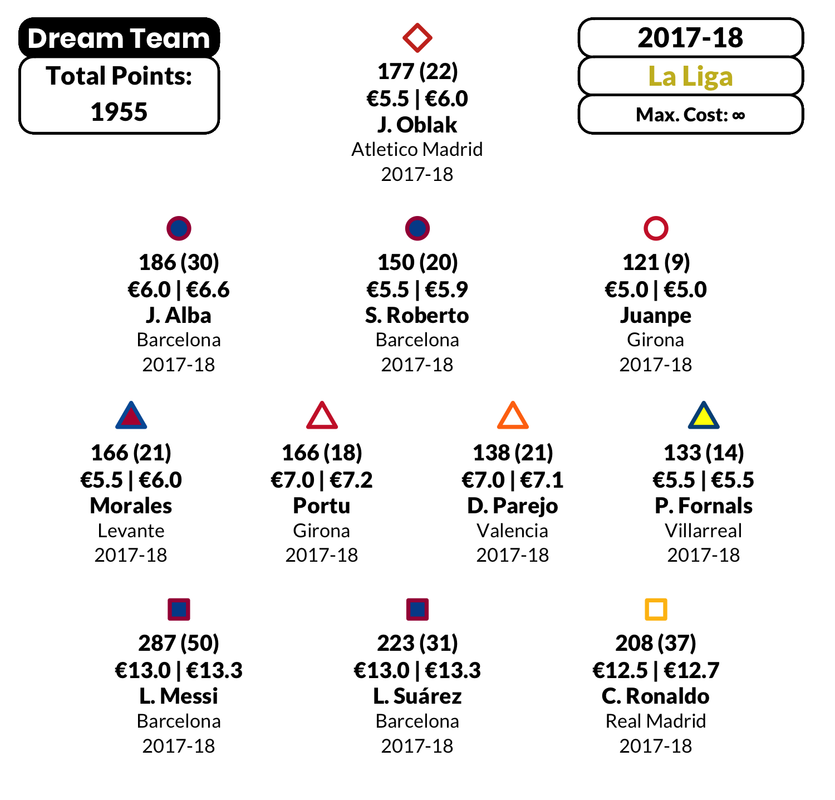
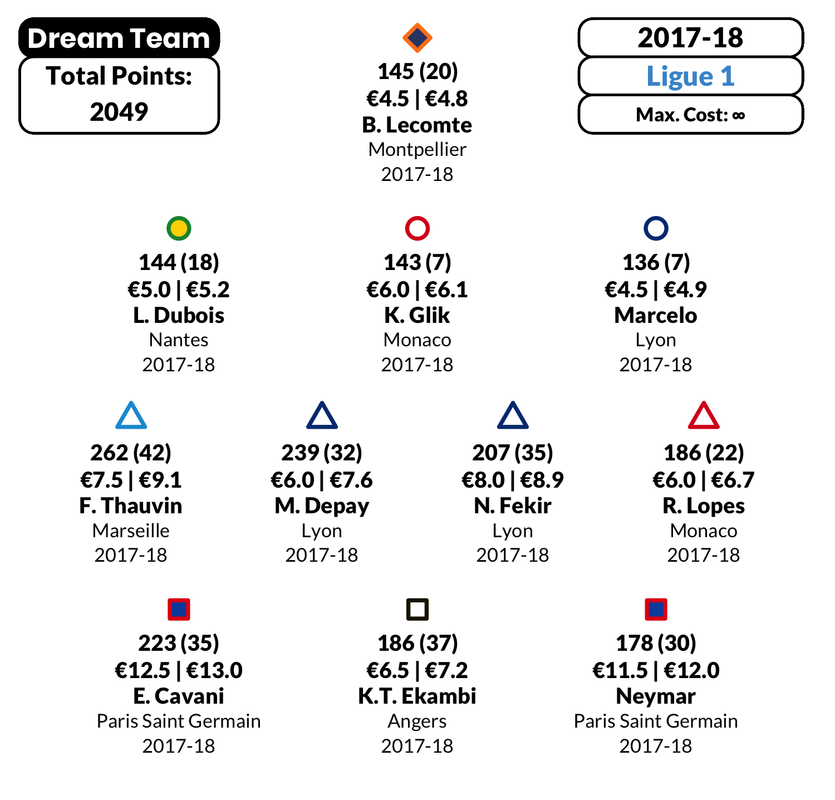
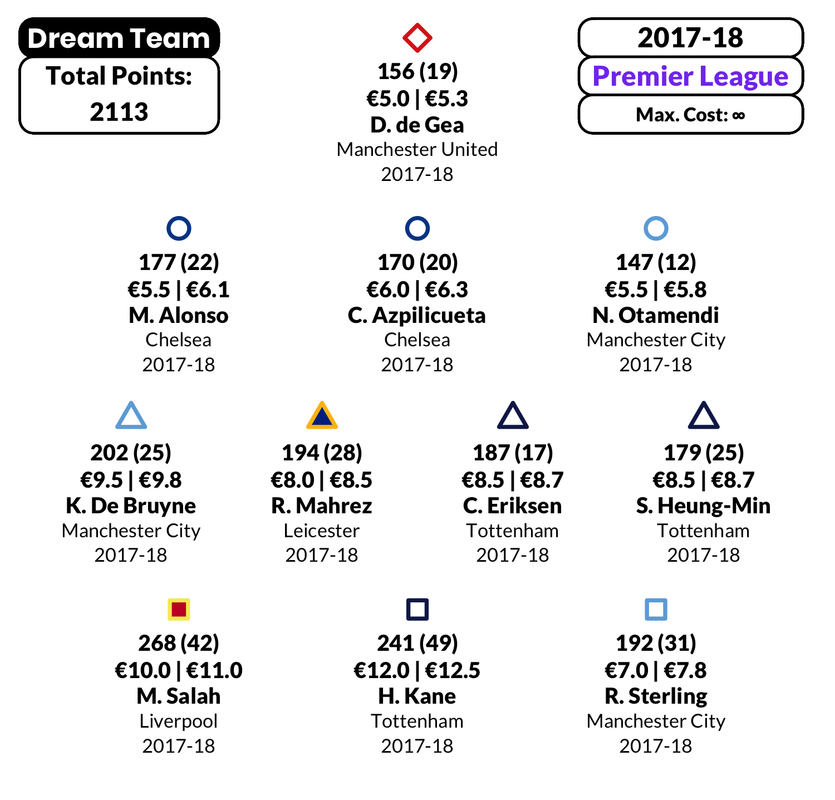
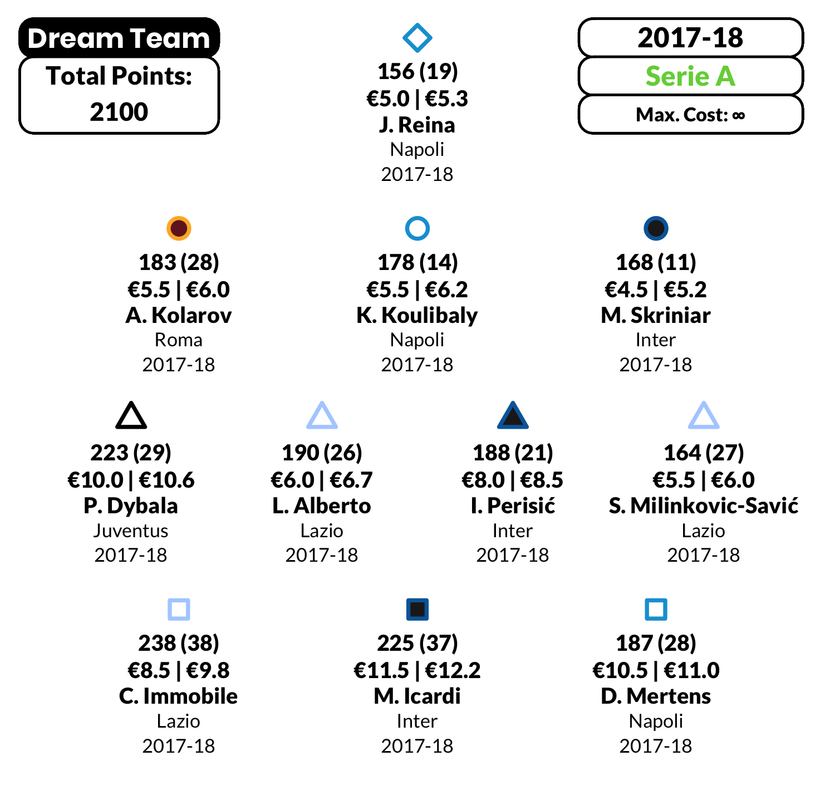
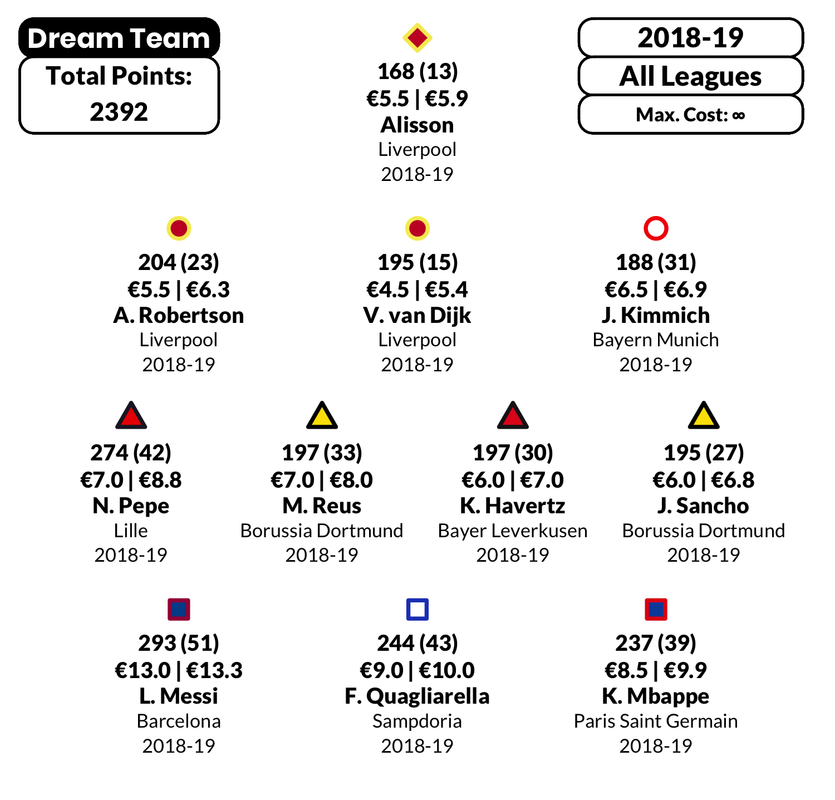
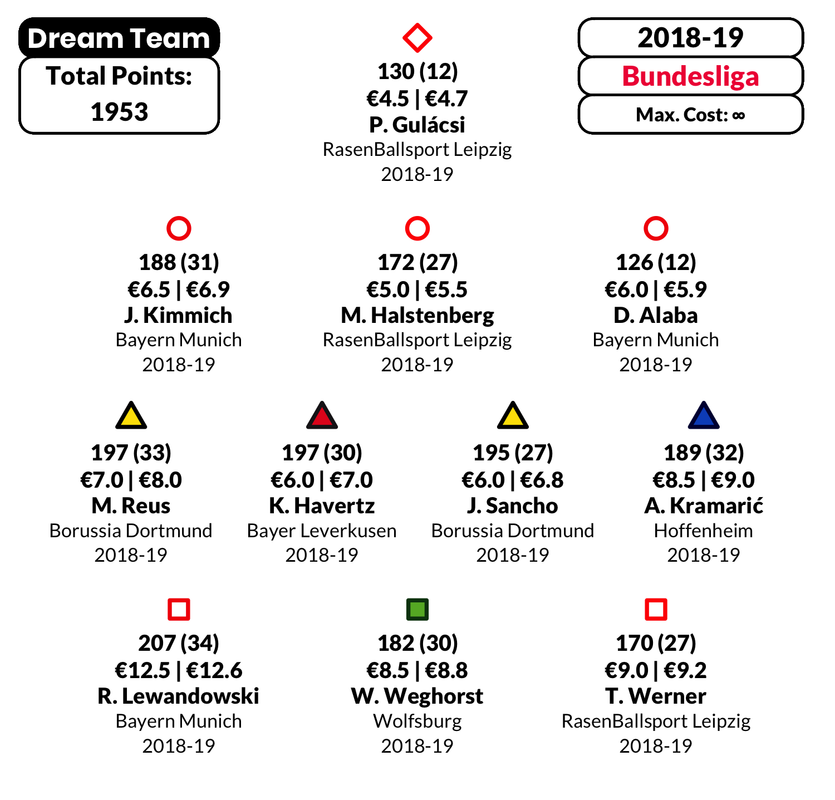
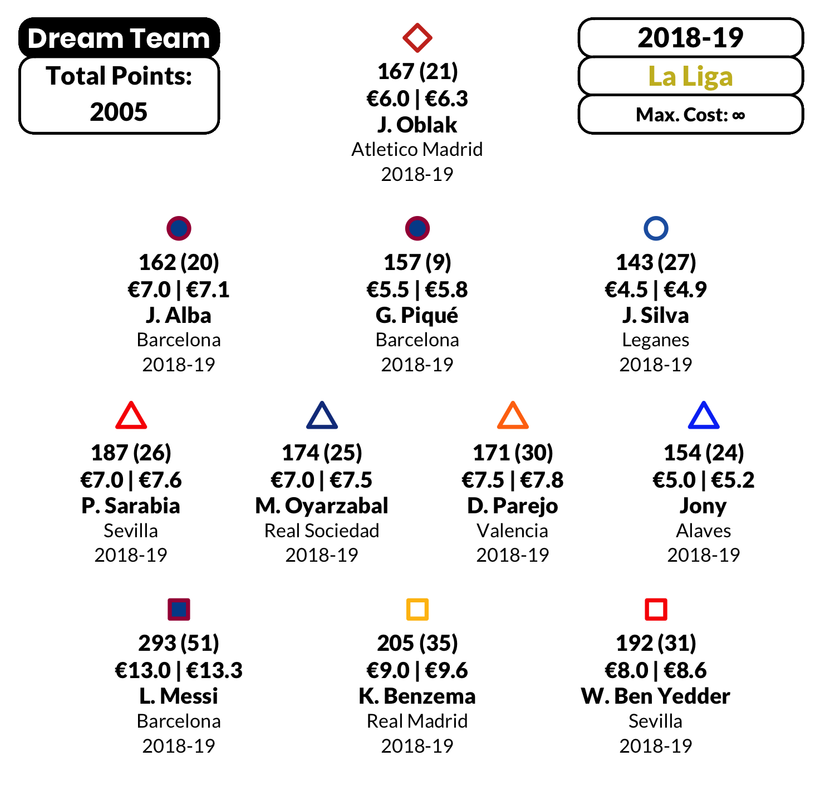
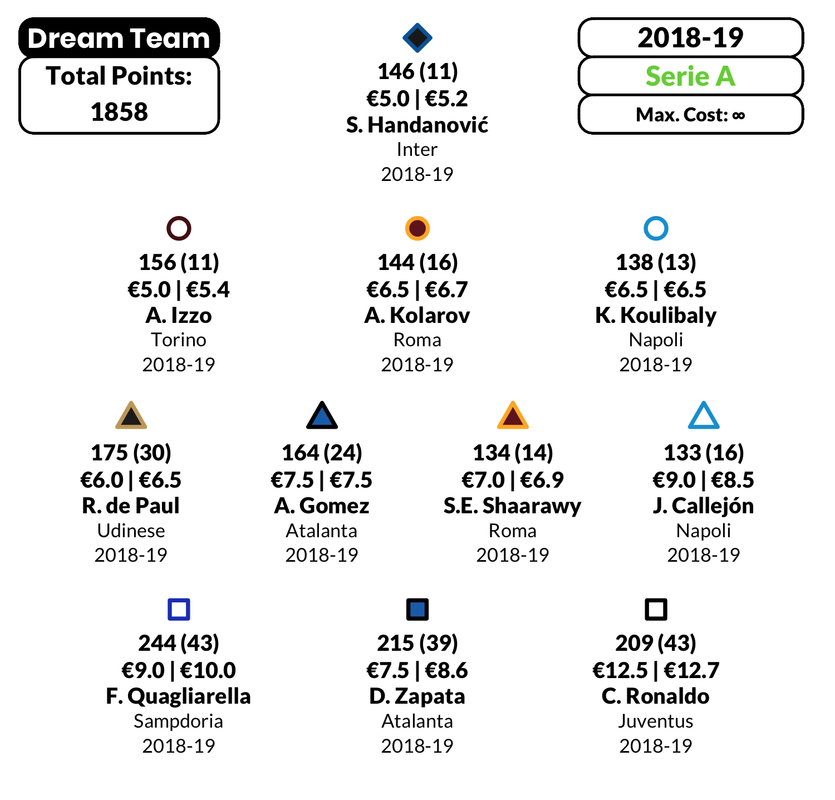
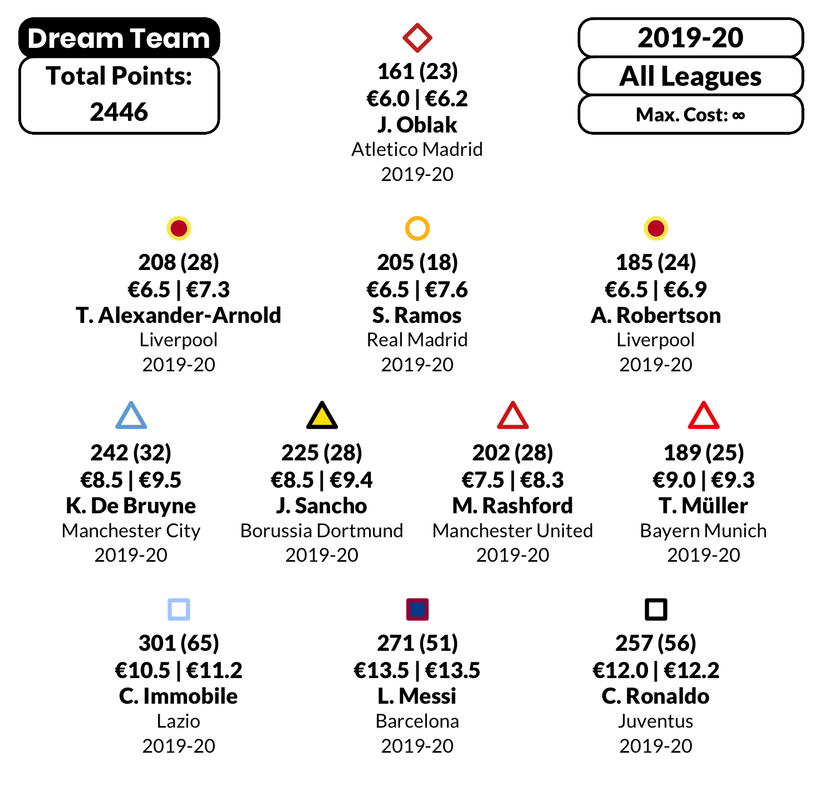
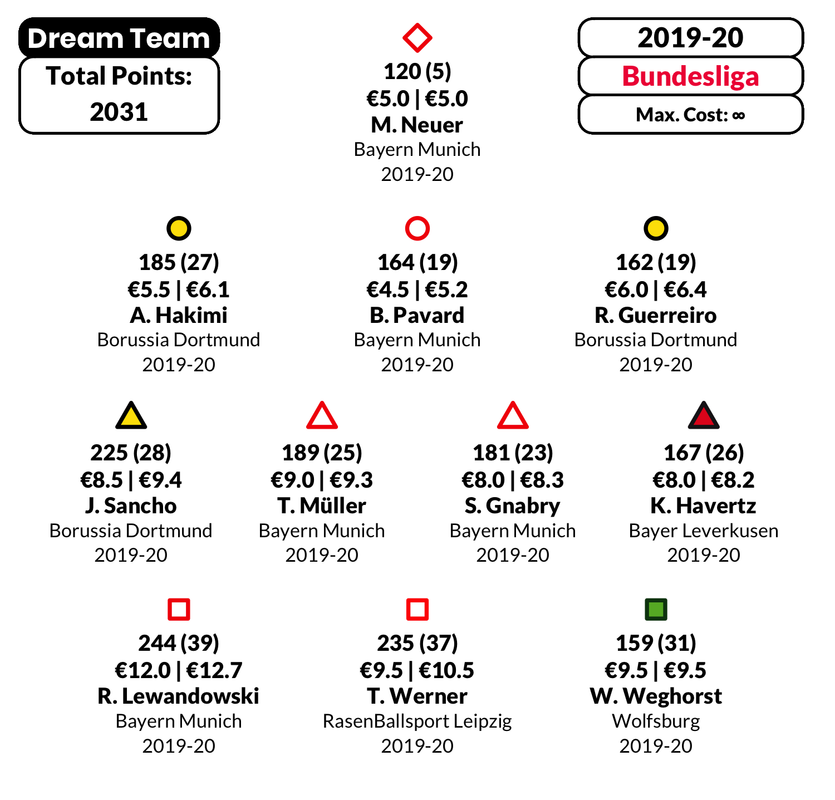
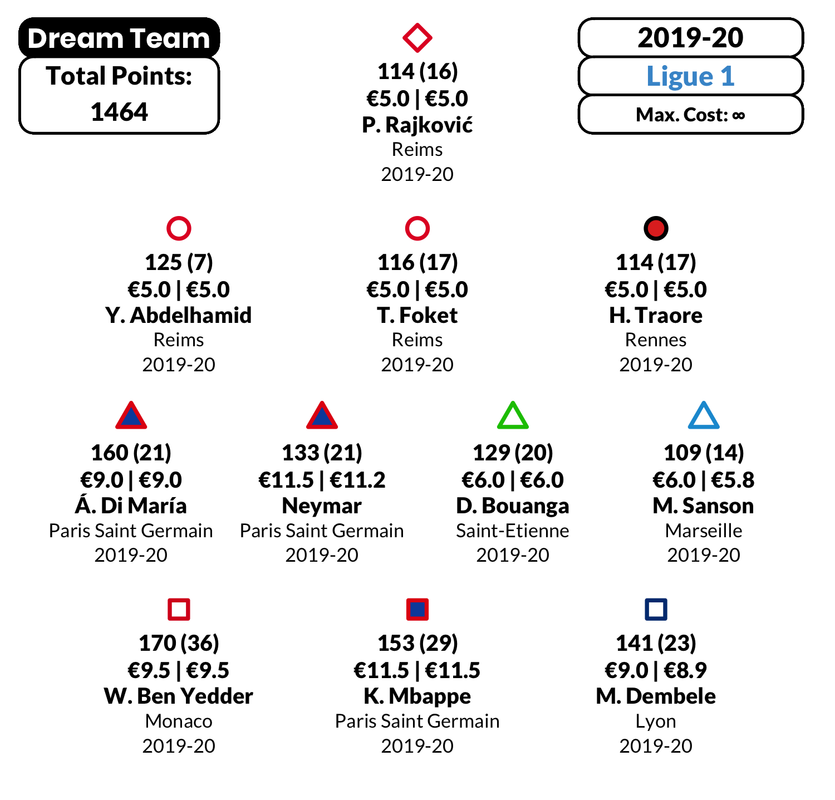
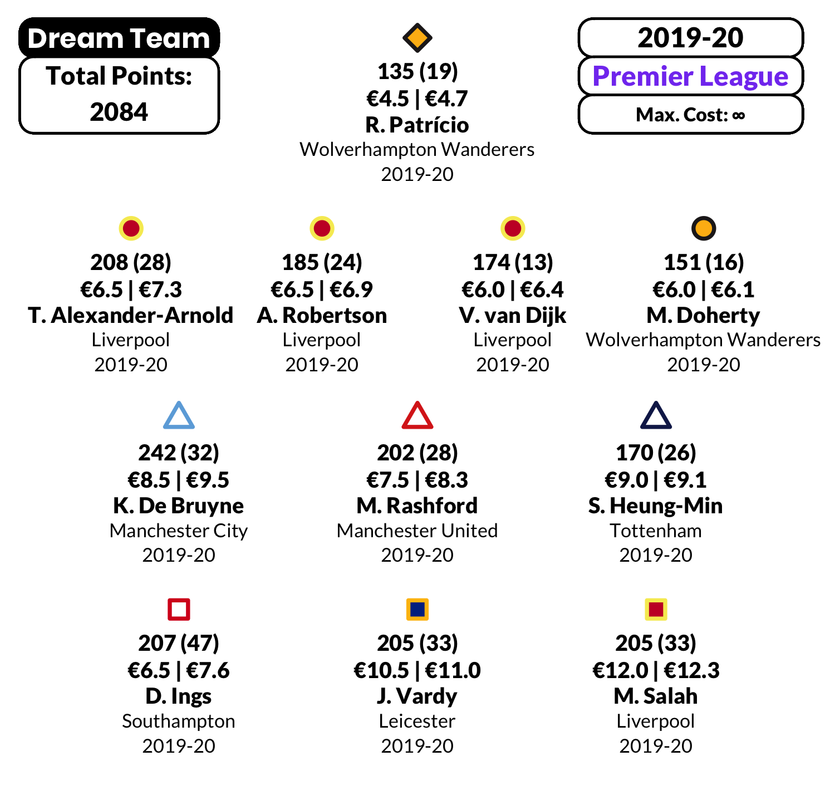
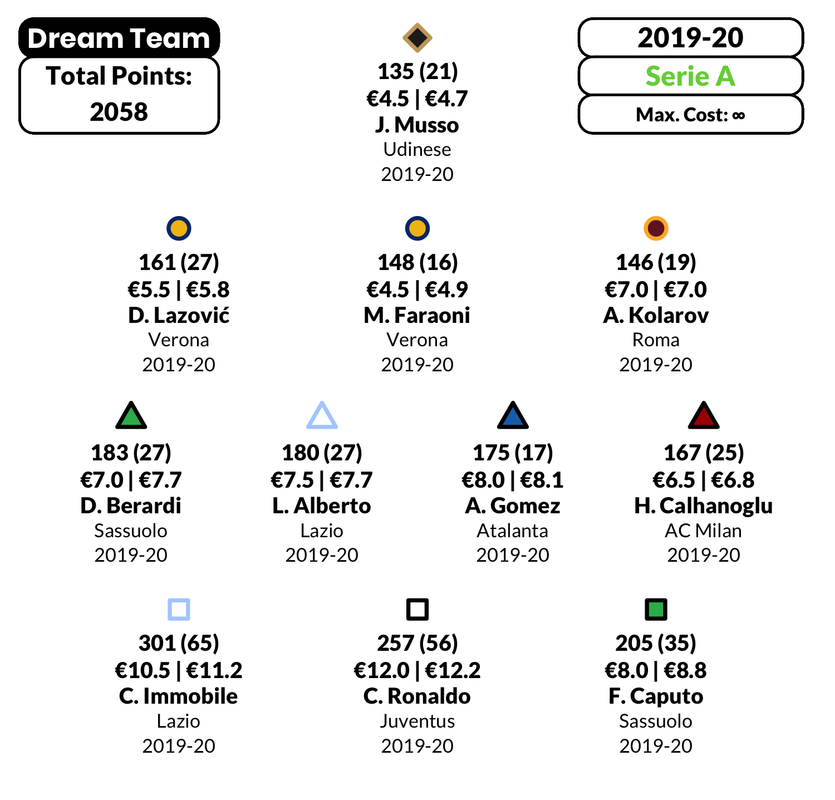
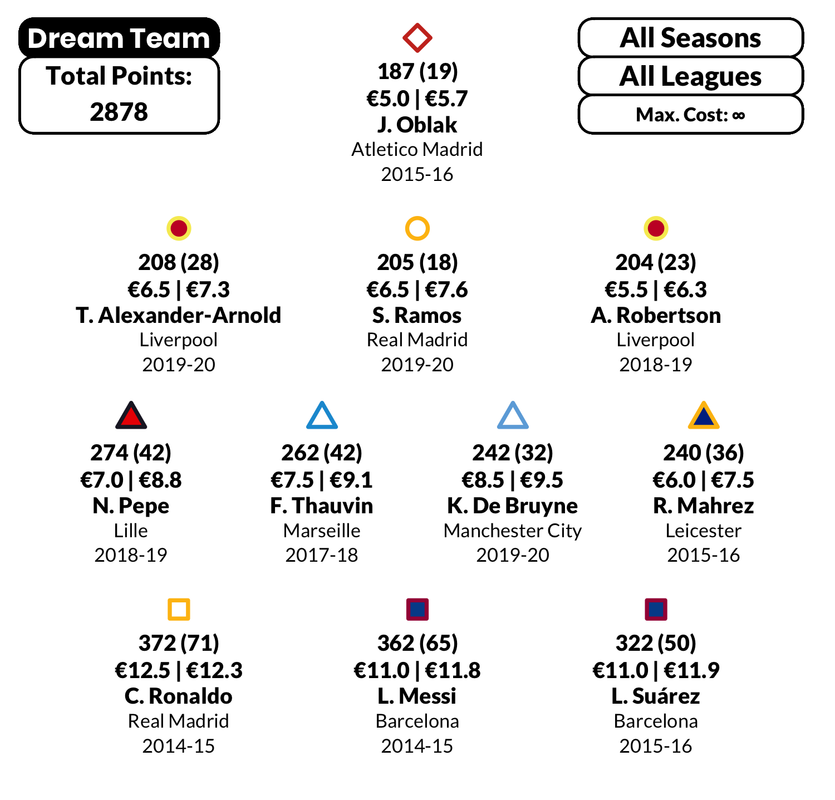
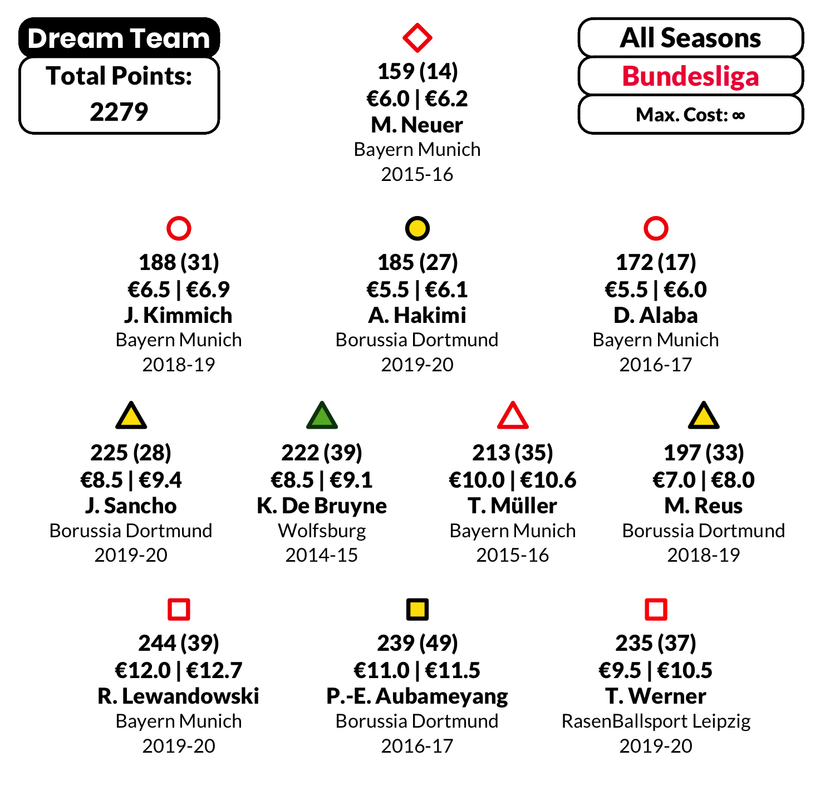
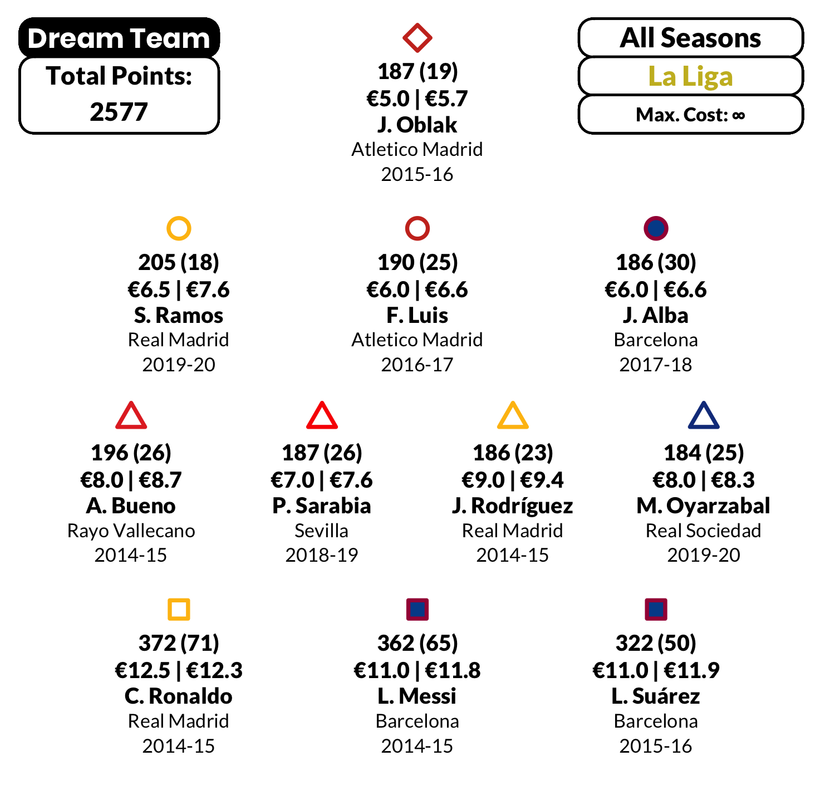
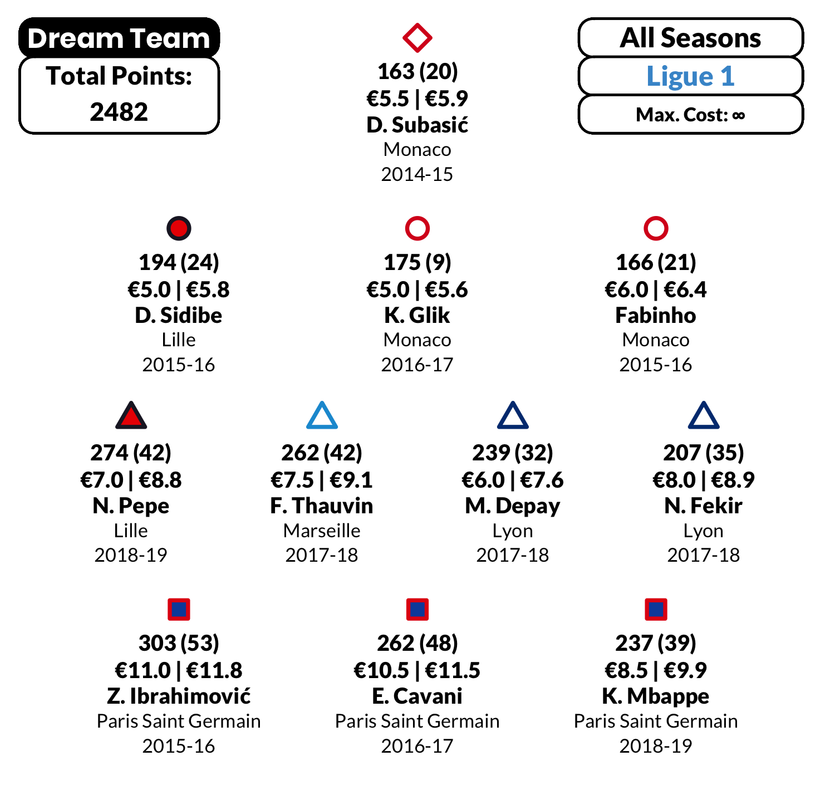
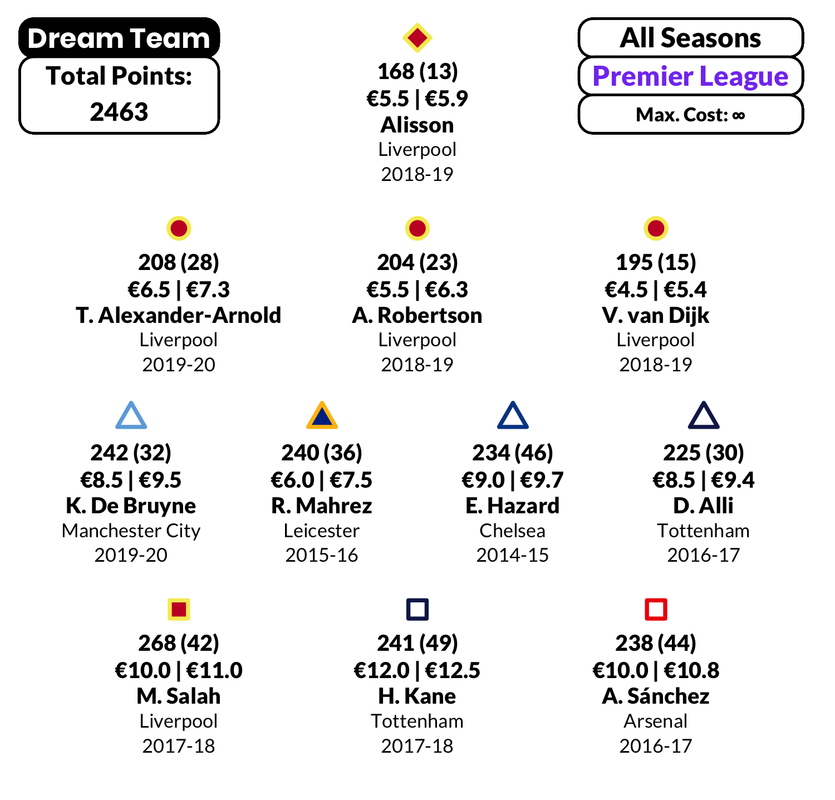
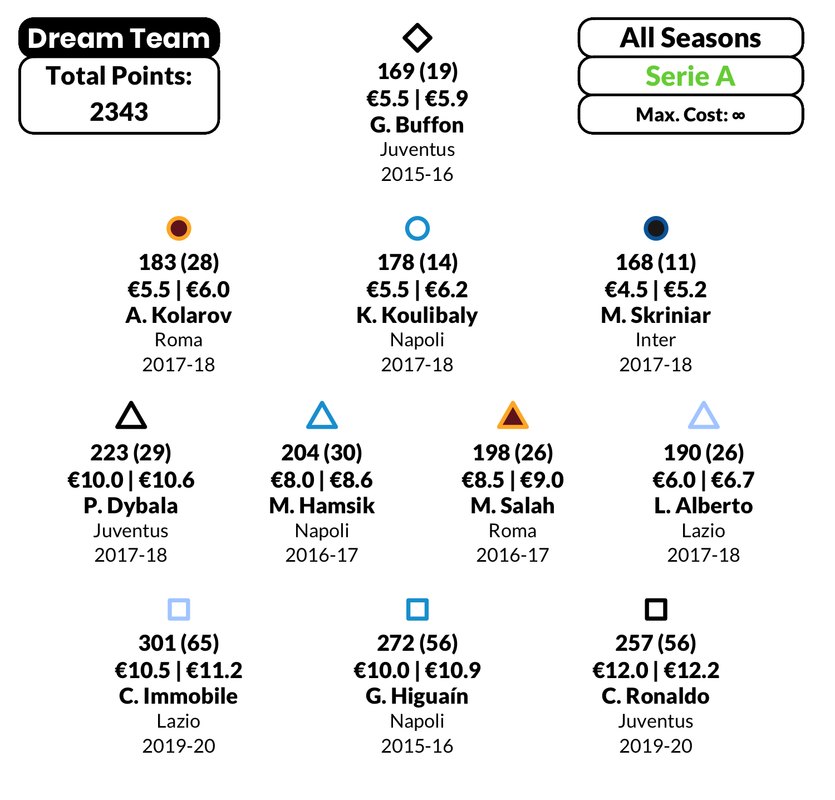
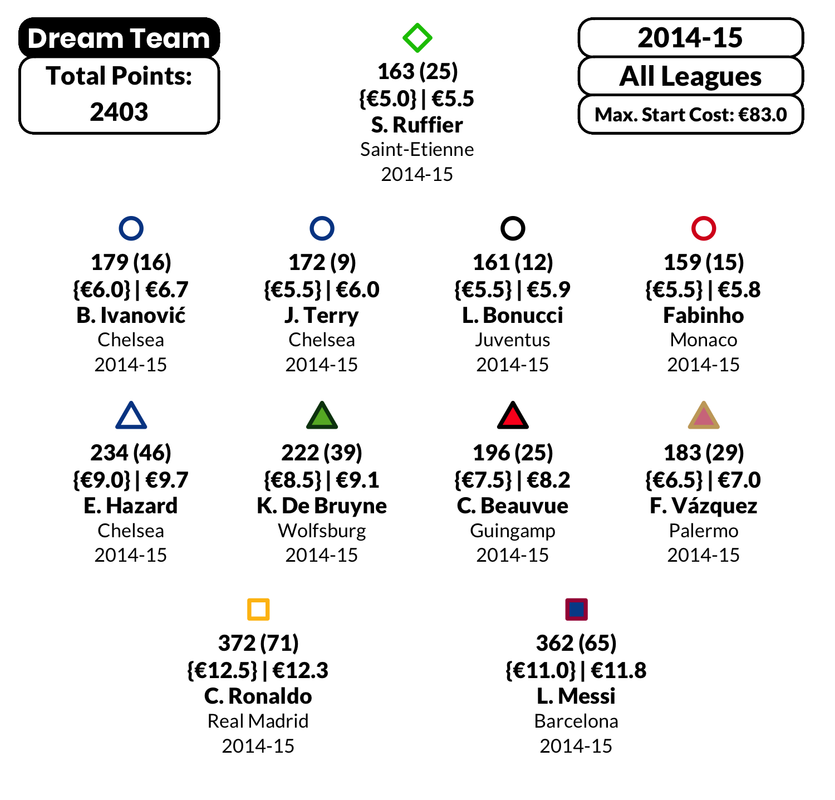
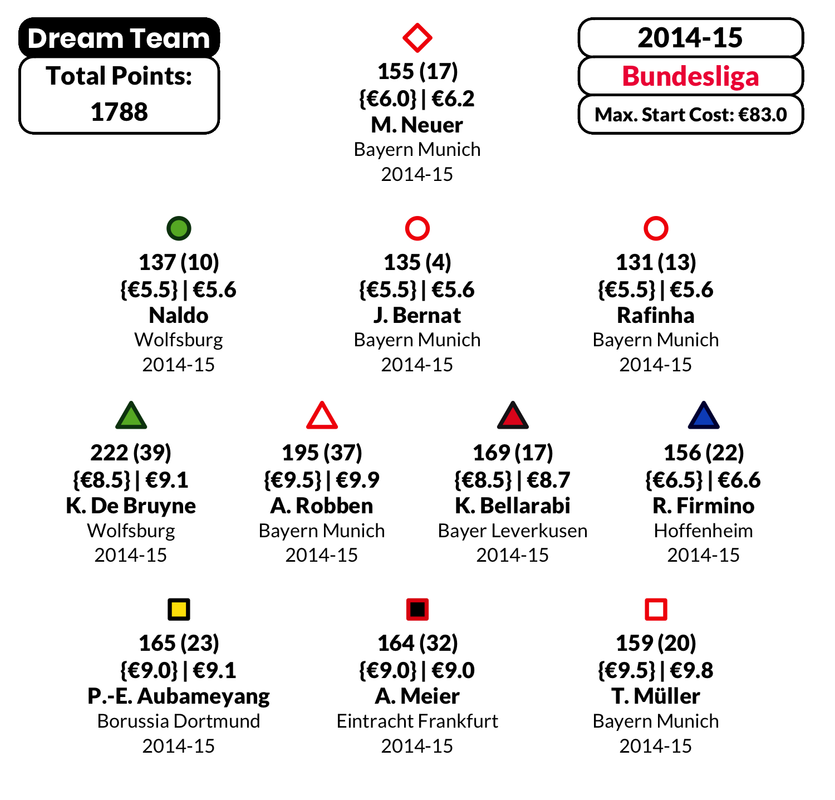
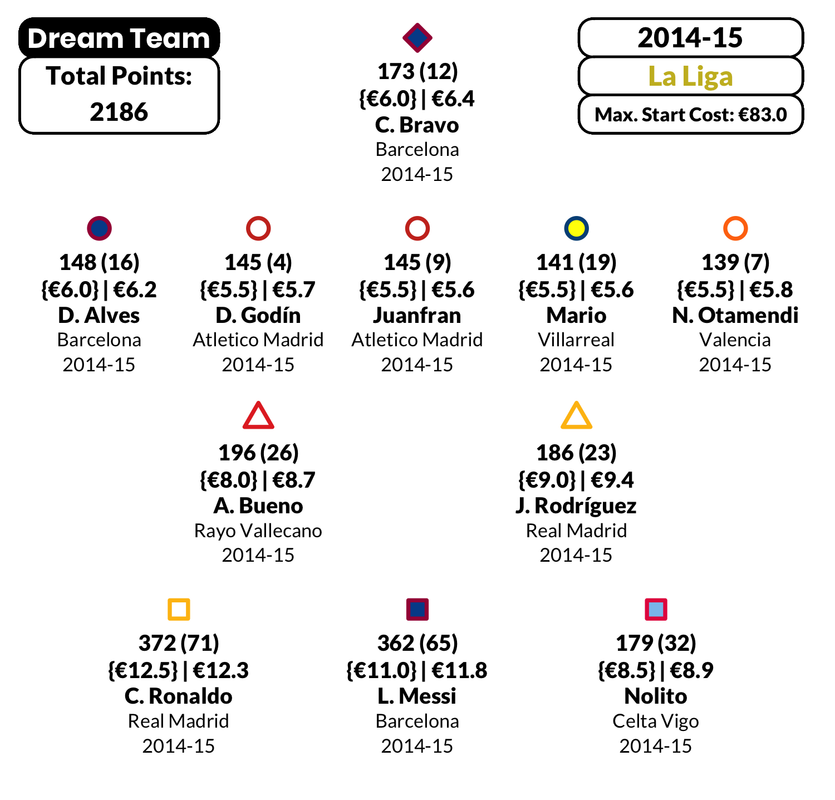
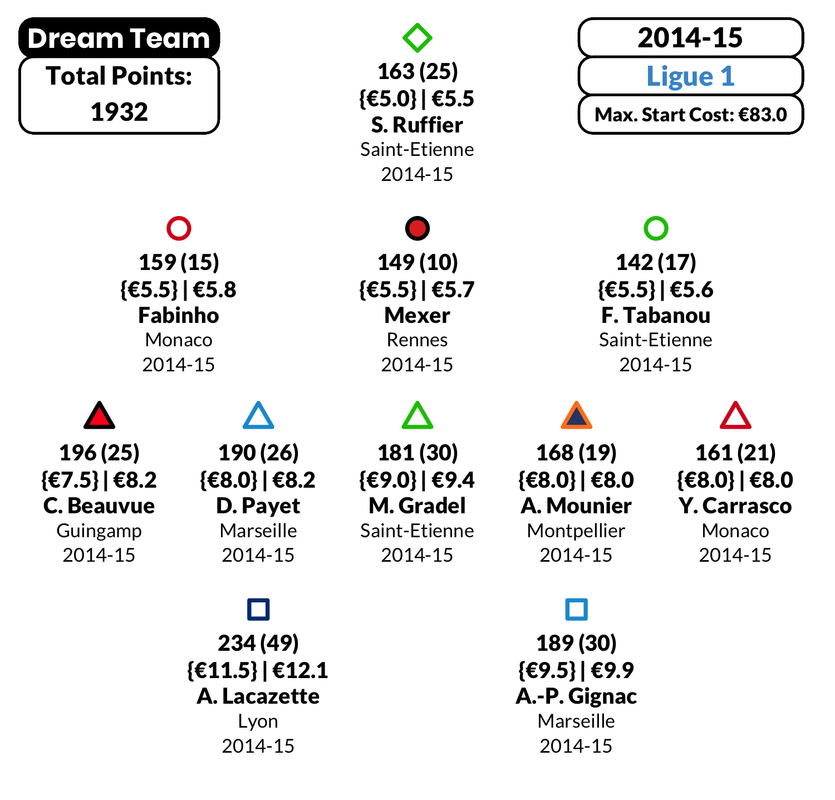
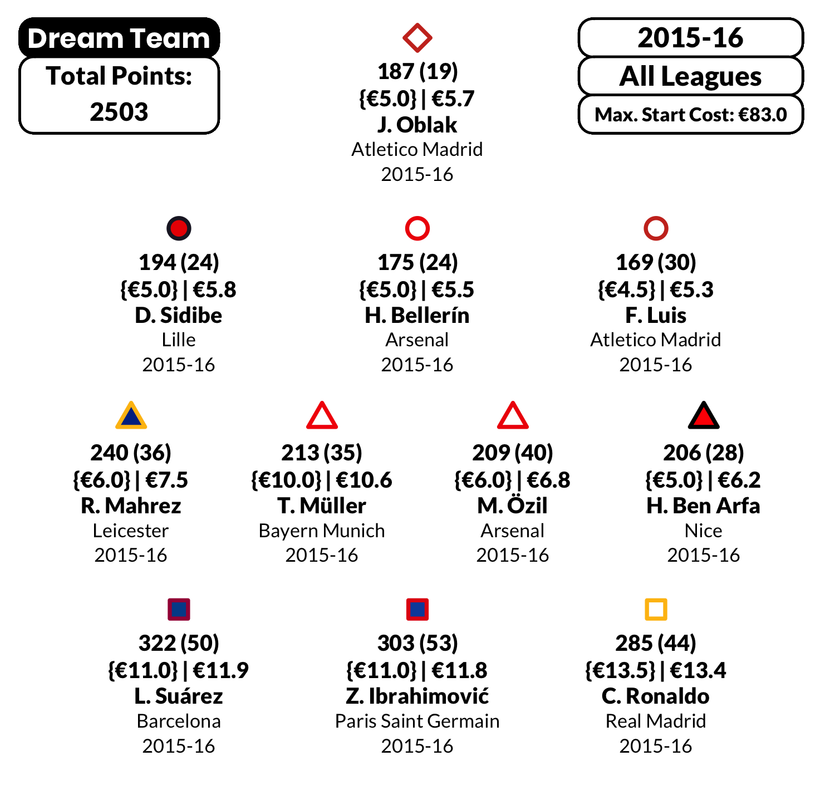
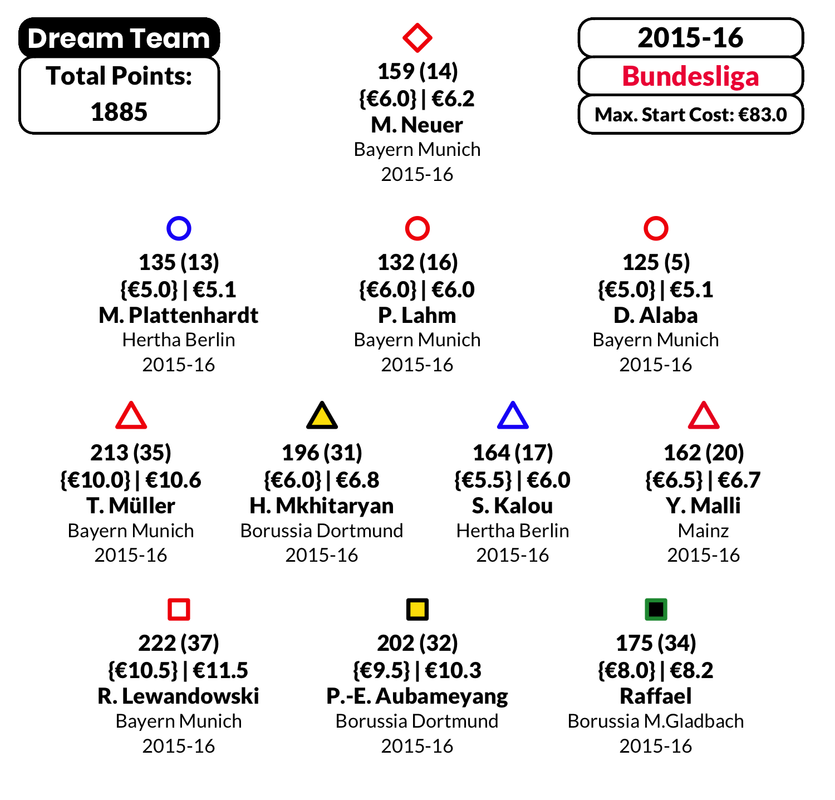
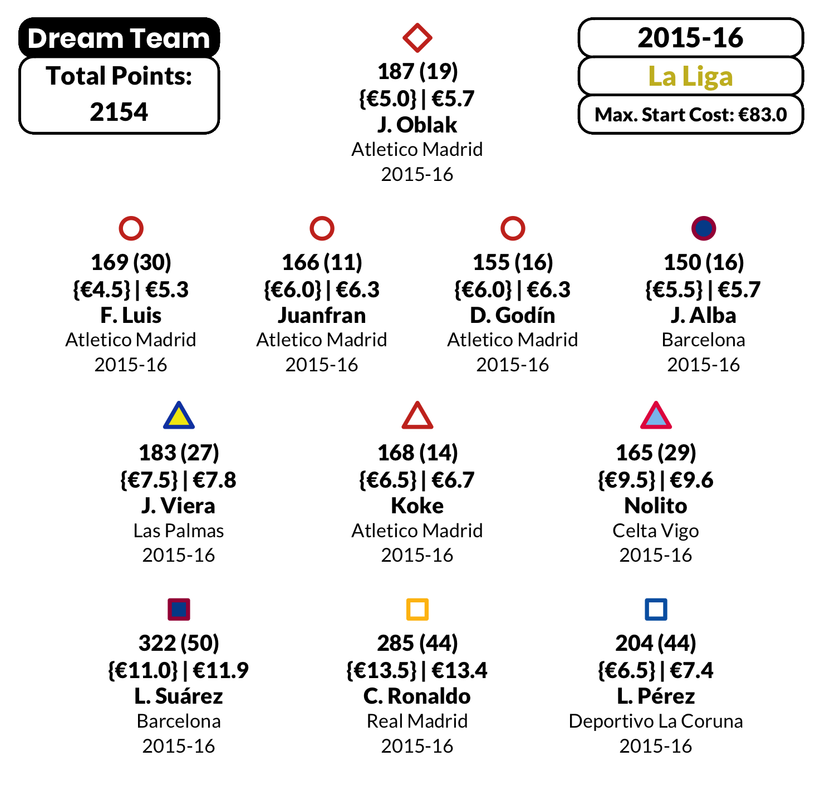
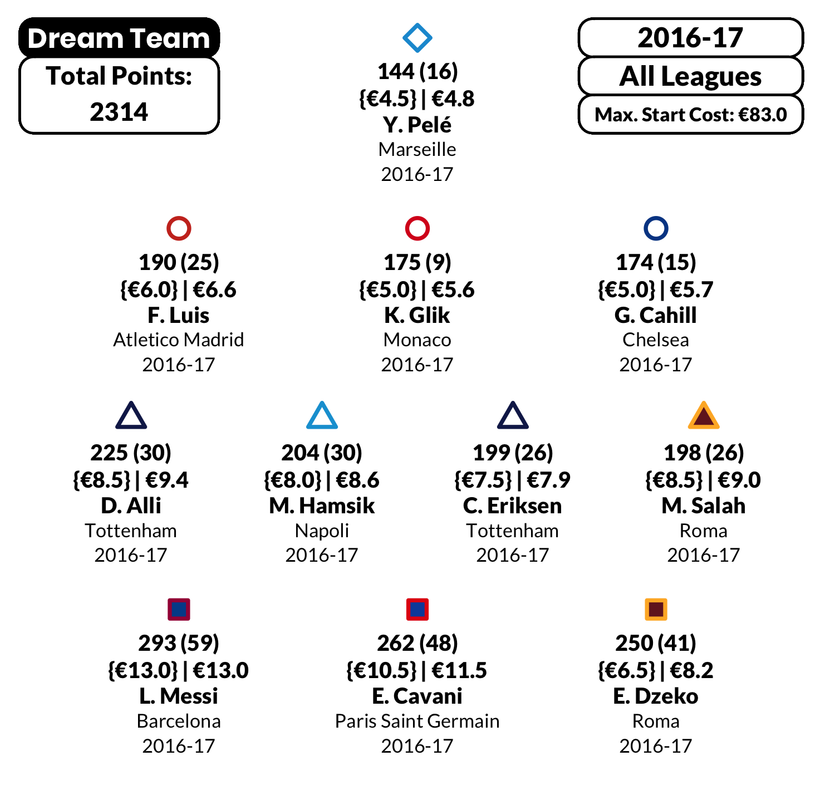
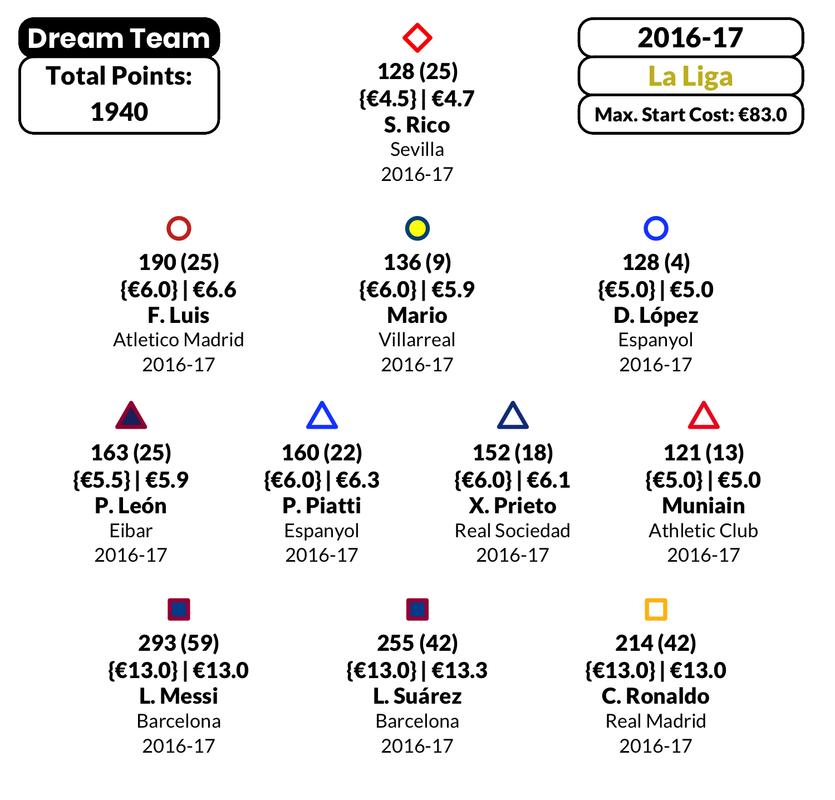
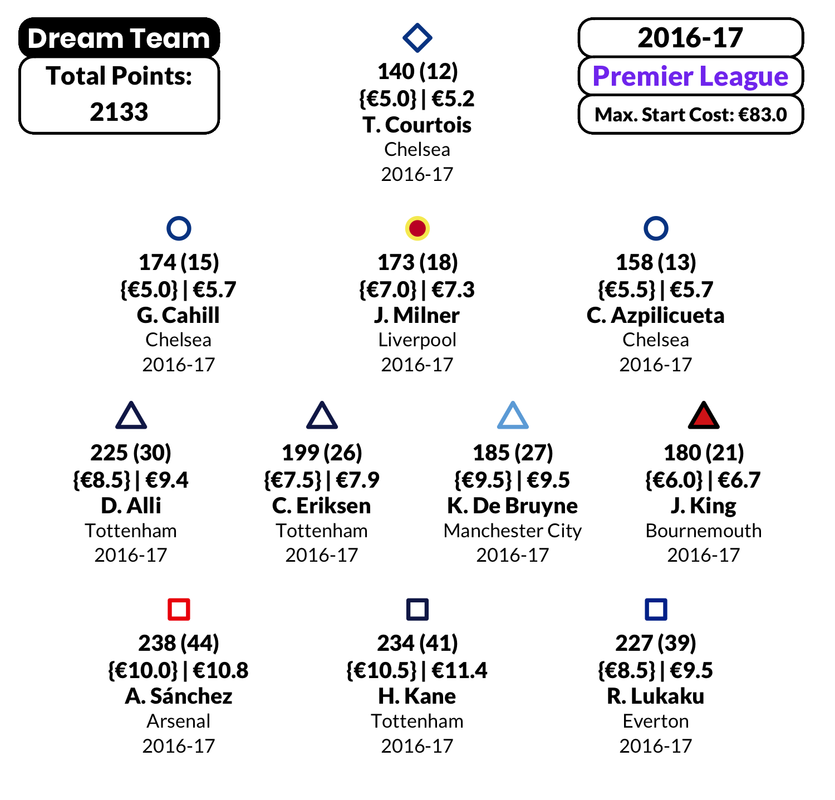
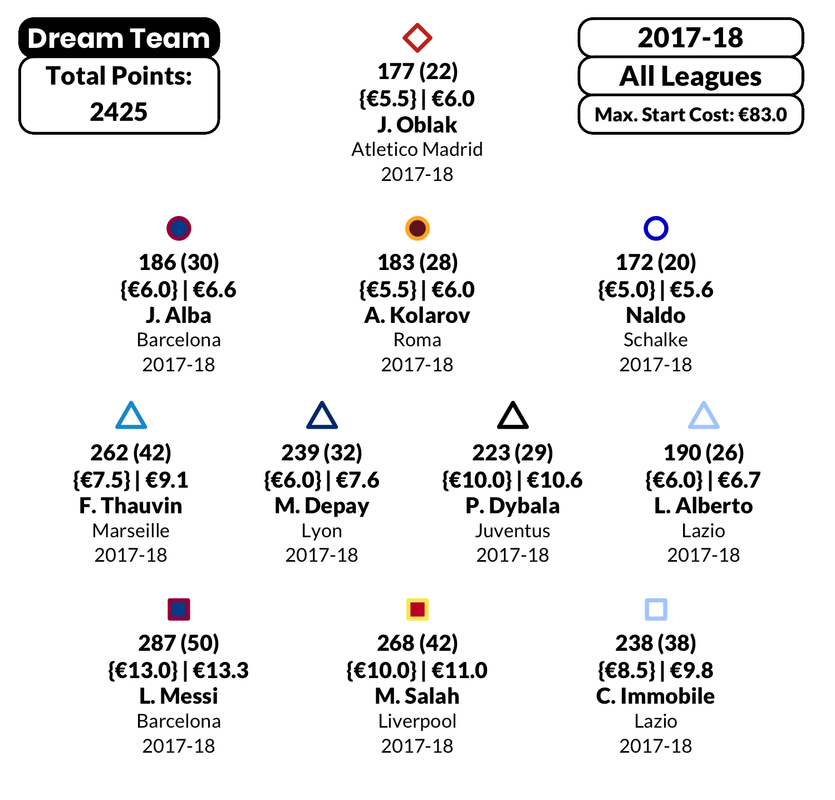
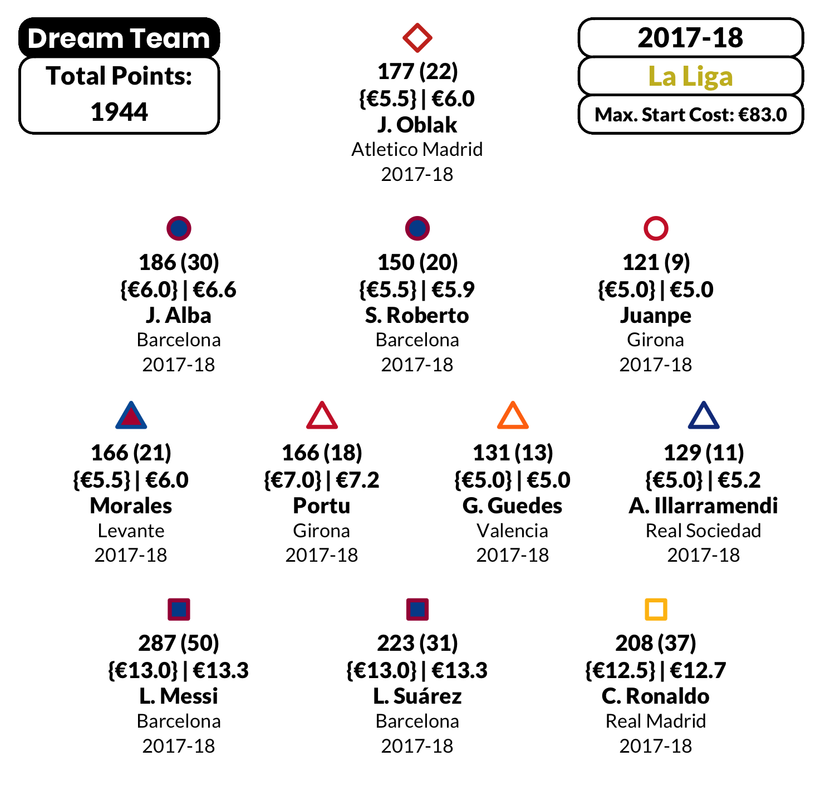
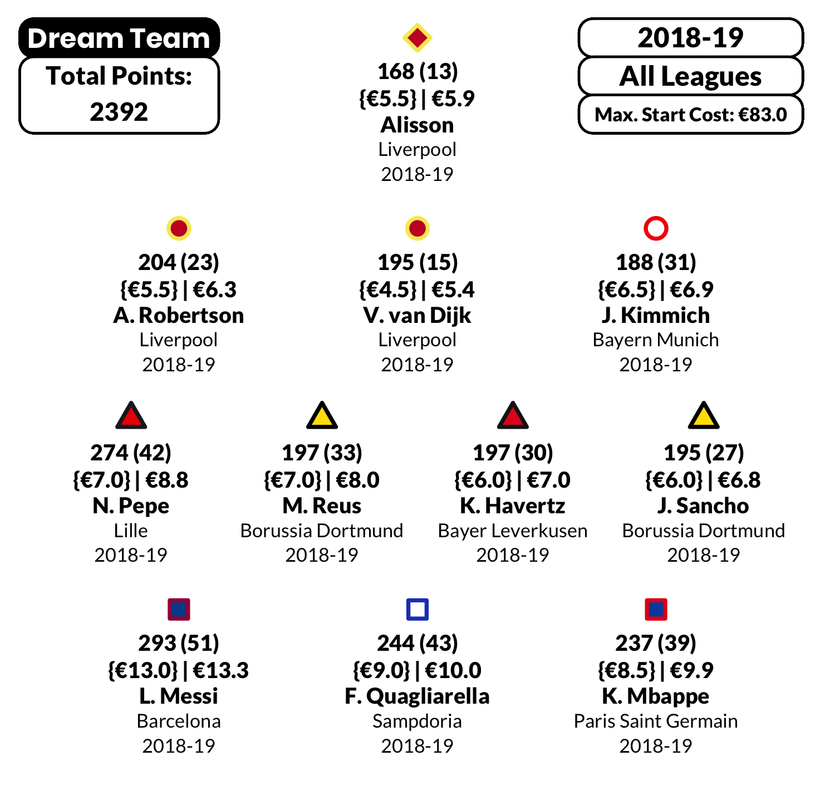
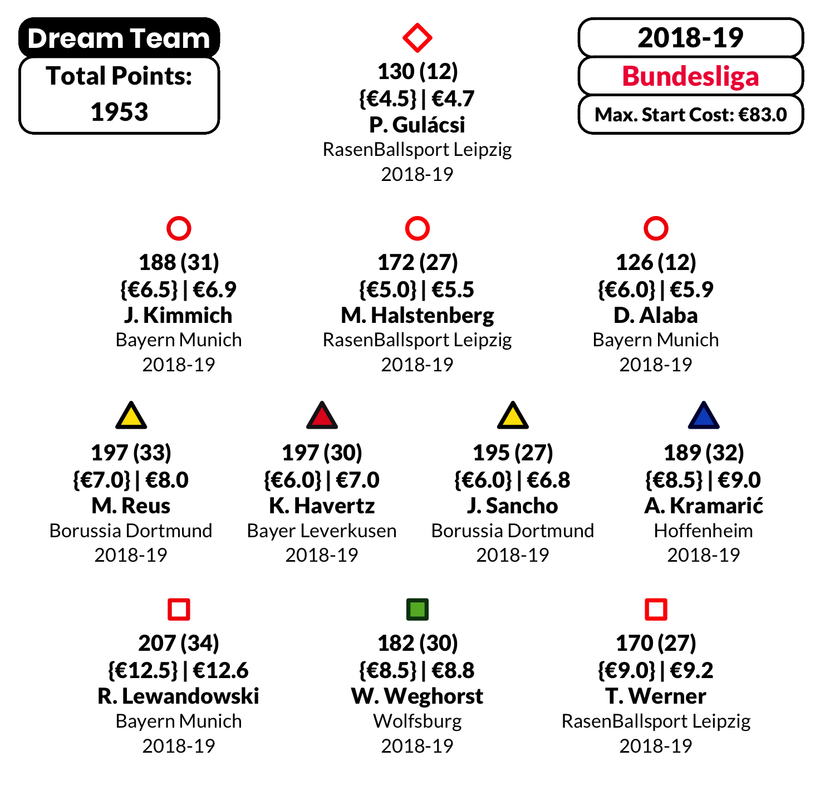
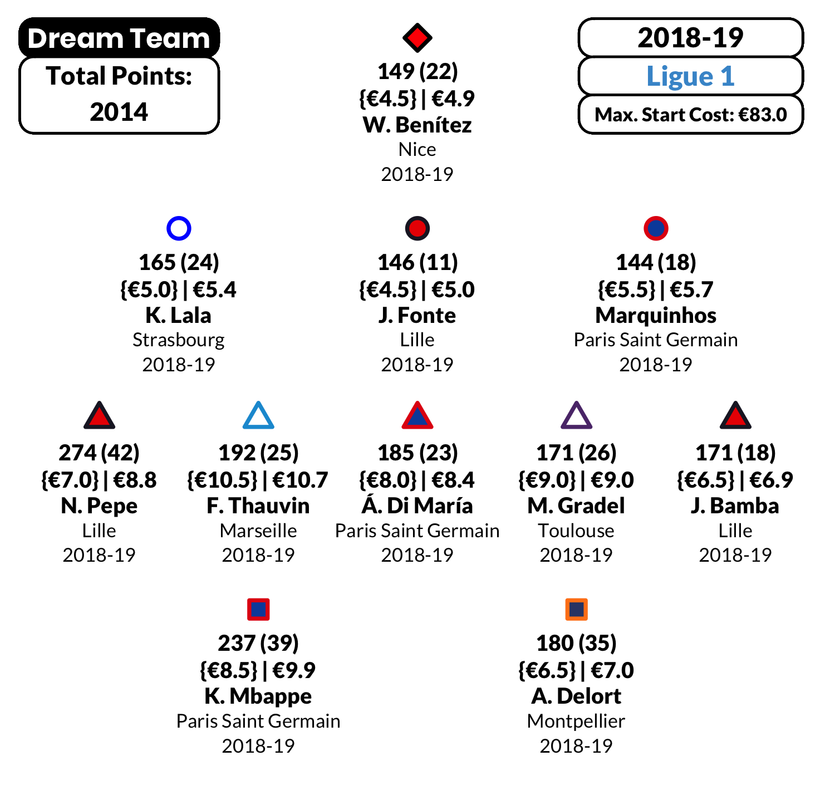
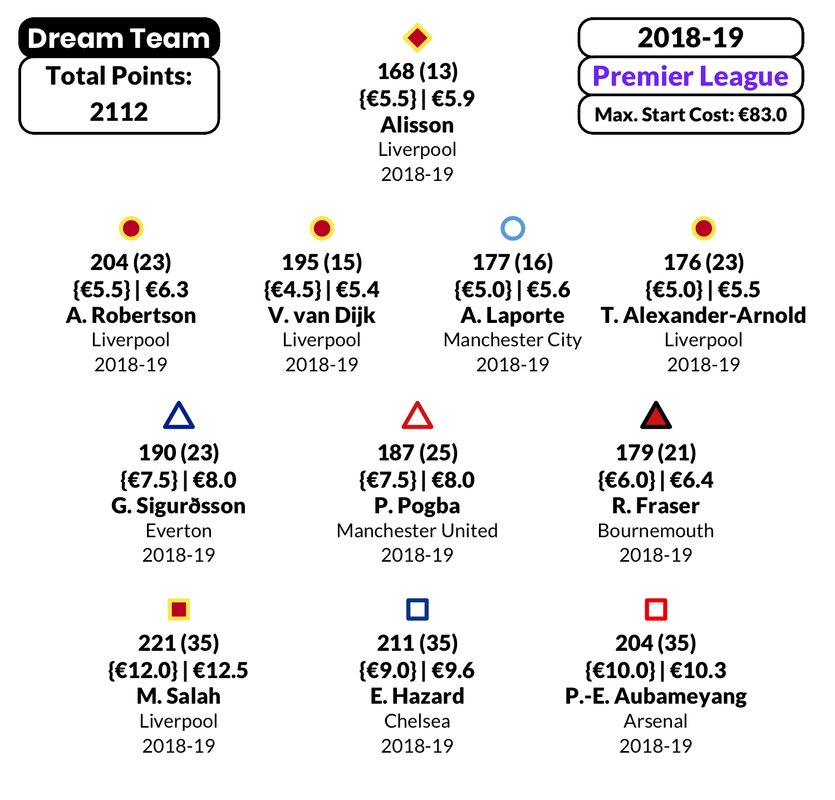
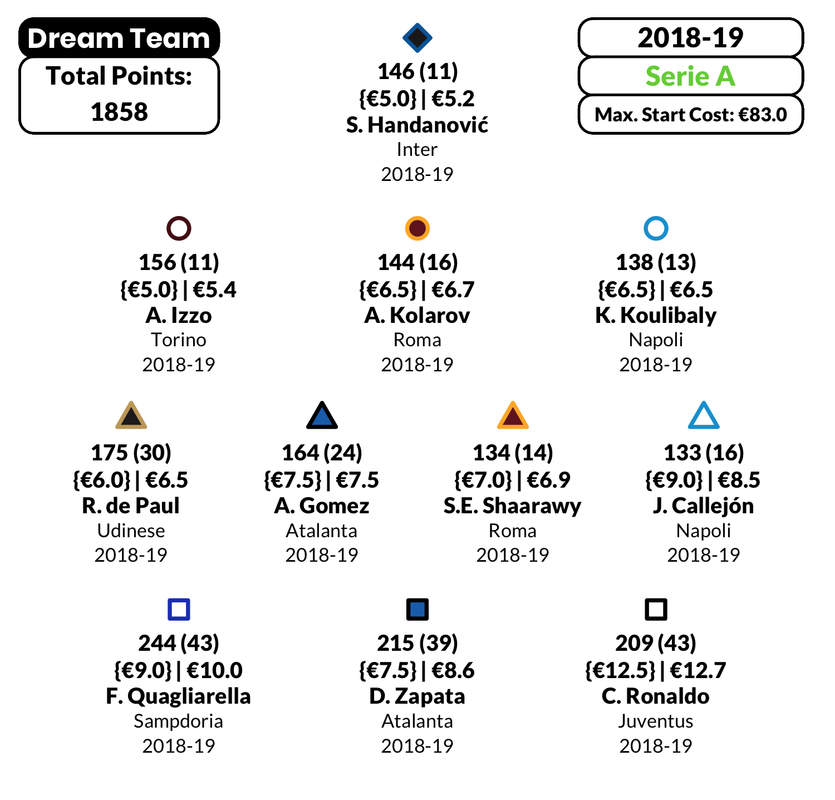
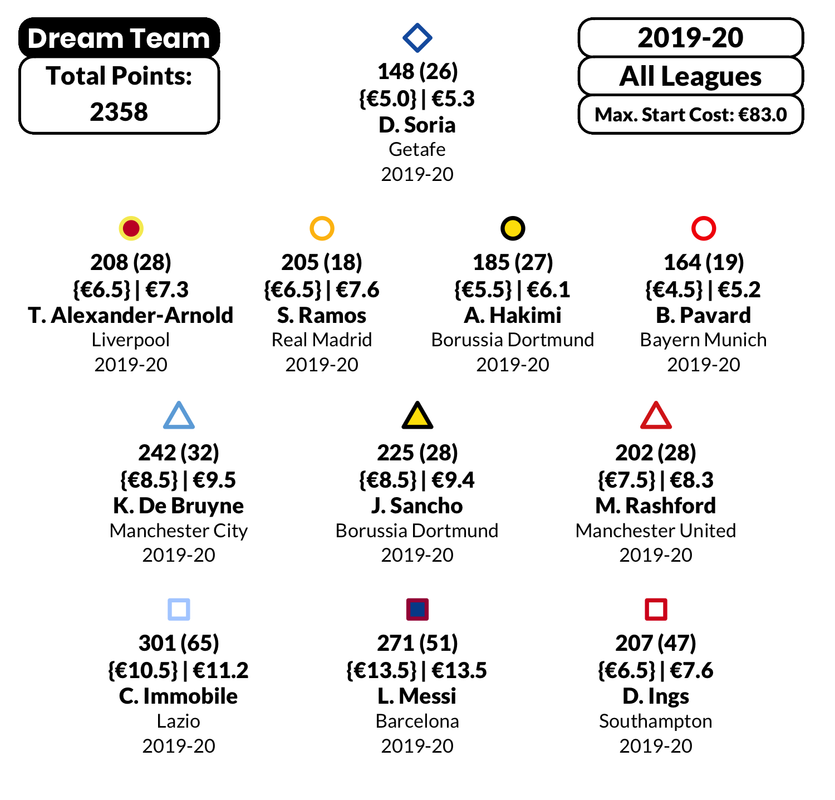
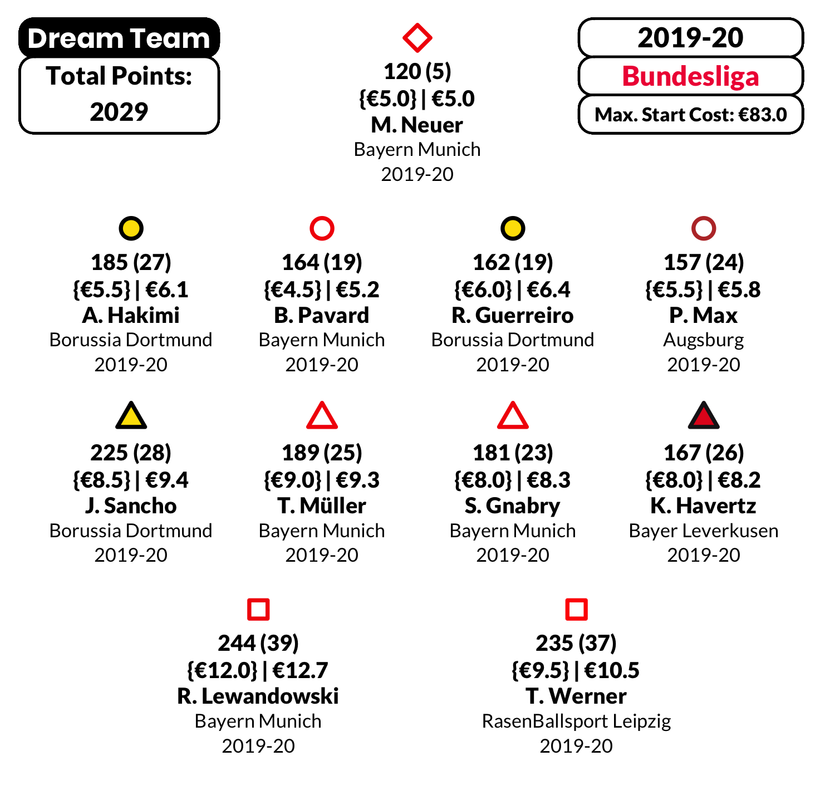
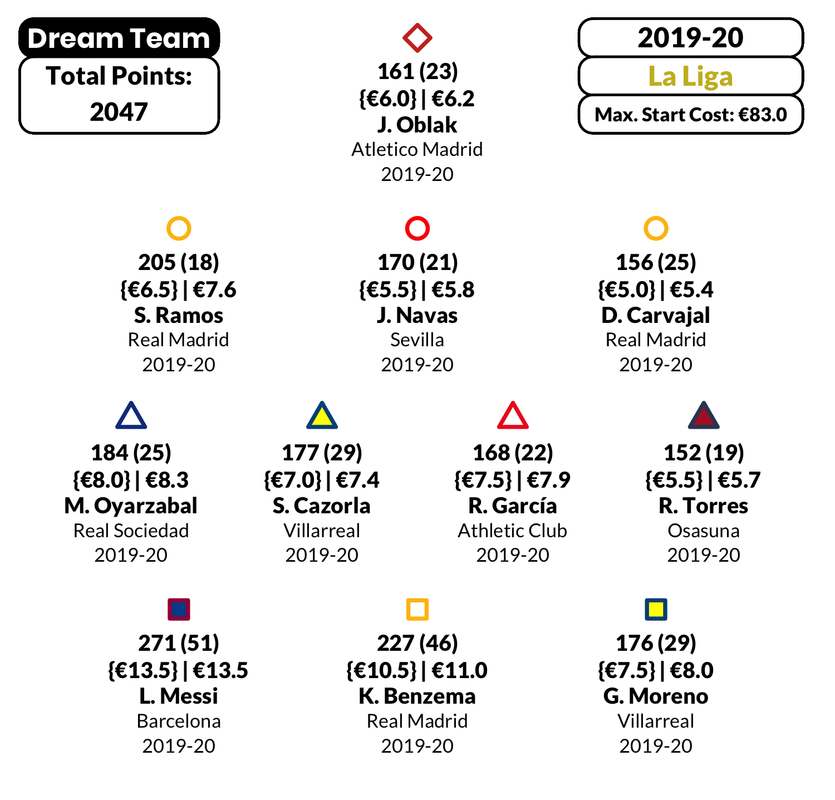
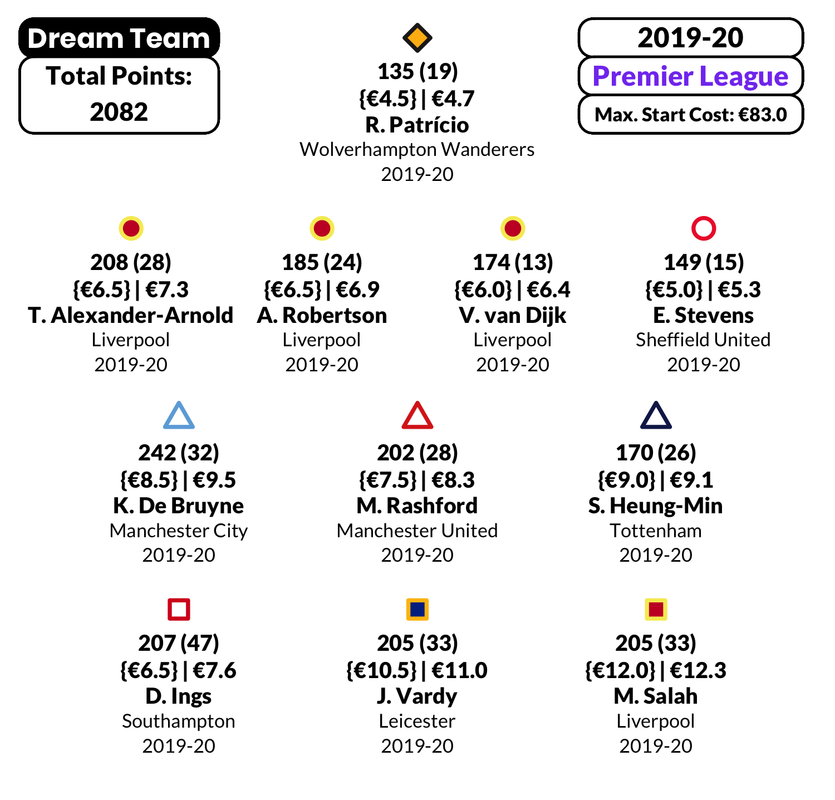
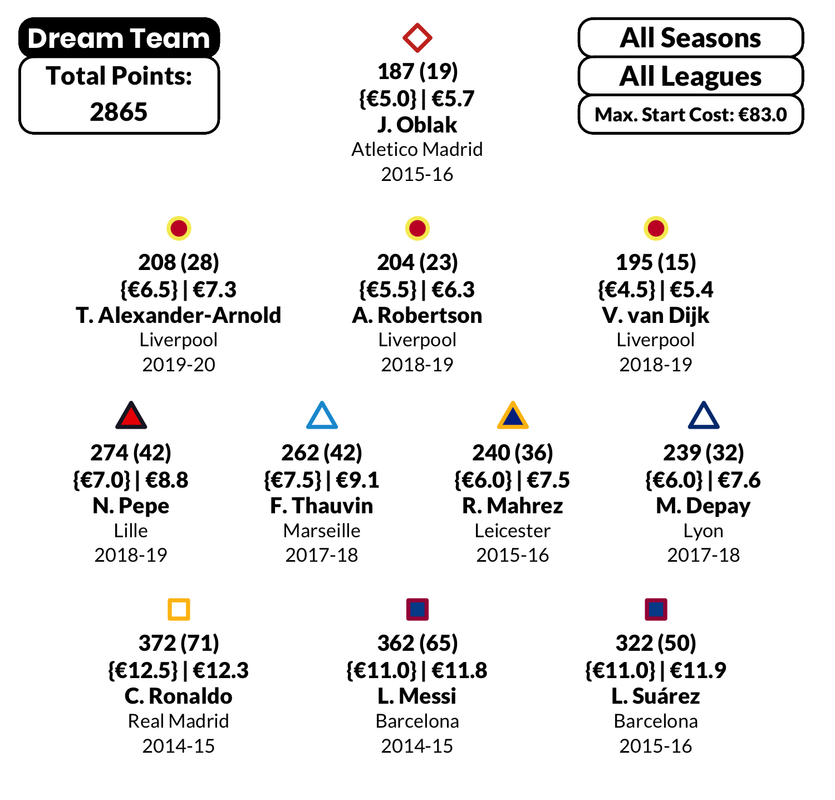
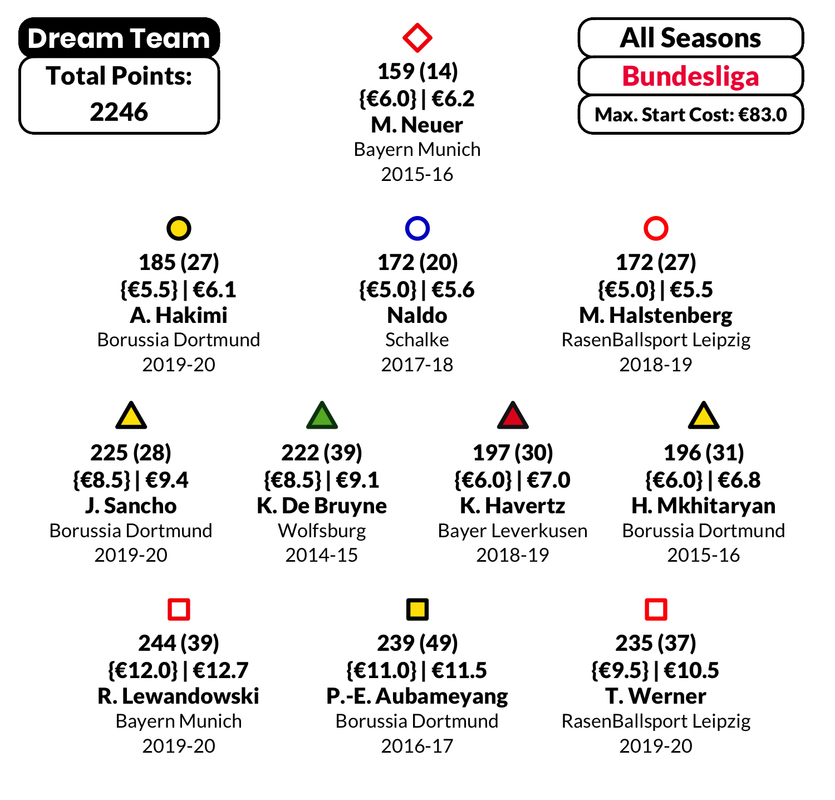
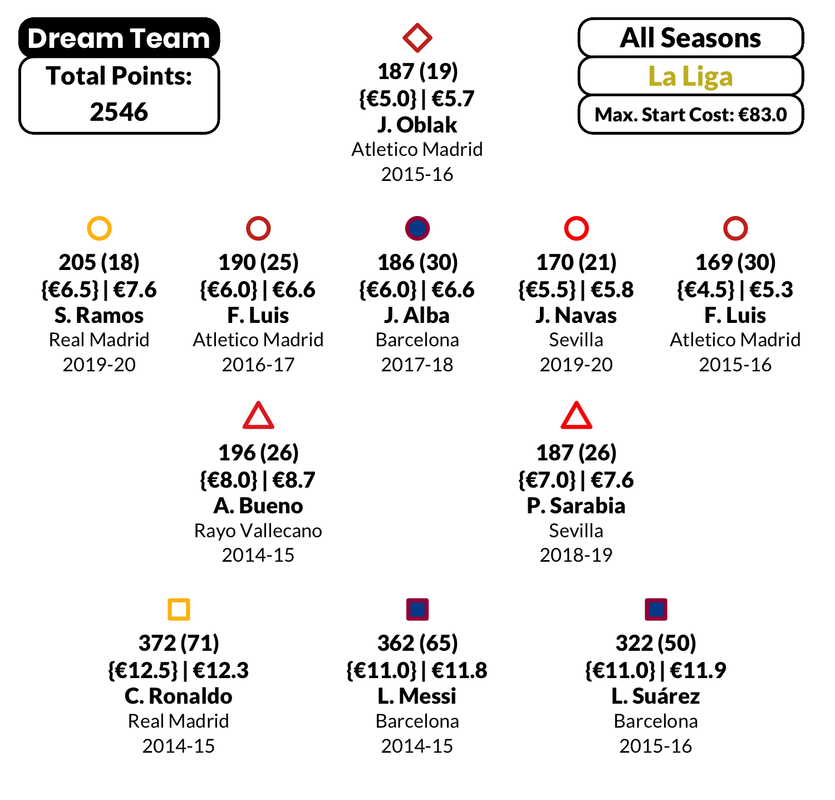
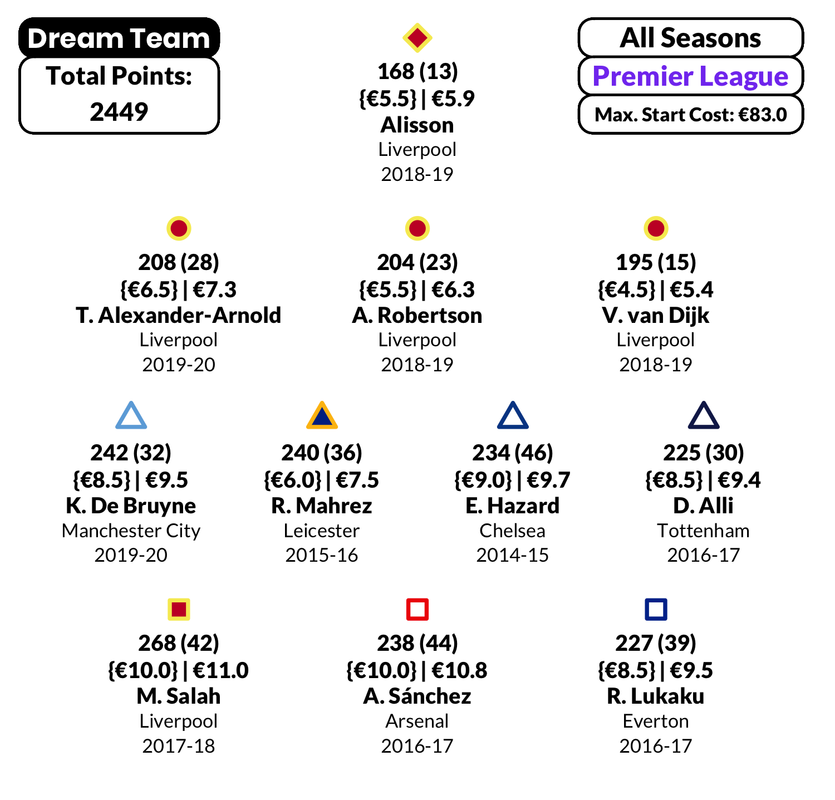
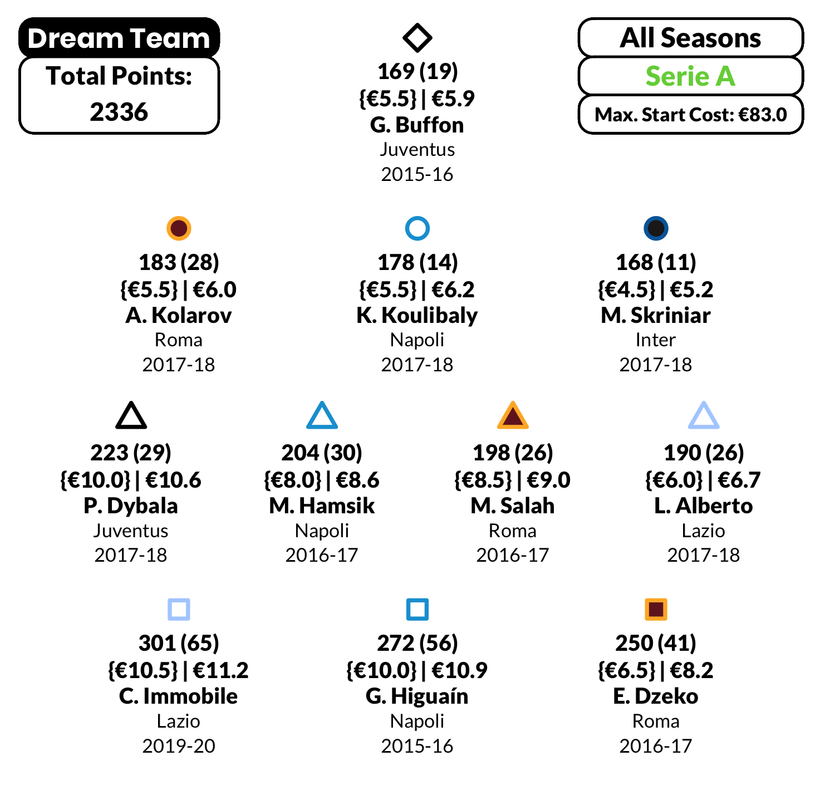
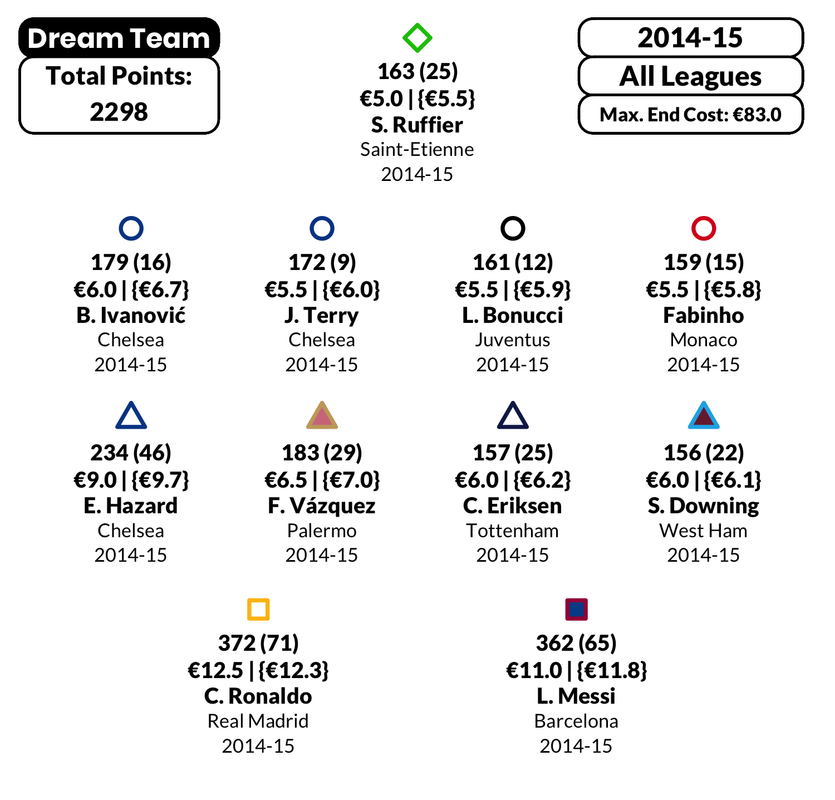
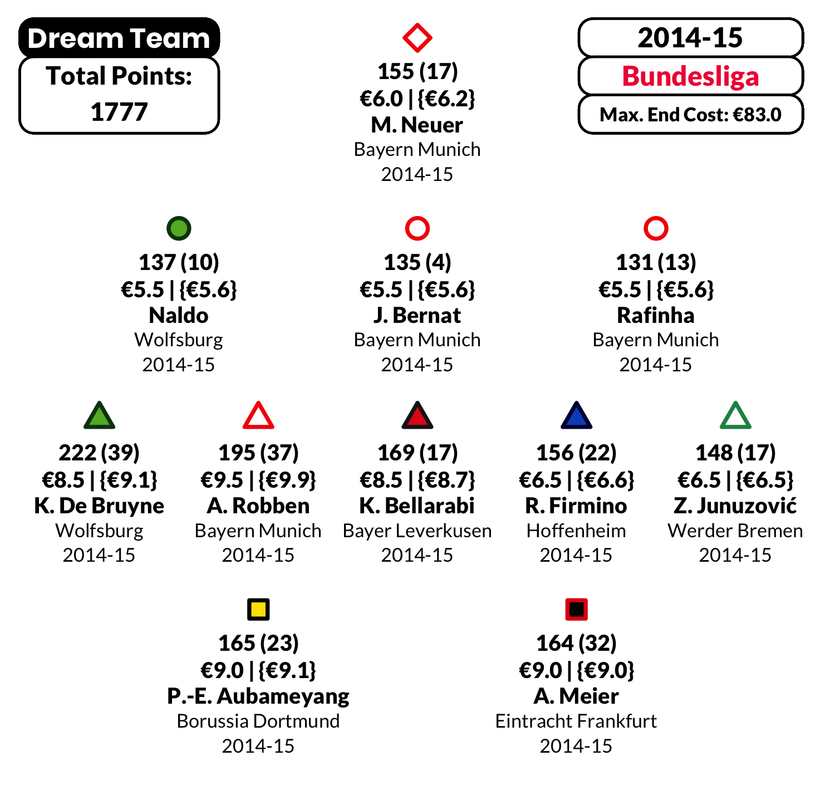
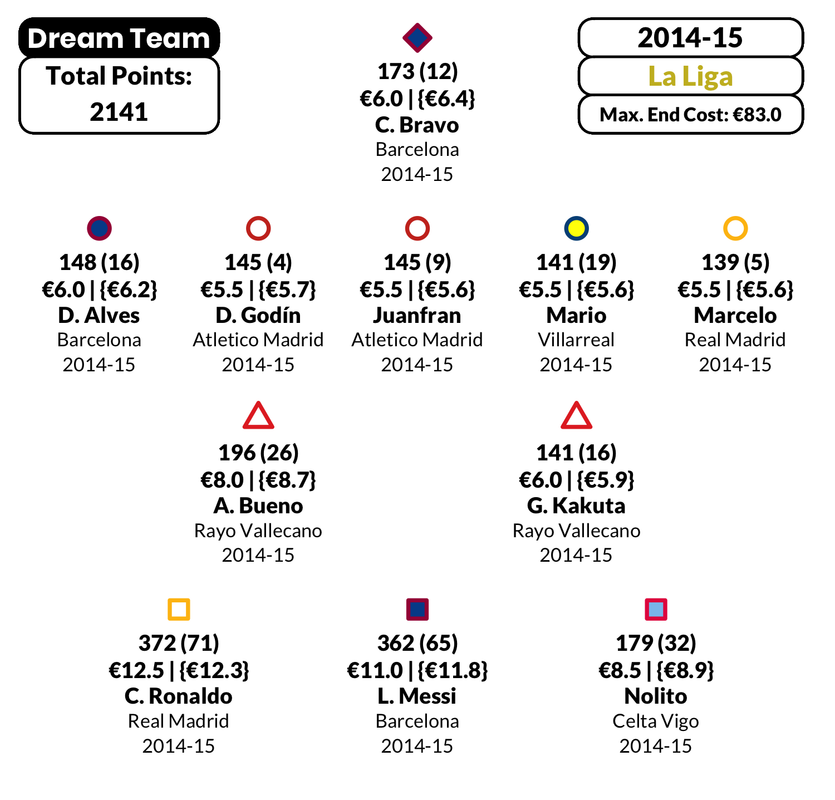
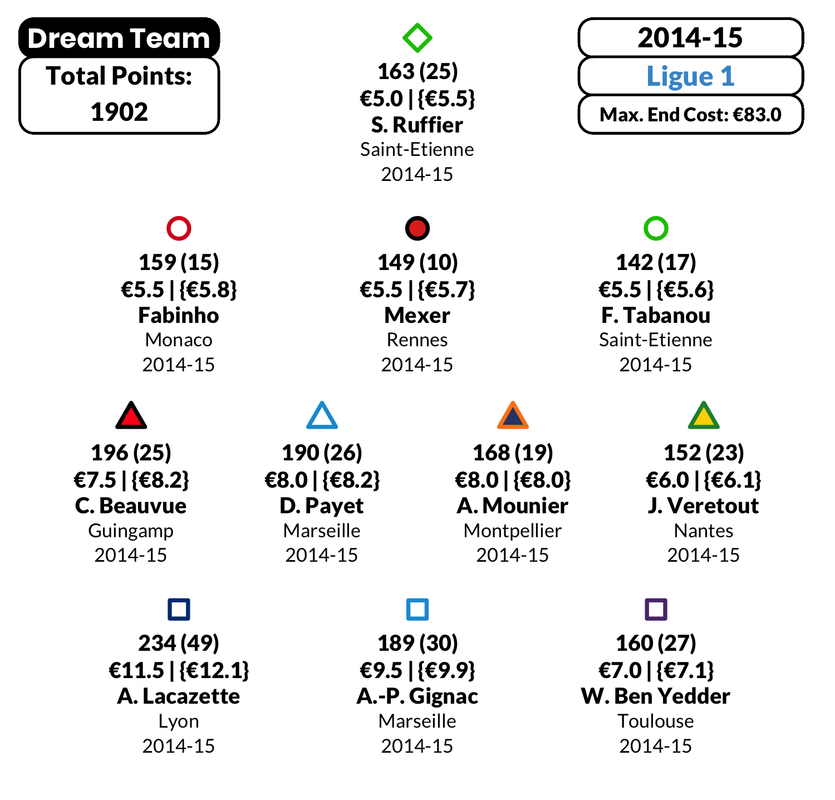
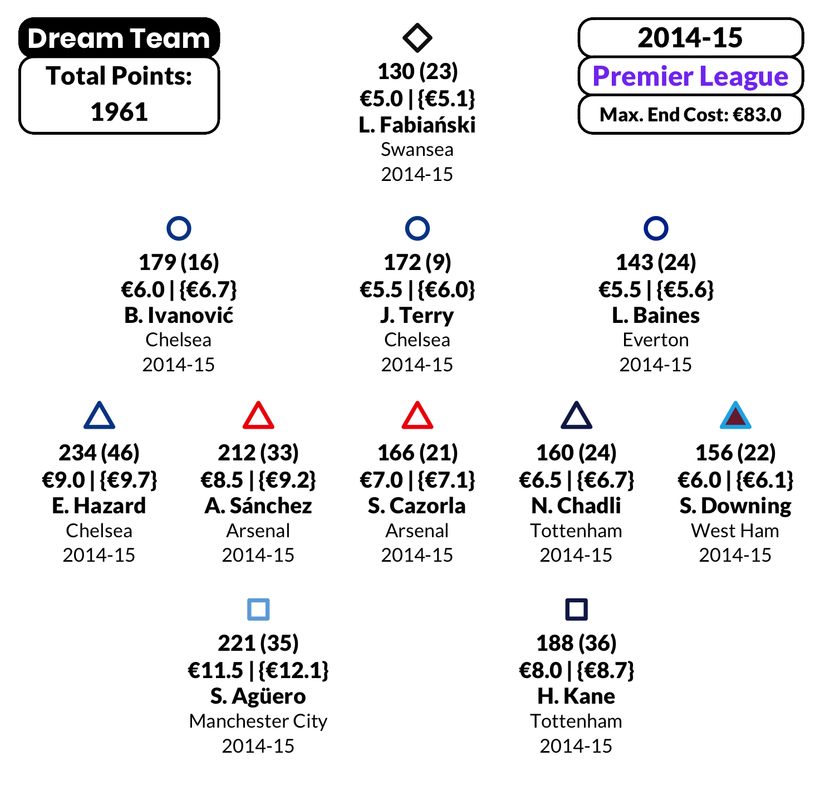
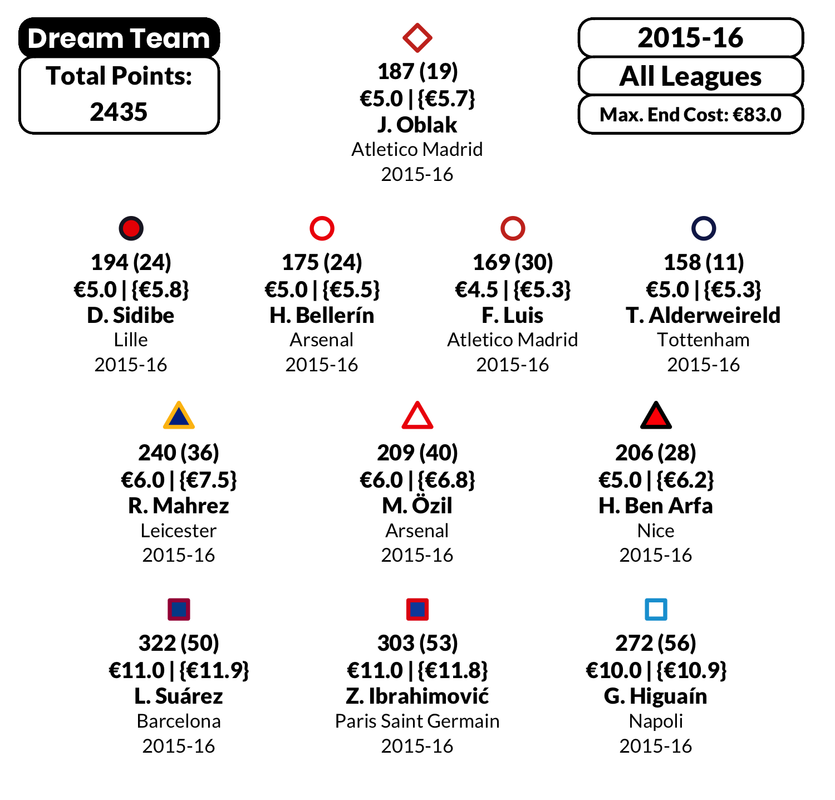
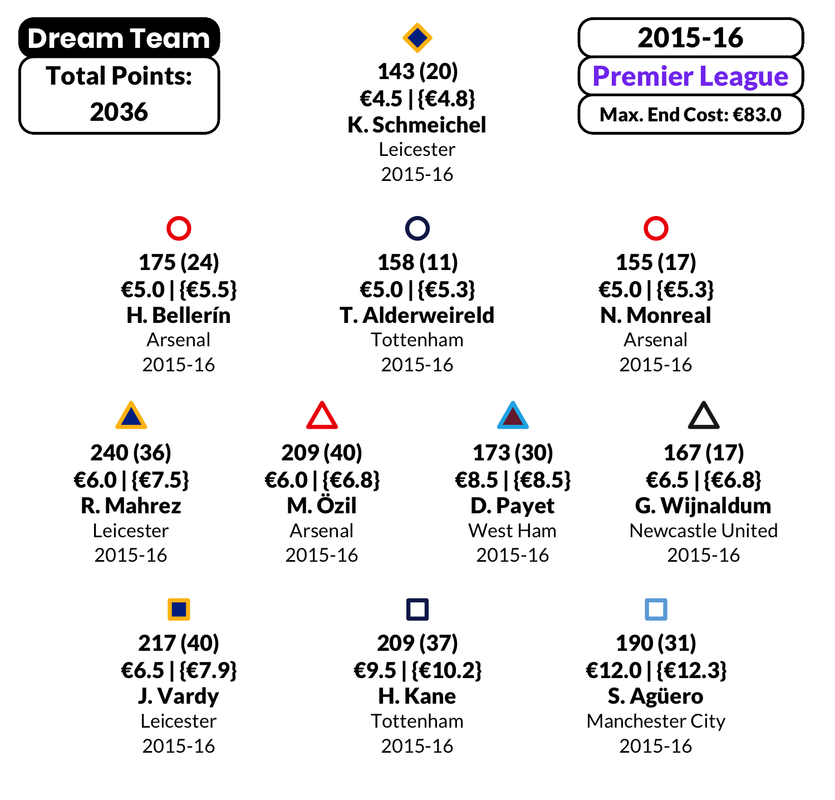
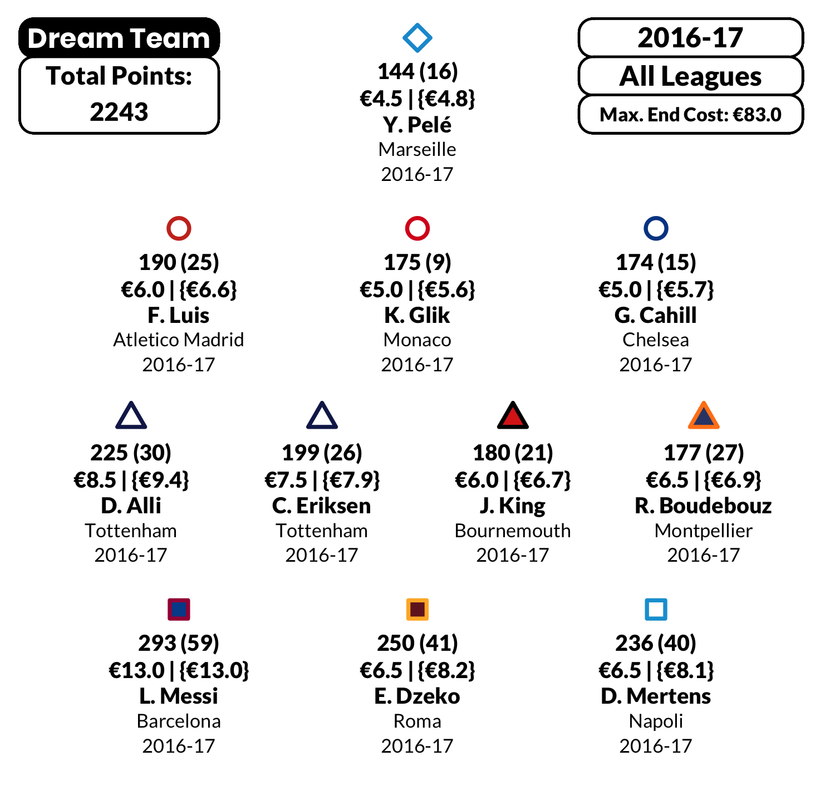
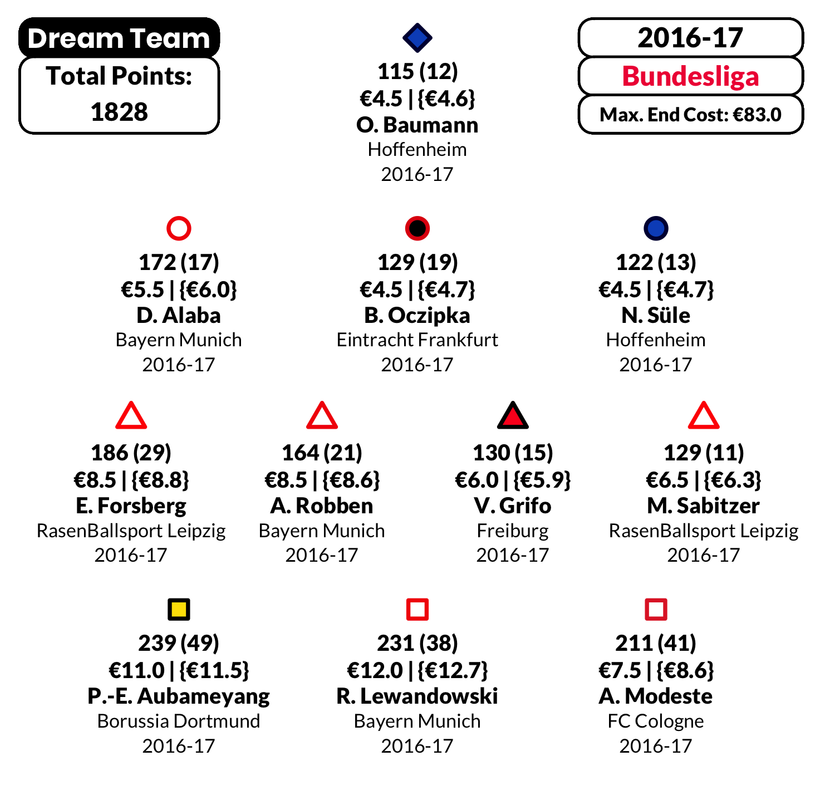
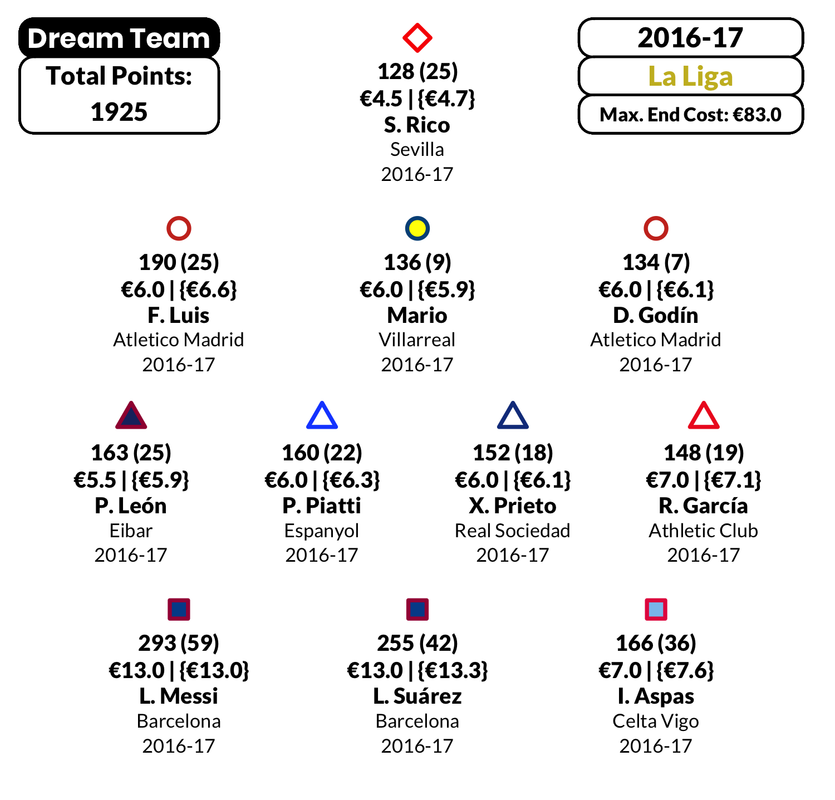
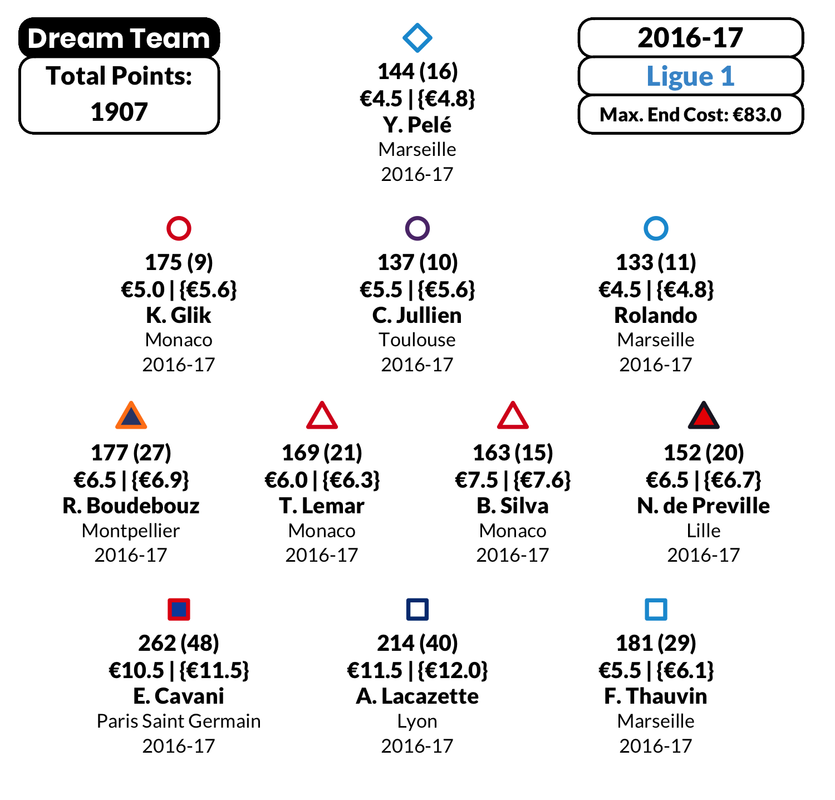
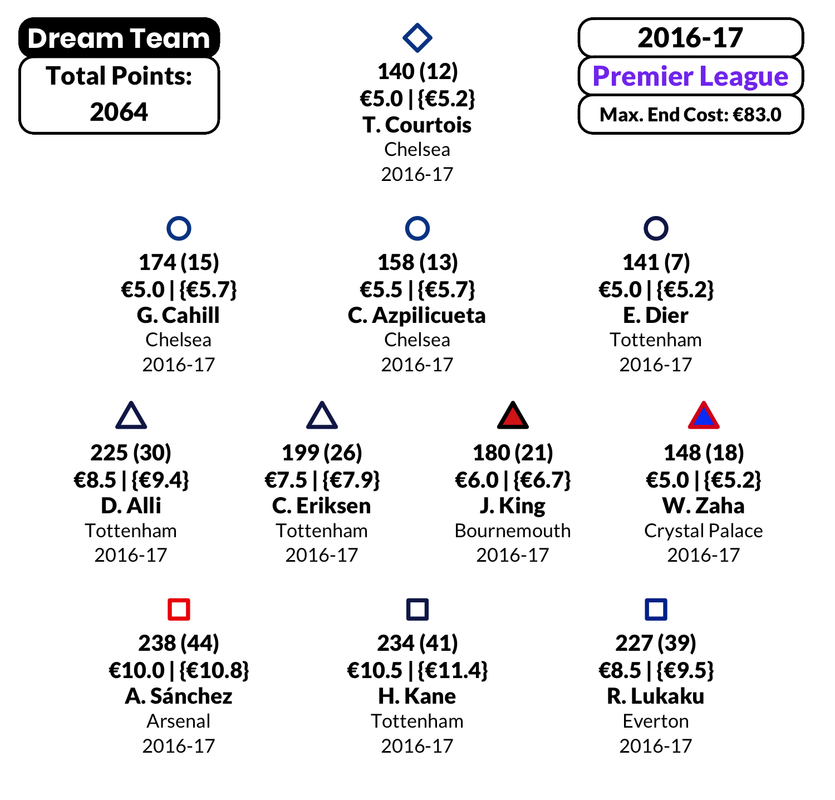
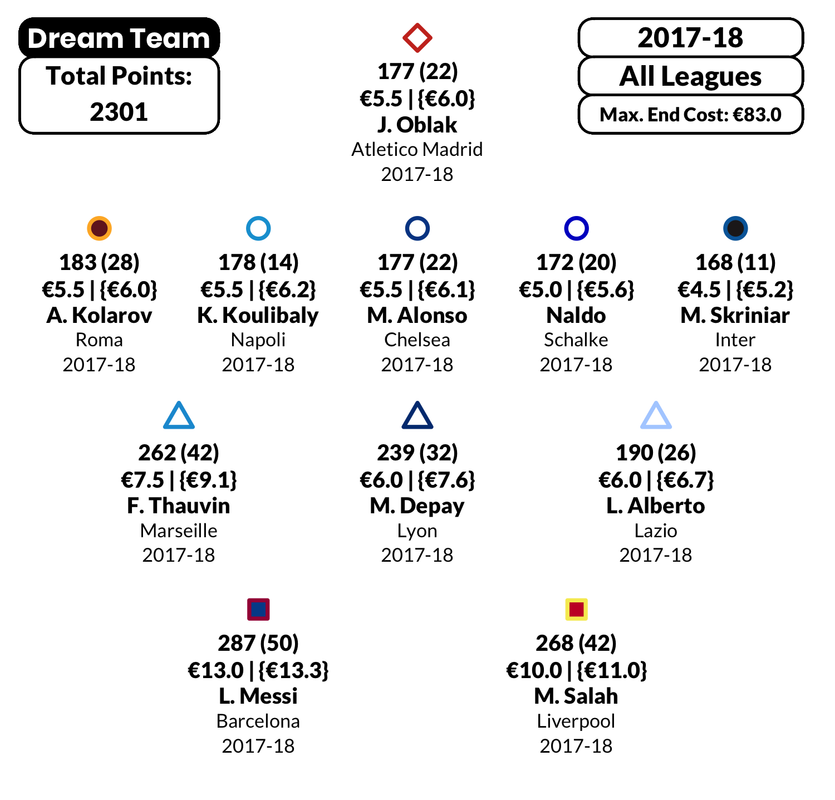
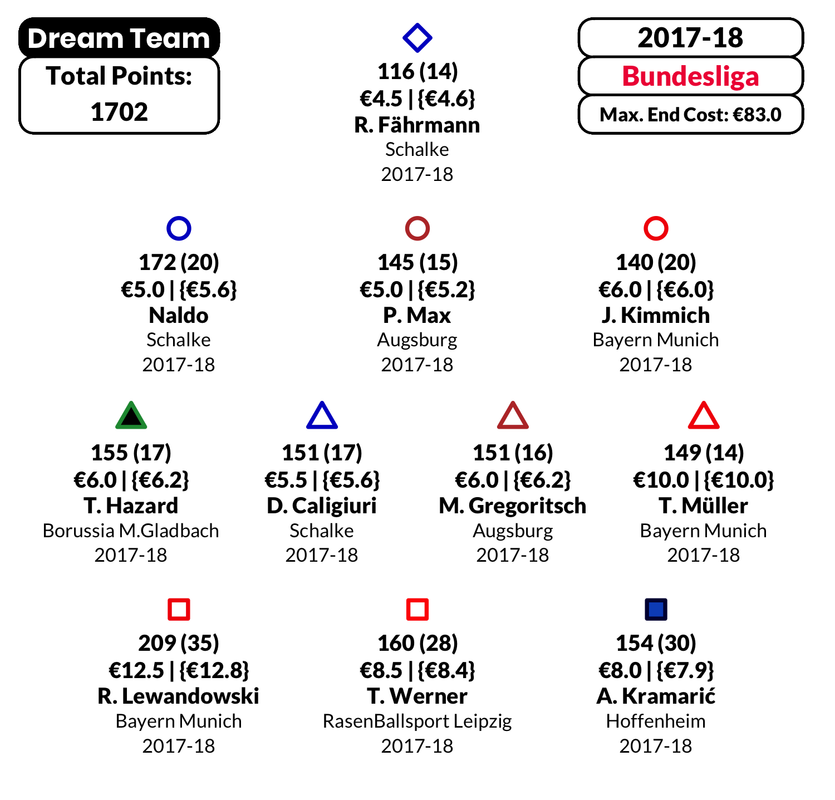
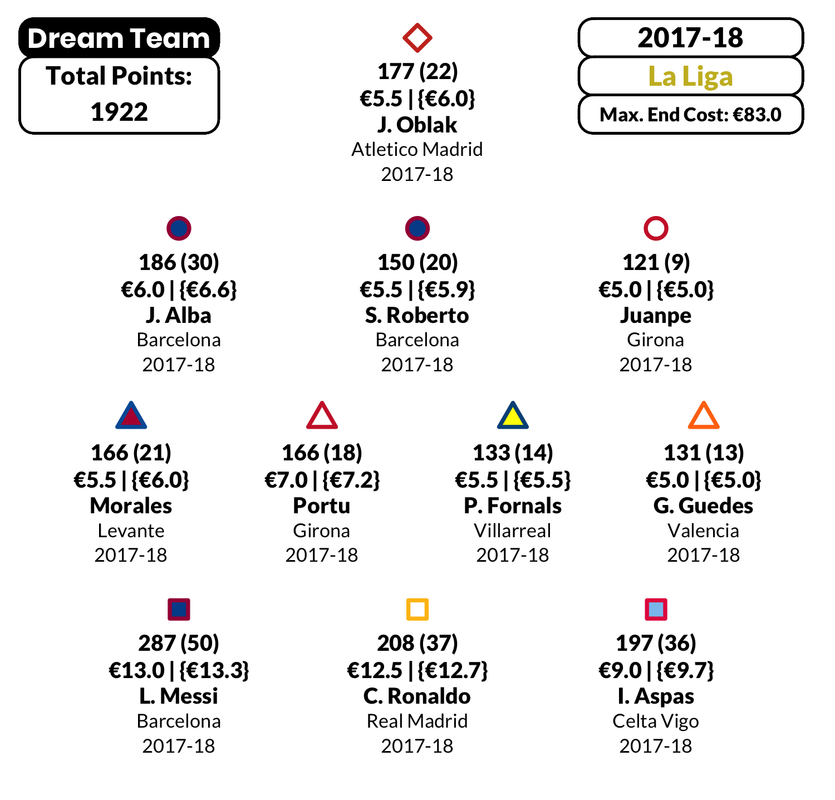
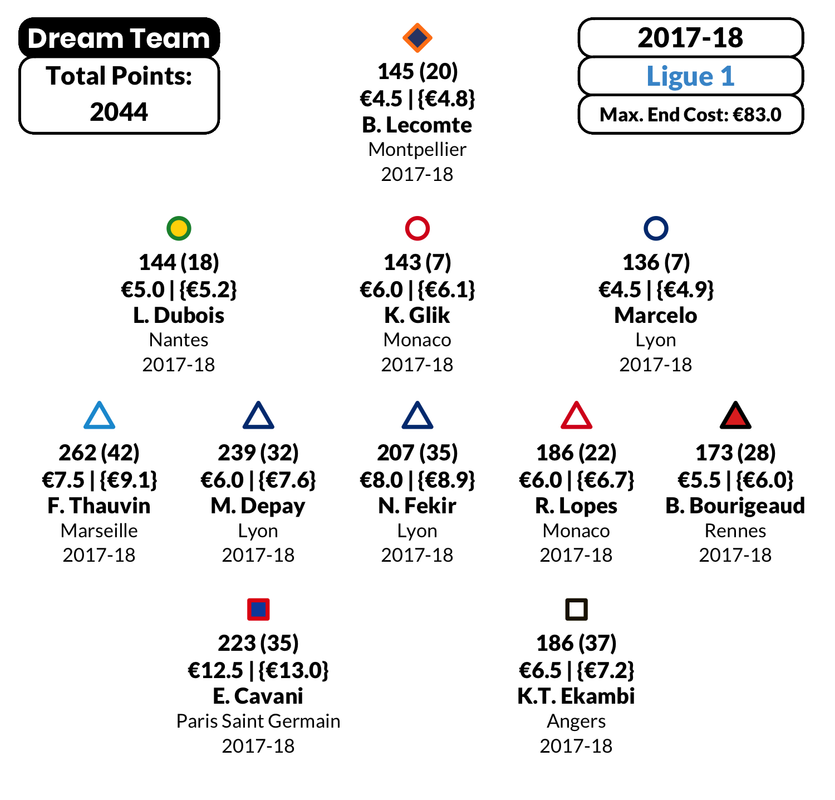
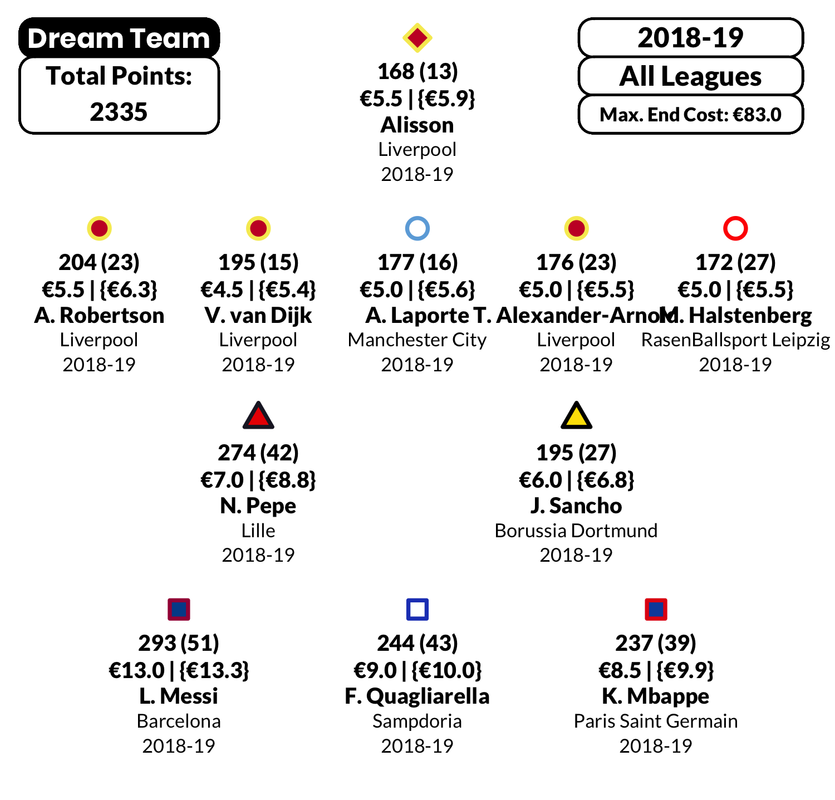
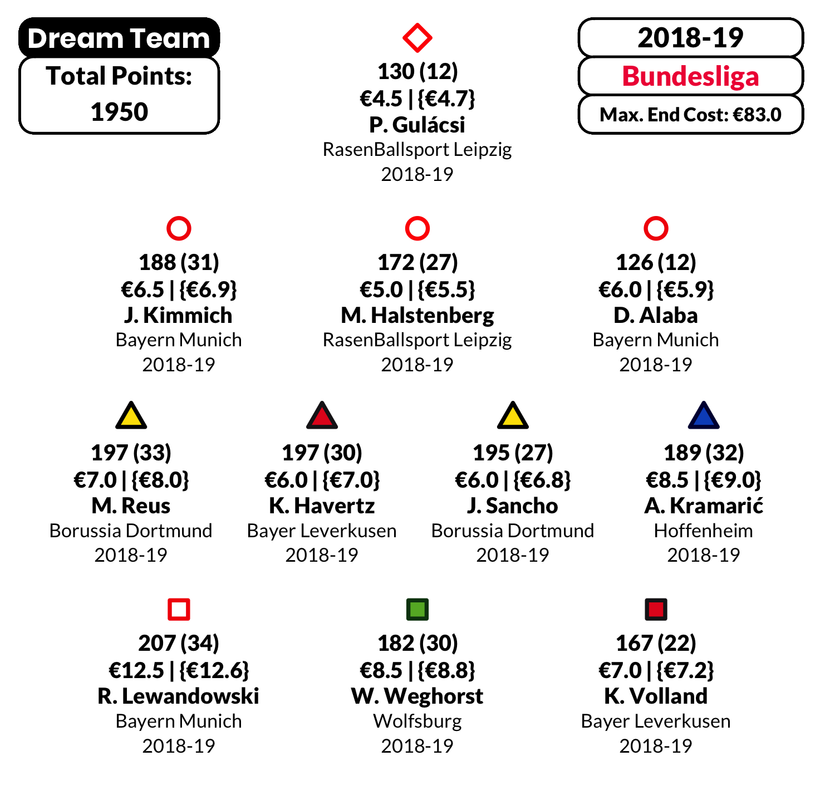
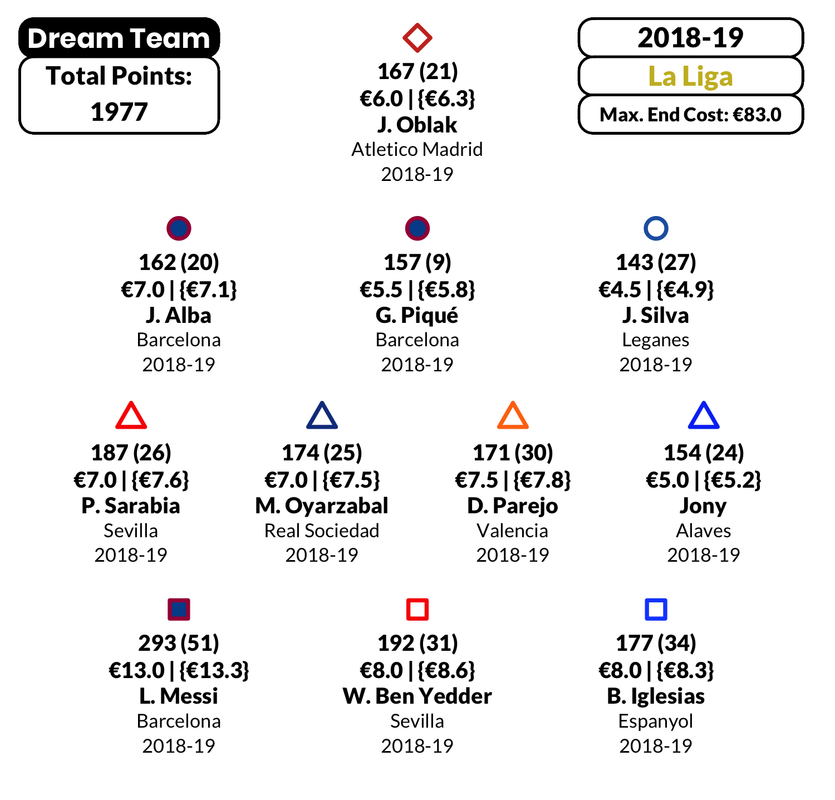
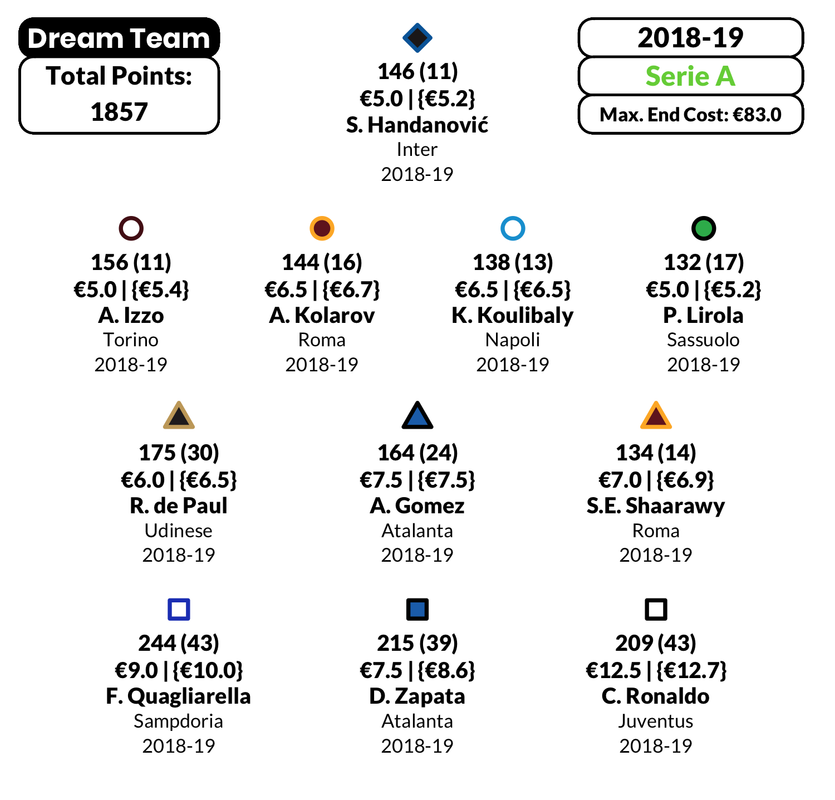
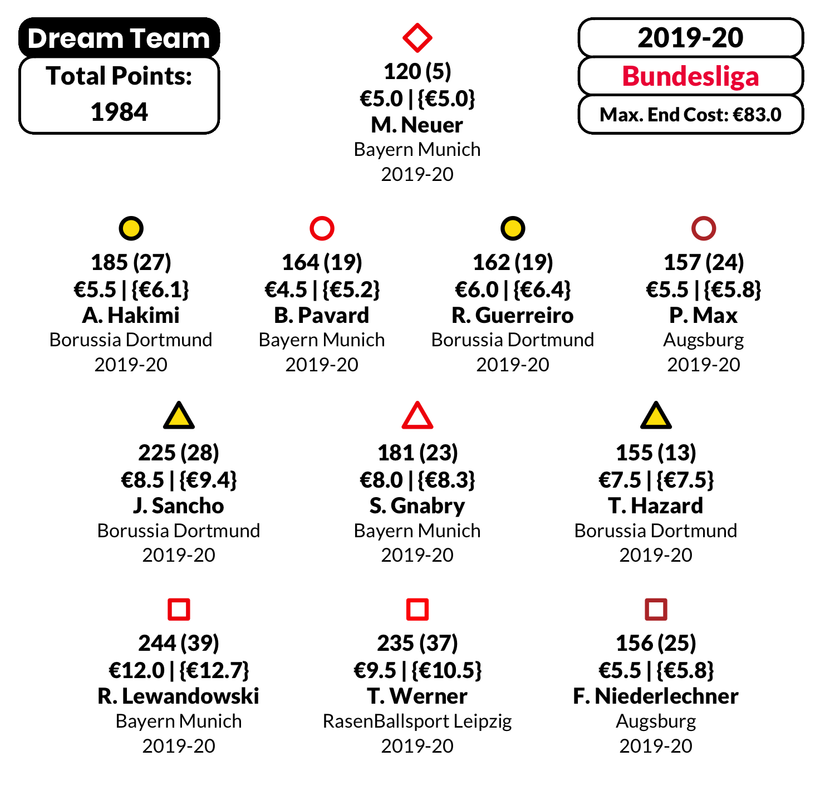
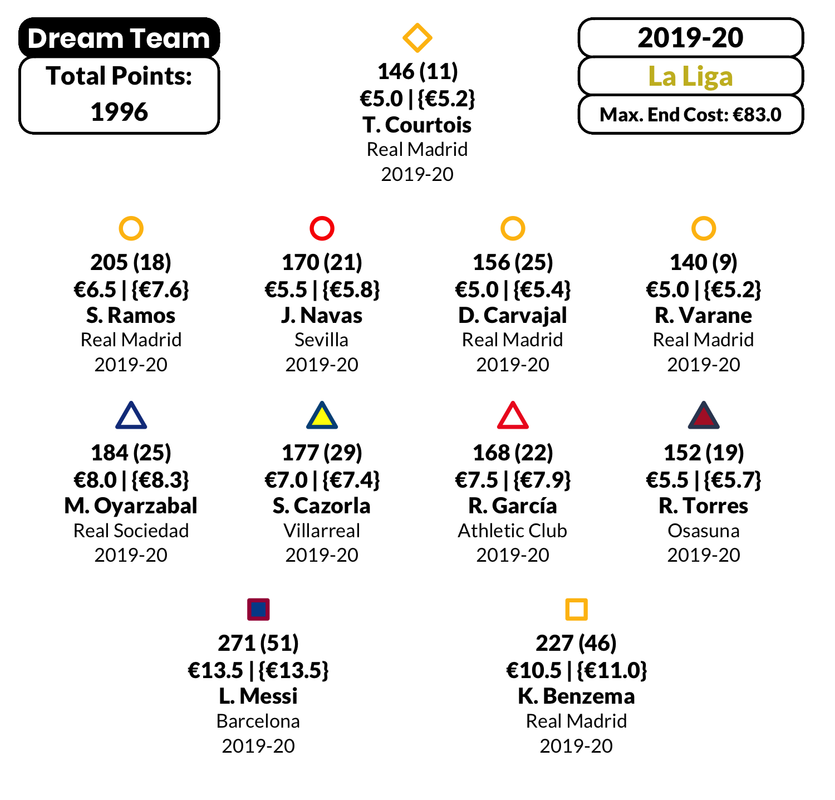
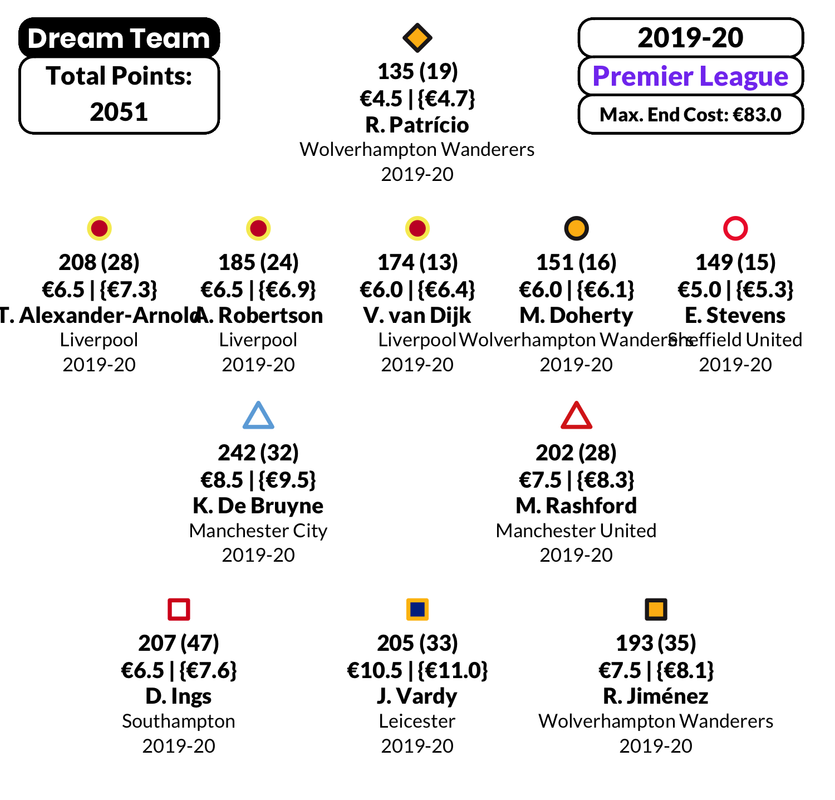
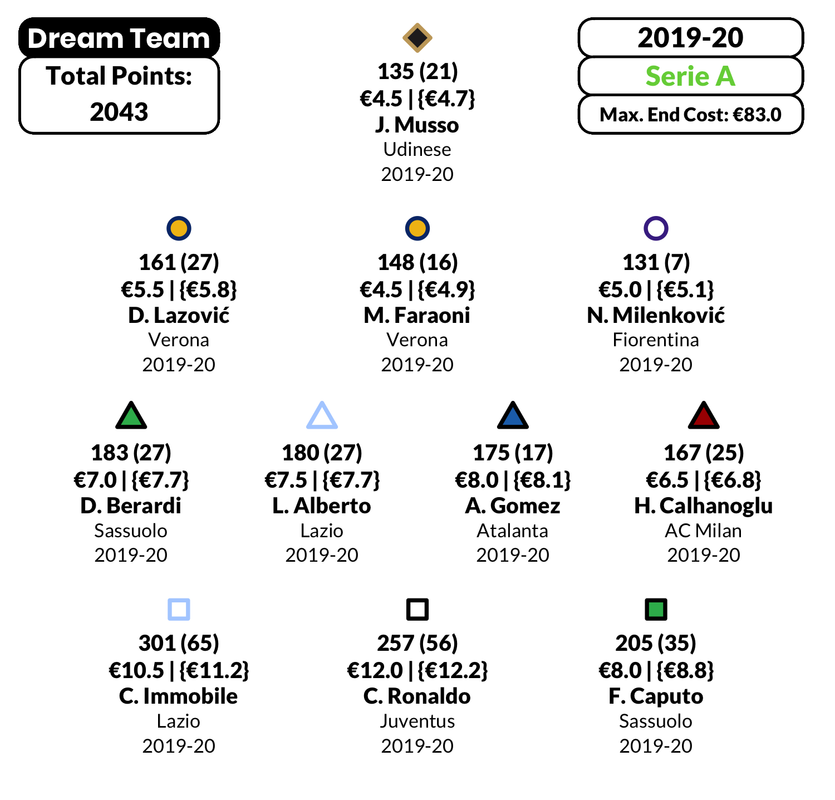
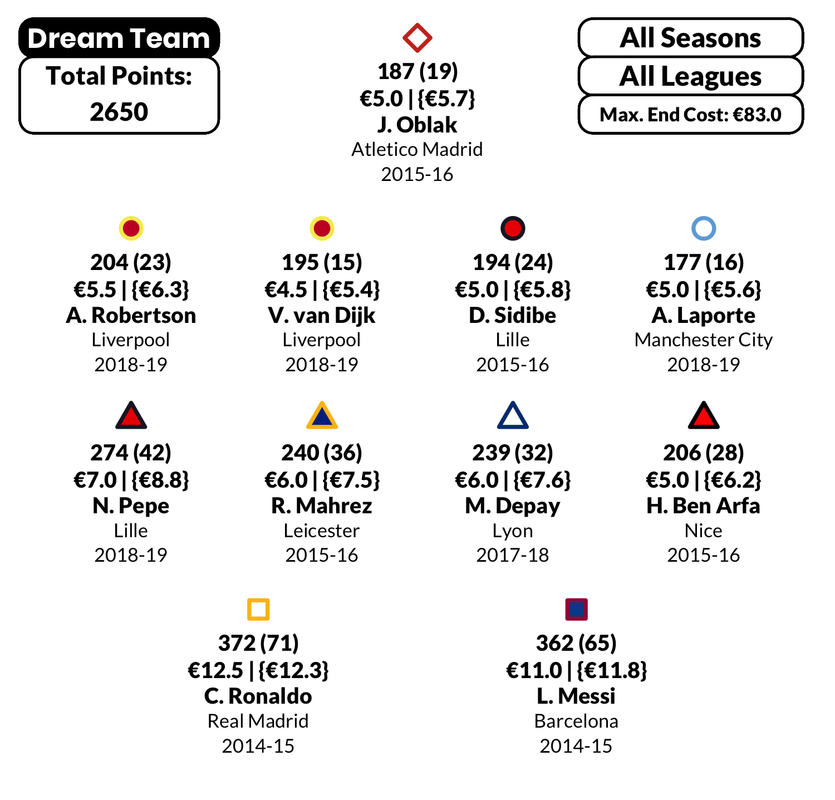
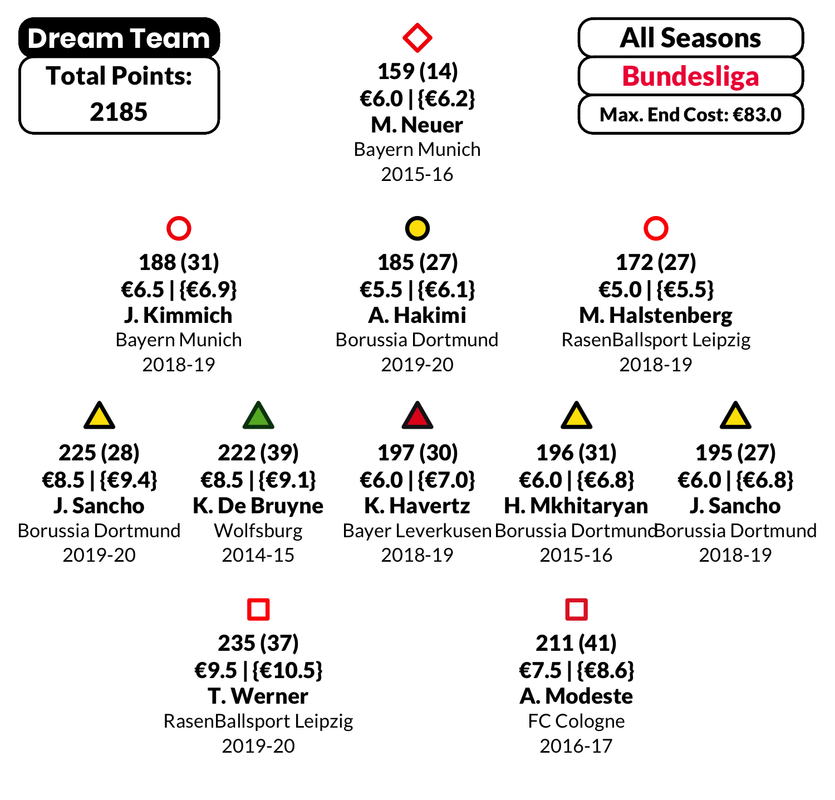
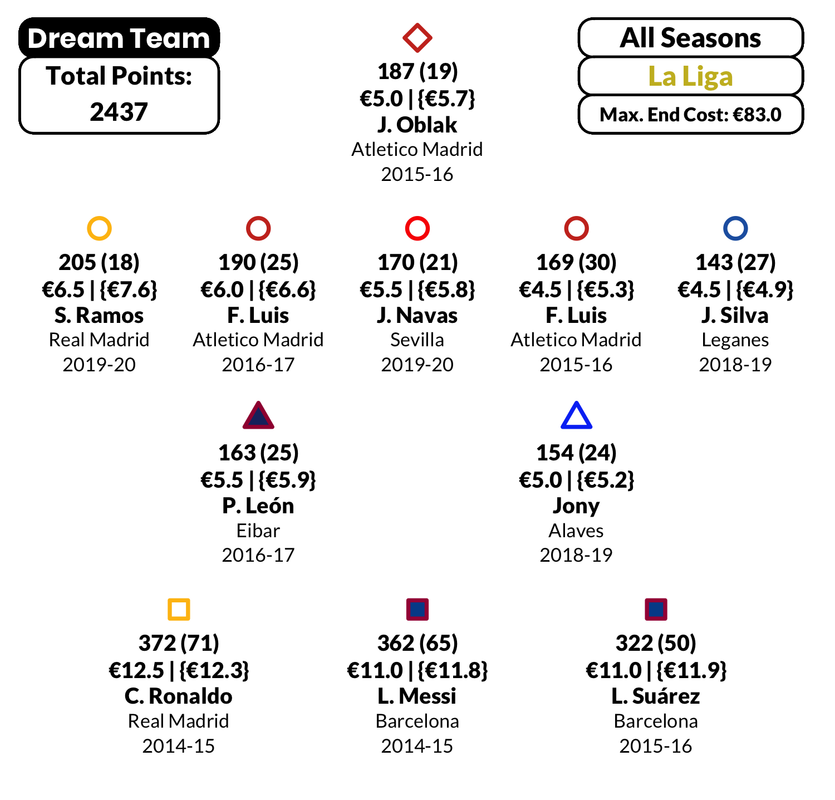
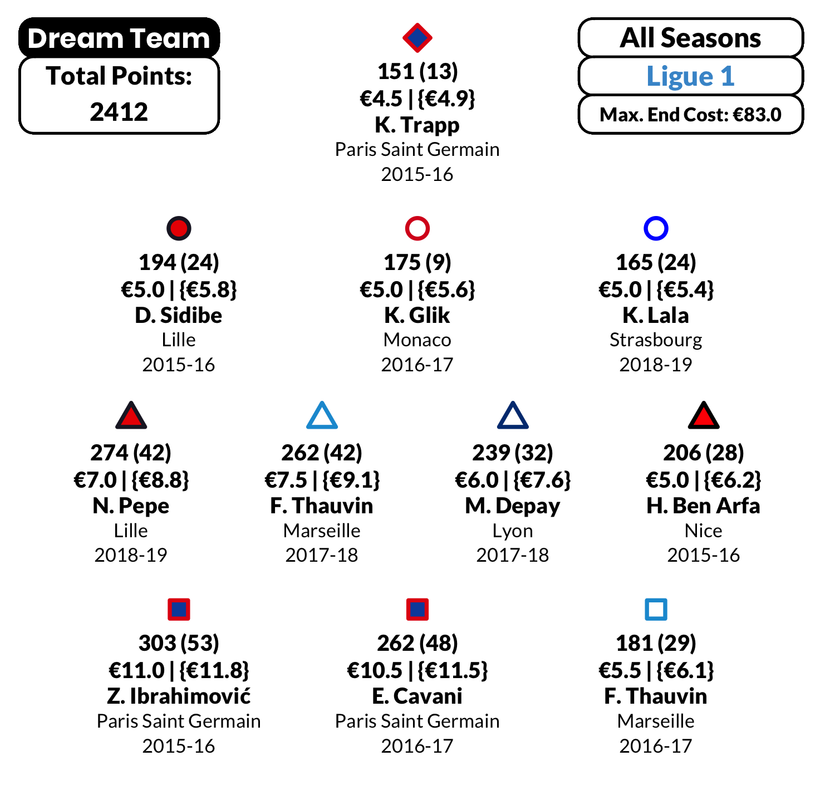
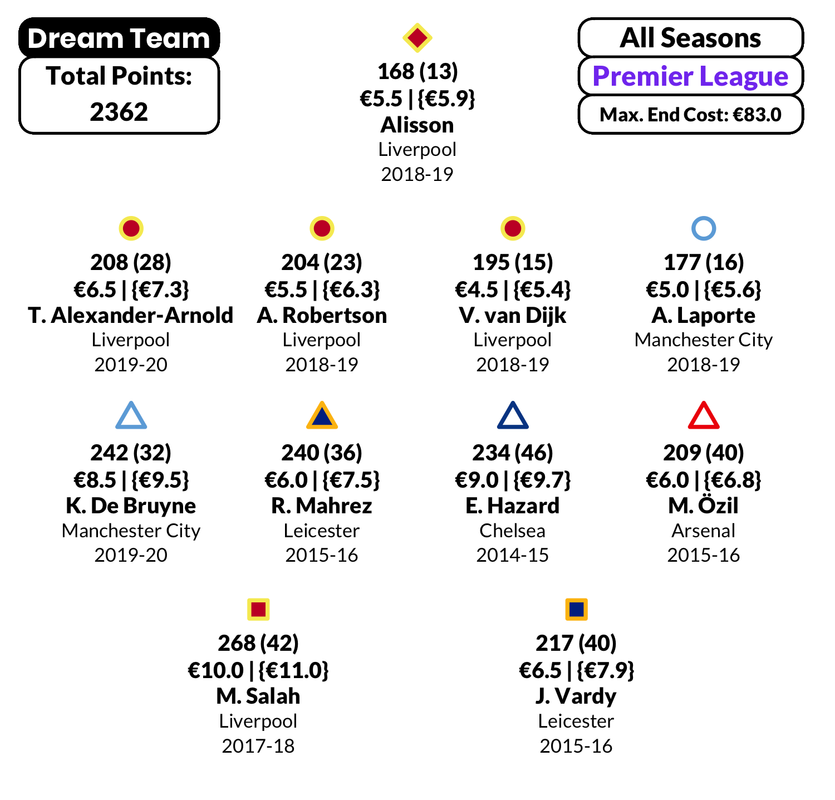
The tables below contain images of the "dream teams" (i.e., teams that score the maximum possible points) for all the seasons of all the leagues examined in the spreadsheet. These work similarly to the FPL overall dream team. Each value in the table below is the total points scored by that dream team. Each player's total points and bonus points (in parentheses) are displayed, as well as their starting and ending costs.
I've listed 3 types of dream teams for each season/league. First, a dream team where the price of the players selected doesn't matter — we're only looking to maximize points scored (this is how the FPL dream teams work). Second, a dream team where the total starting cost of all the players selected is no more than €83.0 (since €17.0 is required to afford the cheapest possible bench players). Third, a dream team where the total ending cost of all the players selected is no more than €83.0. I think it's interesting to see the variations across all the leagues and seasons.
| All Leagues | Bundesliga | La Liga | Ligue 1 | Premier League | Serie A | |
|---|---|---|---|---|---|---|
| 2014-15 | 2517 | 1791 | 2228 | 1938 | 1998 | 1845 |
| 2015-16 | 2503 | 1885 | 2204 | 1992 | 2036 | 1947 |
| 2016-17 | 2319 | 1836 | 1973 | 1907 | 2133 | 2046 |
| 2017-18 | 2451 | 1702 | 1955 | 2049 | 2113 | 2100 |
| 2018-19 | 2392 | 1953 | 2005 | 2014 | 2112 | 1858 |
| 2019-20 | 2446 | 2031 | 2047 | 1464 | 2084 | 2058 |
| All Seasons | 2878 | 2279 | 2577 | 2482 | 2463 | 2343 |
| All Leagues | Bundesliga | La Liga | Ligue 1 | Premier League | Serie A | |
|---|---|---|---|---|---|---|
| 2014-15 | 2403 | 1788 | 2186 | 1932 | 1998 | 1845 |
| 2015-16 | 2503 | 1885 | 2154 | 1992 | 2036 | 1947 |
| 2016-17 | 2314 | 1828 | 1940 | 1907 | 2133 | 2046 |
| 2017-18 | 2425 | 1702 | 1944 | 2049 | 2096 | 2100 |
| 2018-19 | 2392 | 1953 | 2005 | 2014 | 2112 | 1858 |
| 2019-20 | 2358 | 2029 | 2047 | 1464 | 2082 | 2058 |
| All Seasons | 2865 | 2246 | 2546 | 2482 | 2449 | 2336 |
| All Leagues | Bundesliga | La Liga | Ligue 1 | Premier League | Serie A | |
|---|---|---|---|---|---|---|
| 2014-15 | 2298 | 1777 | 2141 | 1902 | 1961 | 1845 |
| 2015-16 | 2435 | 1885 | 2123 | 1992 | 2036 | 1944 |
| 2016-17 | 2243 | 1828 | 1925 | 1907 | 2064 | 2046 |
| 2017-18 | 2301 | 1702 | 1922 | 2044 | 2017 | 2076 |
| 2018-19 | 2335 | 1950 | 1977 | 2014 | 2098 | 1857 |
| 2019-20 | 2247 | 1984 | 1996 | 1464 | 2051 | 2043 |
| All Seasons | 2650 | 2185 | 2437 | 2412 | 2362 | 2273 |
Thanks for reading! Hope you enjoyed browsing the spreadsheet. Let me know if you have any questions.