-
-
Save rajagurunath/2efcfd39ef7843ed339b395ef9e35ddb to your computer and use it in GitHub Desktop.
| import pandas as pd | |
| import path | |
| import matplotlib.pyplot as plt | |
| import matplotlib.dates as mdates | |
| import argparse | |
| plt.style.use("seaborn-poster") | |
| DATA_DIR=path.Path(r"D:\experiments\data\Capstone_proj") | |
| dataset_lookup={ | |
| 'sbi':'sbi.csv', | |
| 'infosys':'infosys.csv', | |
| 'tcs':'tcs.csv', | |
| 'usd_inr':'USD INR Historical Data - Investing.com India.csv' | |
| } | |
| four_columns=['Open Price', 'High Price', 'Low Price', 'Close Price'] | |
| colors=['r','b','g','black'] | |
| def read_data(dataset_name): | |
| dataset_name=dataset_lookup.get(dataset_name) | |
| df=pd.read_csv(DATA_DIR+"\\{}".format(dataset_name)) | |
| df.set_index(pd.to_datetime(df['Date']),inplace=True) | |
| df.sort_index(inplace=True) | |
| return df | |
| def make_chart(df,name='SBI',sub_name='total_range',plot_type=None): | |
| years = mdates.YearLocator() # every year | |
| months = mdates.MonthLocator() # every month | |
| years_fmt = mdates.DateFormatter('%Y-%m') | |
| #after sorting and set index | |
| fig, ax = plt.subplots(nrows=2, ncols=2, figsize=(20,15)) | |
| col_count=0 | |
| for i in [0,1]: | |
| for j in [0,1]: | |
| #print("col",four_columns[col_count]) | |
| if plot_type=='boxplot': | |
| ax[i][j].boxplot(df[four_columns[col_count]]) | |
| elif plot_type=='line': | |
| ax[i][j].plot(df.index,df[four_columns[col_count]],color=colors[col_count]) | |
| elif plot_type=='hist': | |
| ax[i][j].hist(df[four_columns[col_count]],color=colors[col_count]) | |
| ax[i][j].spines['top'].set_visible(False) | |
| ax[i][j].spines['right'].set_visible(False) | |
| ax[i][j].xaxis.set_tick_params(top='off', direction='out', width=1) | |
| ax[i][j].yaxis.set_tick_params(right='off', direction='out', width=1) | |
| ax[i][j].set_title(four_columns[col_count]) | |
| ax[i][j].set_xlabel("DATE RANGE") | |
| ax[i][j].set_ylabel(four_columns[col_count]) | |
| ax[i][j].xaxis.set_major_locator(years) | |
| ax[i][j].xaxis.set_major_formatter(years_fmt) | |
| ax[i][j].xaxis.set_minor_locator(months) | |
| col_count+=1 | |
| fig.suptitle('{}-{}'.format(name.upper(),sub_name), fontsize=35) | |
| fig.tight_layout() | |
| fig.savefig('{}_{}.png'.format(name,sub_name), bbox_inches='tight') | |
| def total_range(df,name,plot_type): | |
| make_chart(df,name,"total_range",plot_type) | |
| def monthly(df,name,plot_type): | |
| df2=df.resample('M').sum() | |
| make_chart(df2,name,"montly",plot_type) | |
| def quaterly(df,name,plot_type): | |
| df2=df.resample('Q').sum() | |
| make_chart(df2,name,"Quaterly",plot_type) | |
| def weekly(df,name,plot_type): | |
| df2=df.resample('w').sum() | |
| make_chart(df2,name,'weekly',plot_type) | |
| def custom_dates(df,from_date,to_date,name,plot_type): | |
| df2=df[(df.index>=from_date)&(df.index<to_date)] | |
| make_chart(df2,name,"from {} to {}".format(from_date,to_date),plot_type) | |
| if __name__=="__main__": | |
| parser = argparse.ArgumentParser(description='helper functions for capstone project') | |
| parser.add_argument('--DATASET', type=str, help='choose one of the dataset: sbi ,infosys,tcs,usd_inr') | |
| parser.add_argument('--plot_type', type=str, help='choose the plot type : boxpot, line') | |
| parser.add_argument('--fromdate', type=int, | |
| help="custom start date") | |
| parser.add_argument('--todate', type=int, | |
| help='custom to date') | |
| args = parser.parse_args() | |
| dataset=args.DATASET | |
| fromdate=args.fromdate | |
| todate=args.todate | |
| plot_type=args.plot_type | |
| df=read_data(dataset) | |
| total_range(df,dataset,plot_type) | |
| weekly(df,dataset,plot_type) | |
| monthly(df,dataset,plot_type) | |
| quaterly(df,dataset,plot_type) | |
| # custom_dates(df,fromdate,todate,dataset) | |
| custom_dates(df,"2018-05","2018-11",dataset,plot_type) | |
| custom_dates(df,"2017-01","2018-01",dataset,plot_type) | |
rajagurunath
commented
Aug 21, 2019
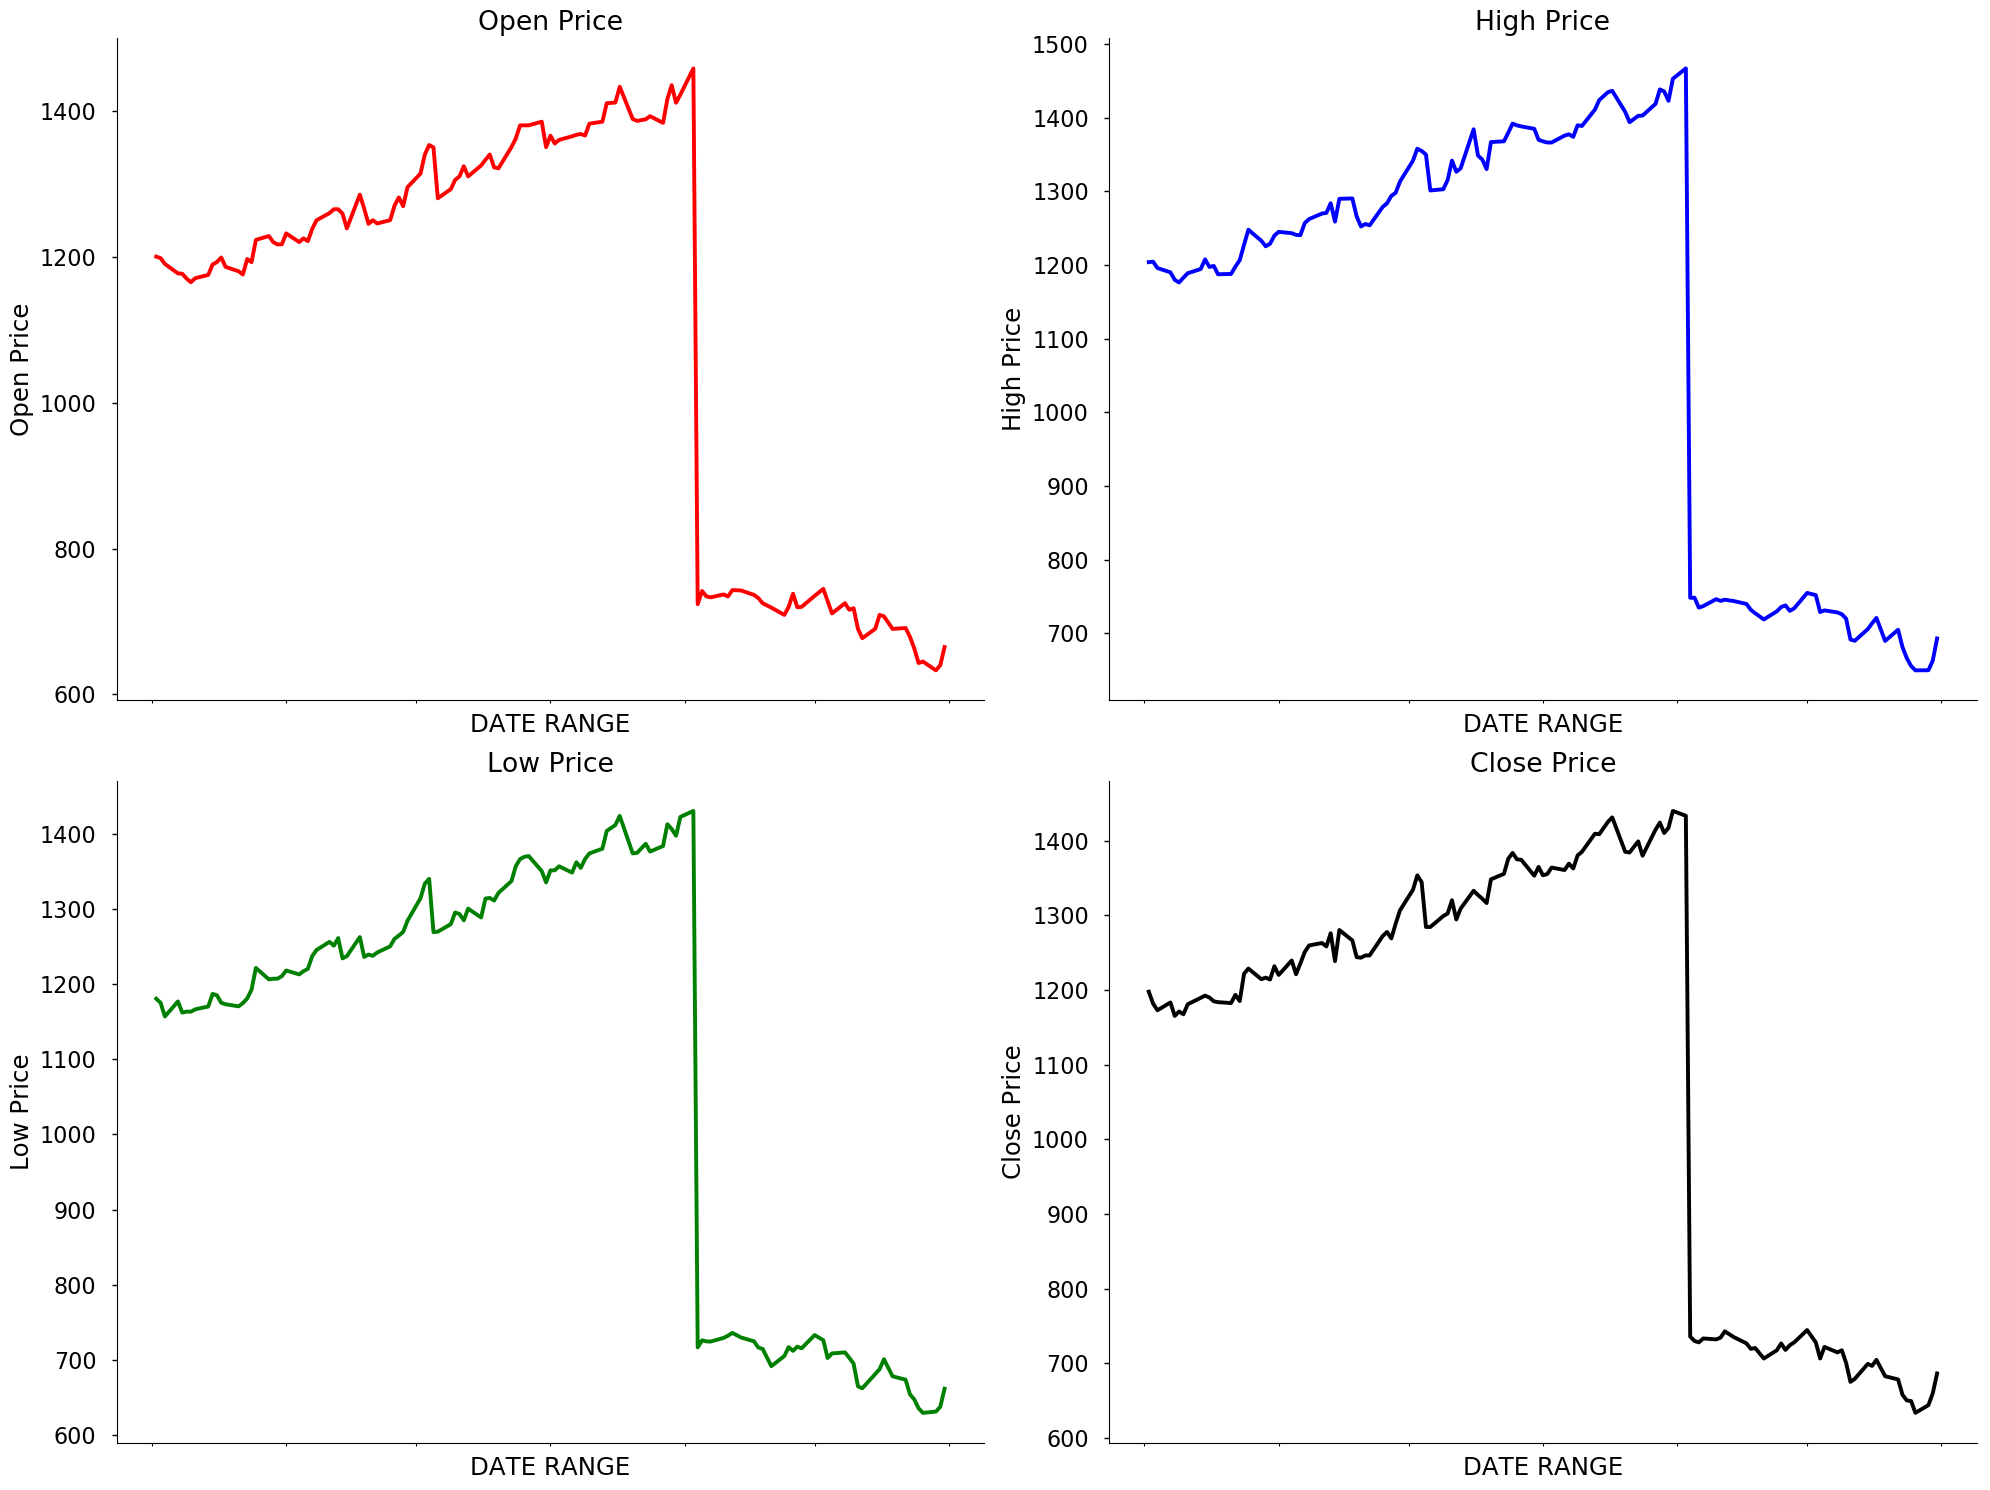
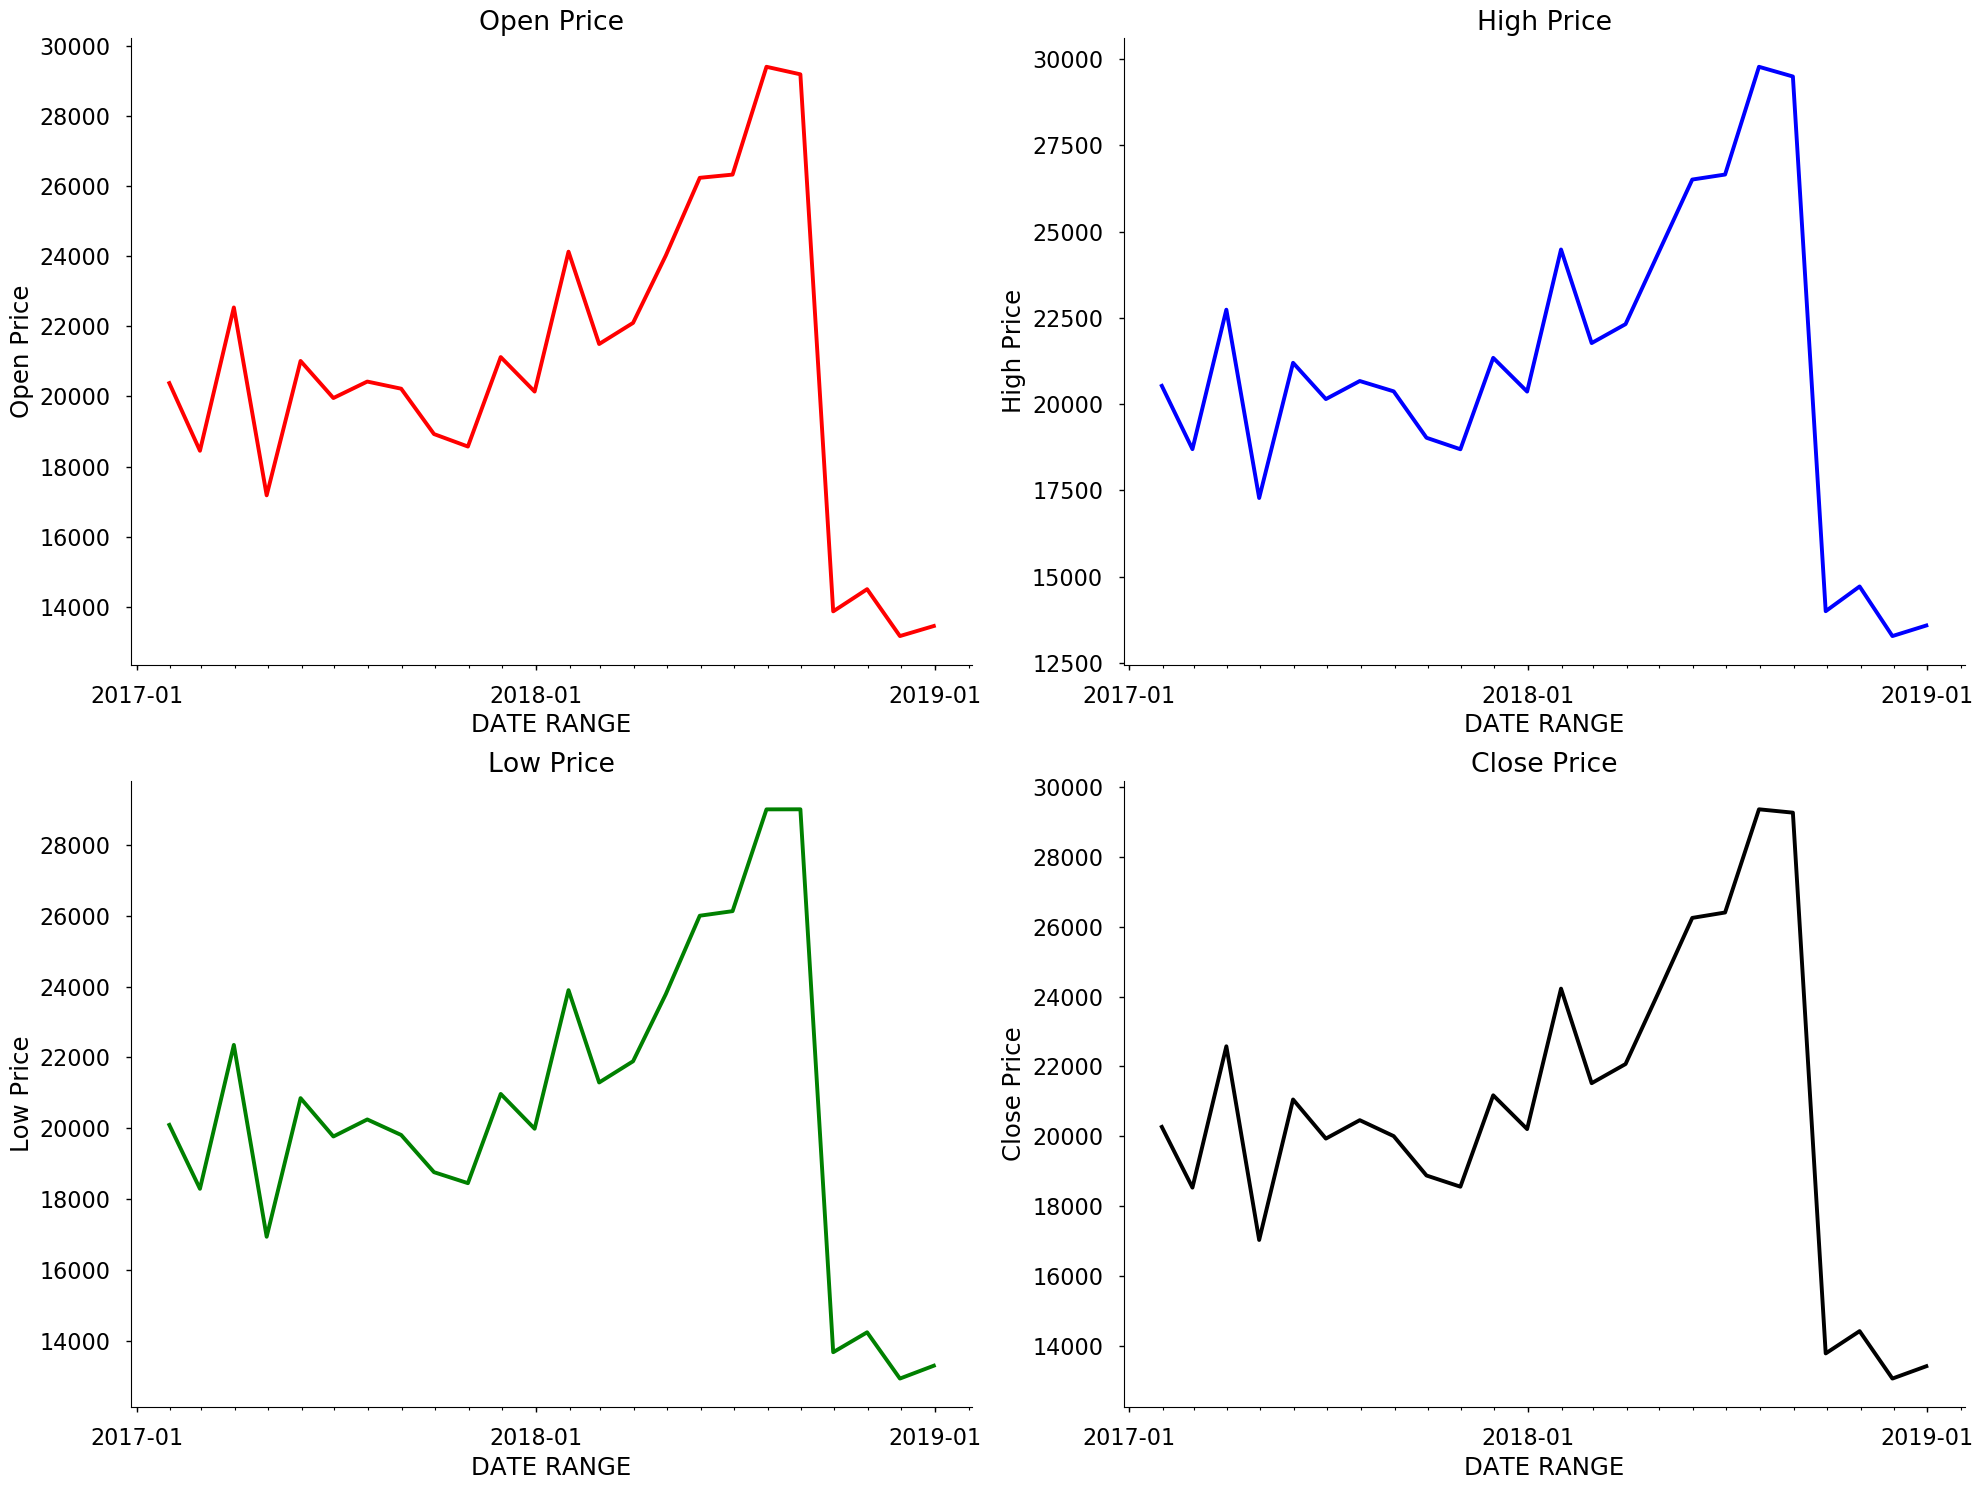
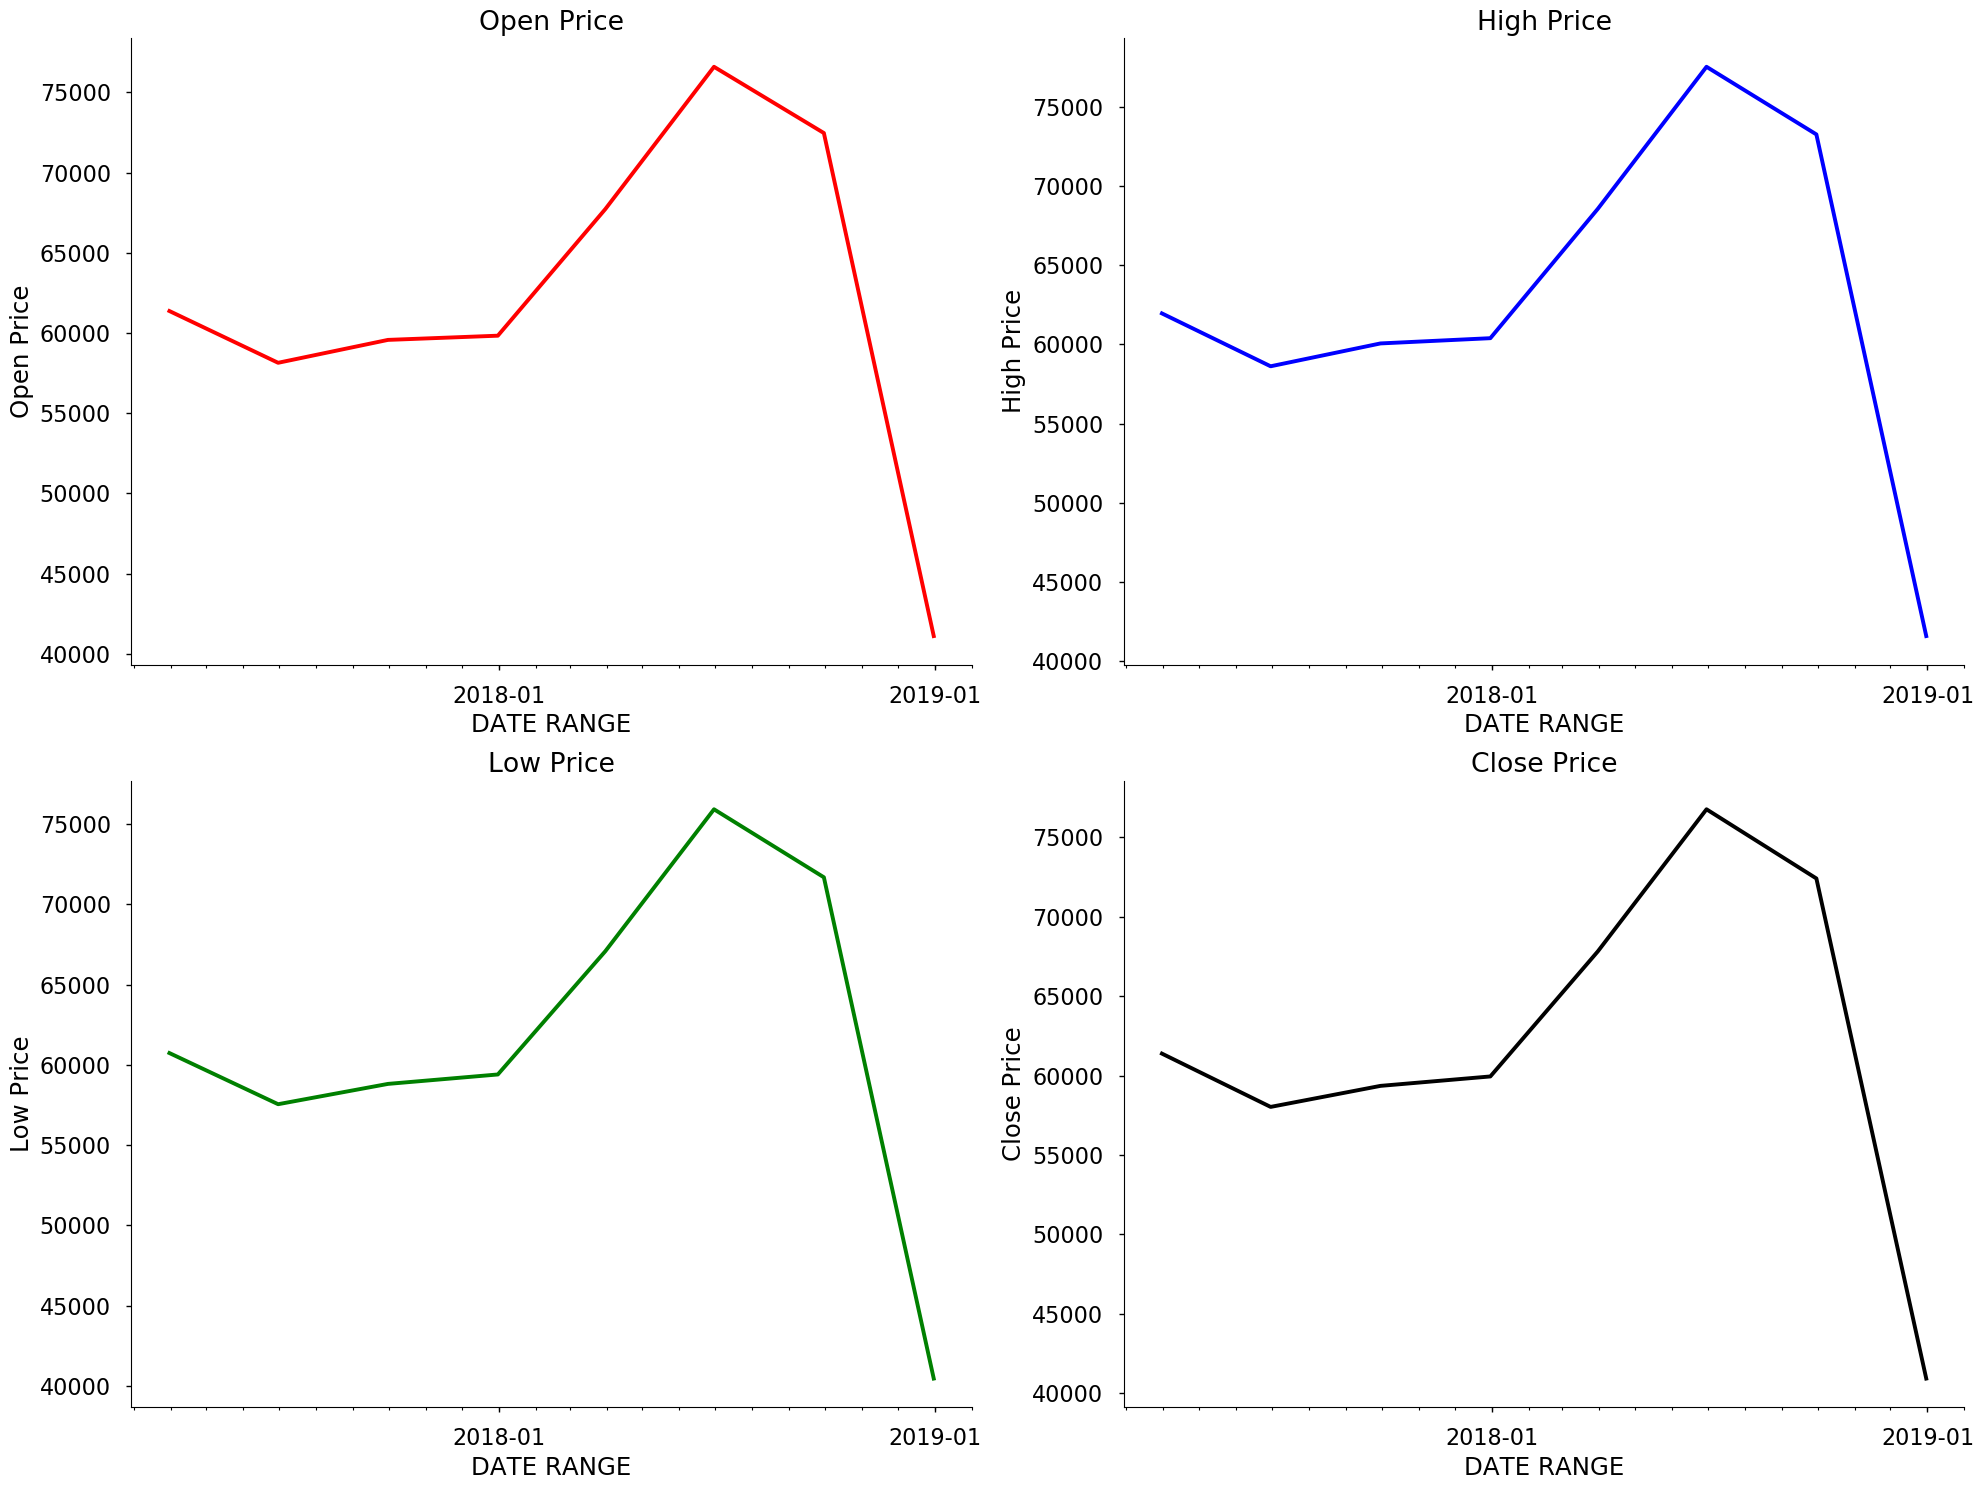
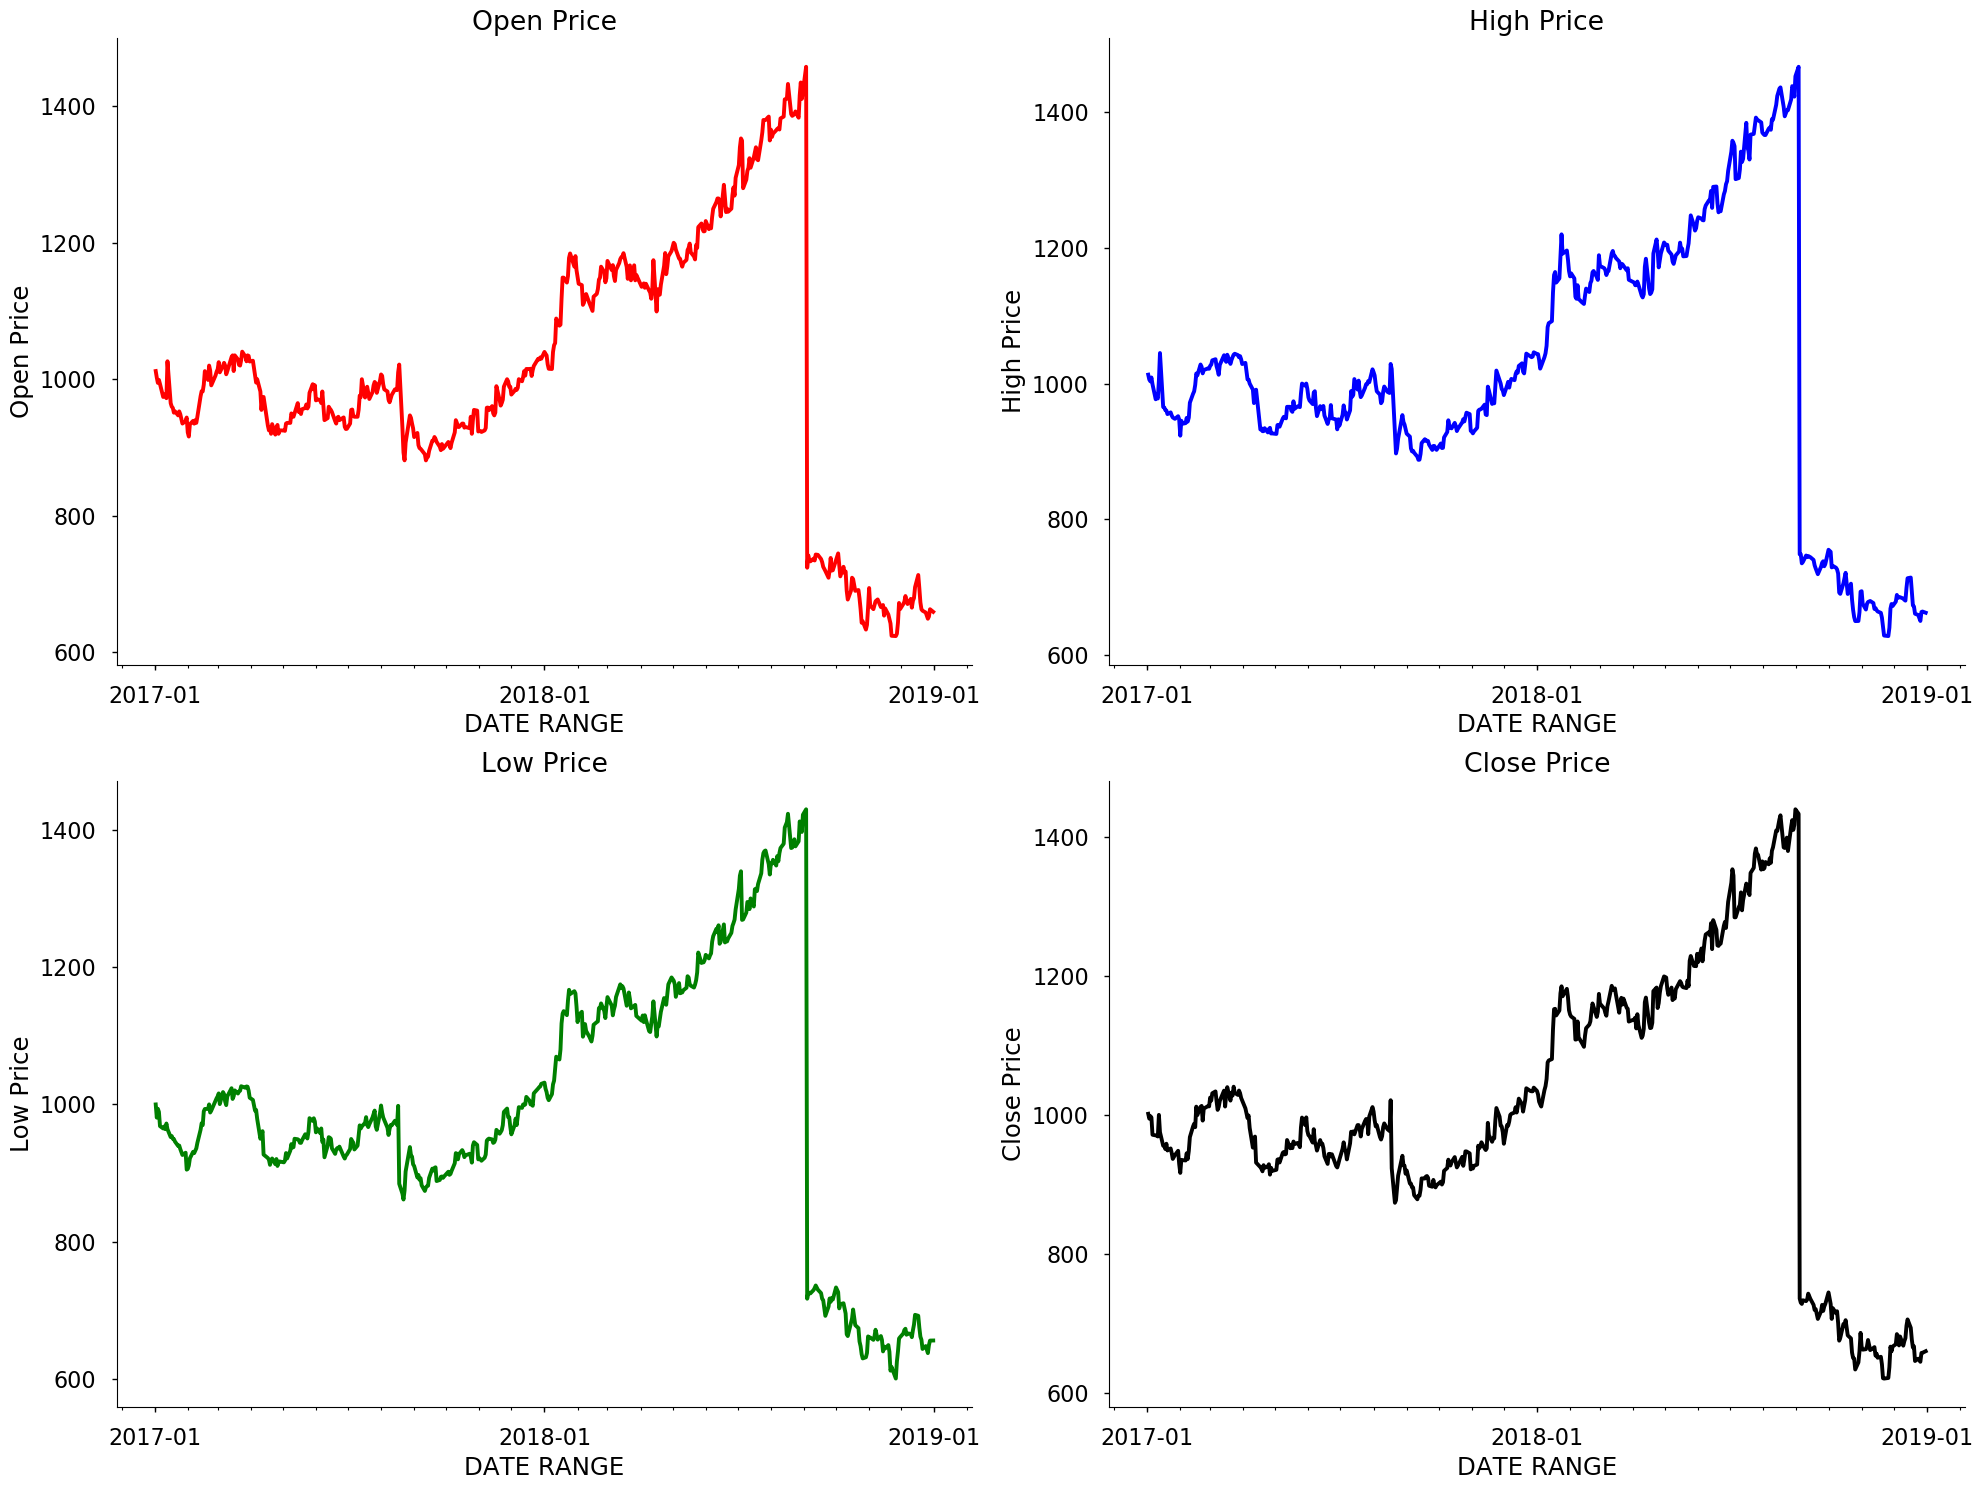
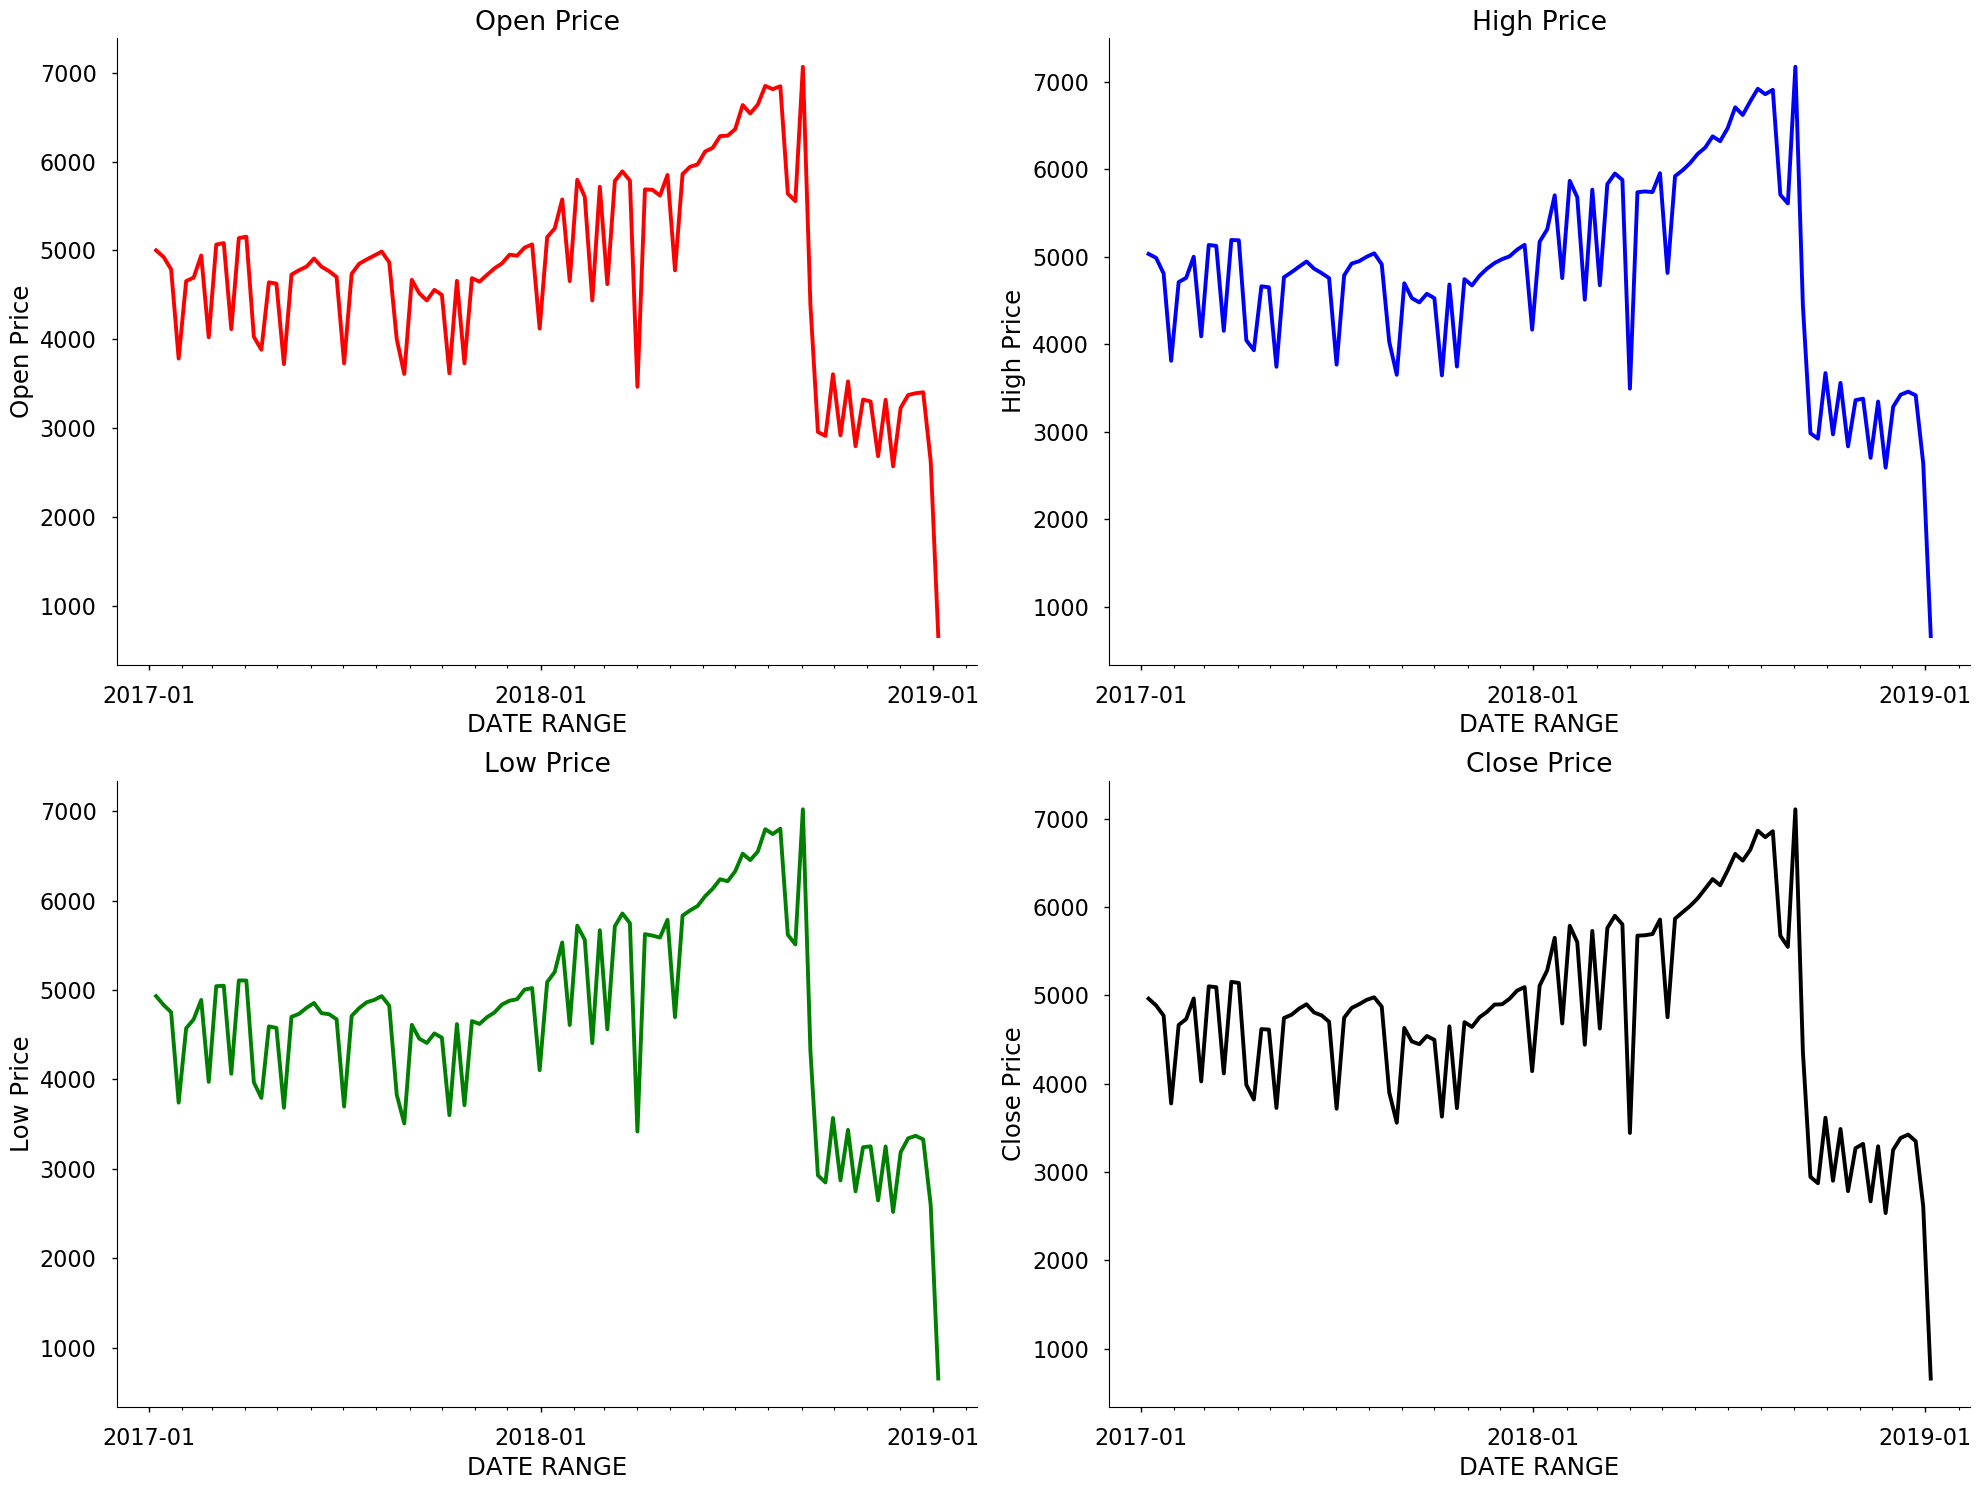
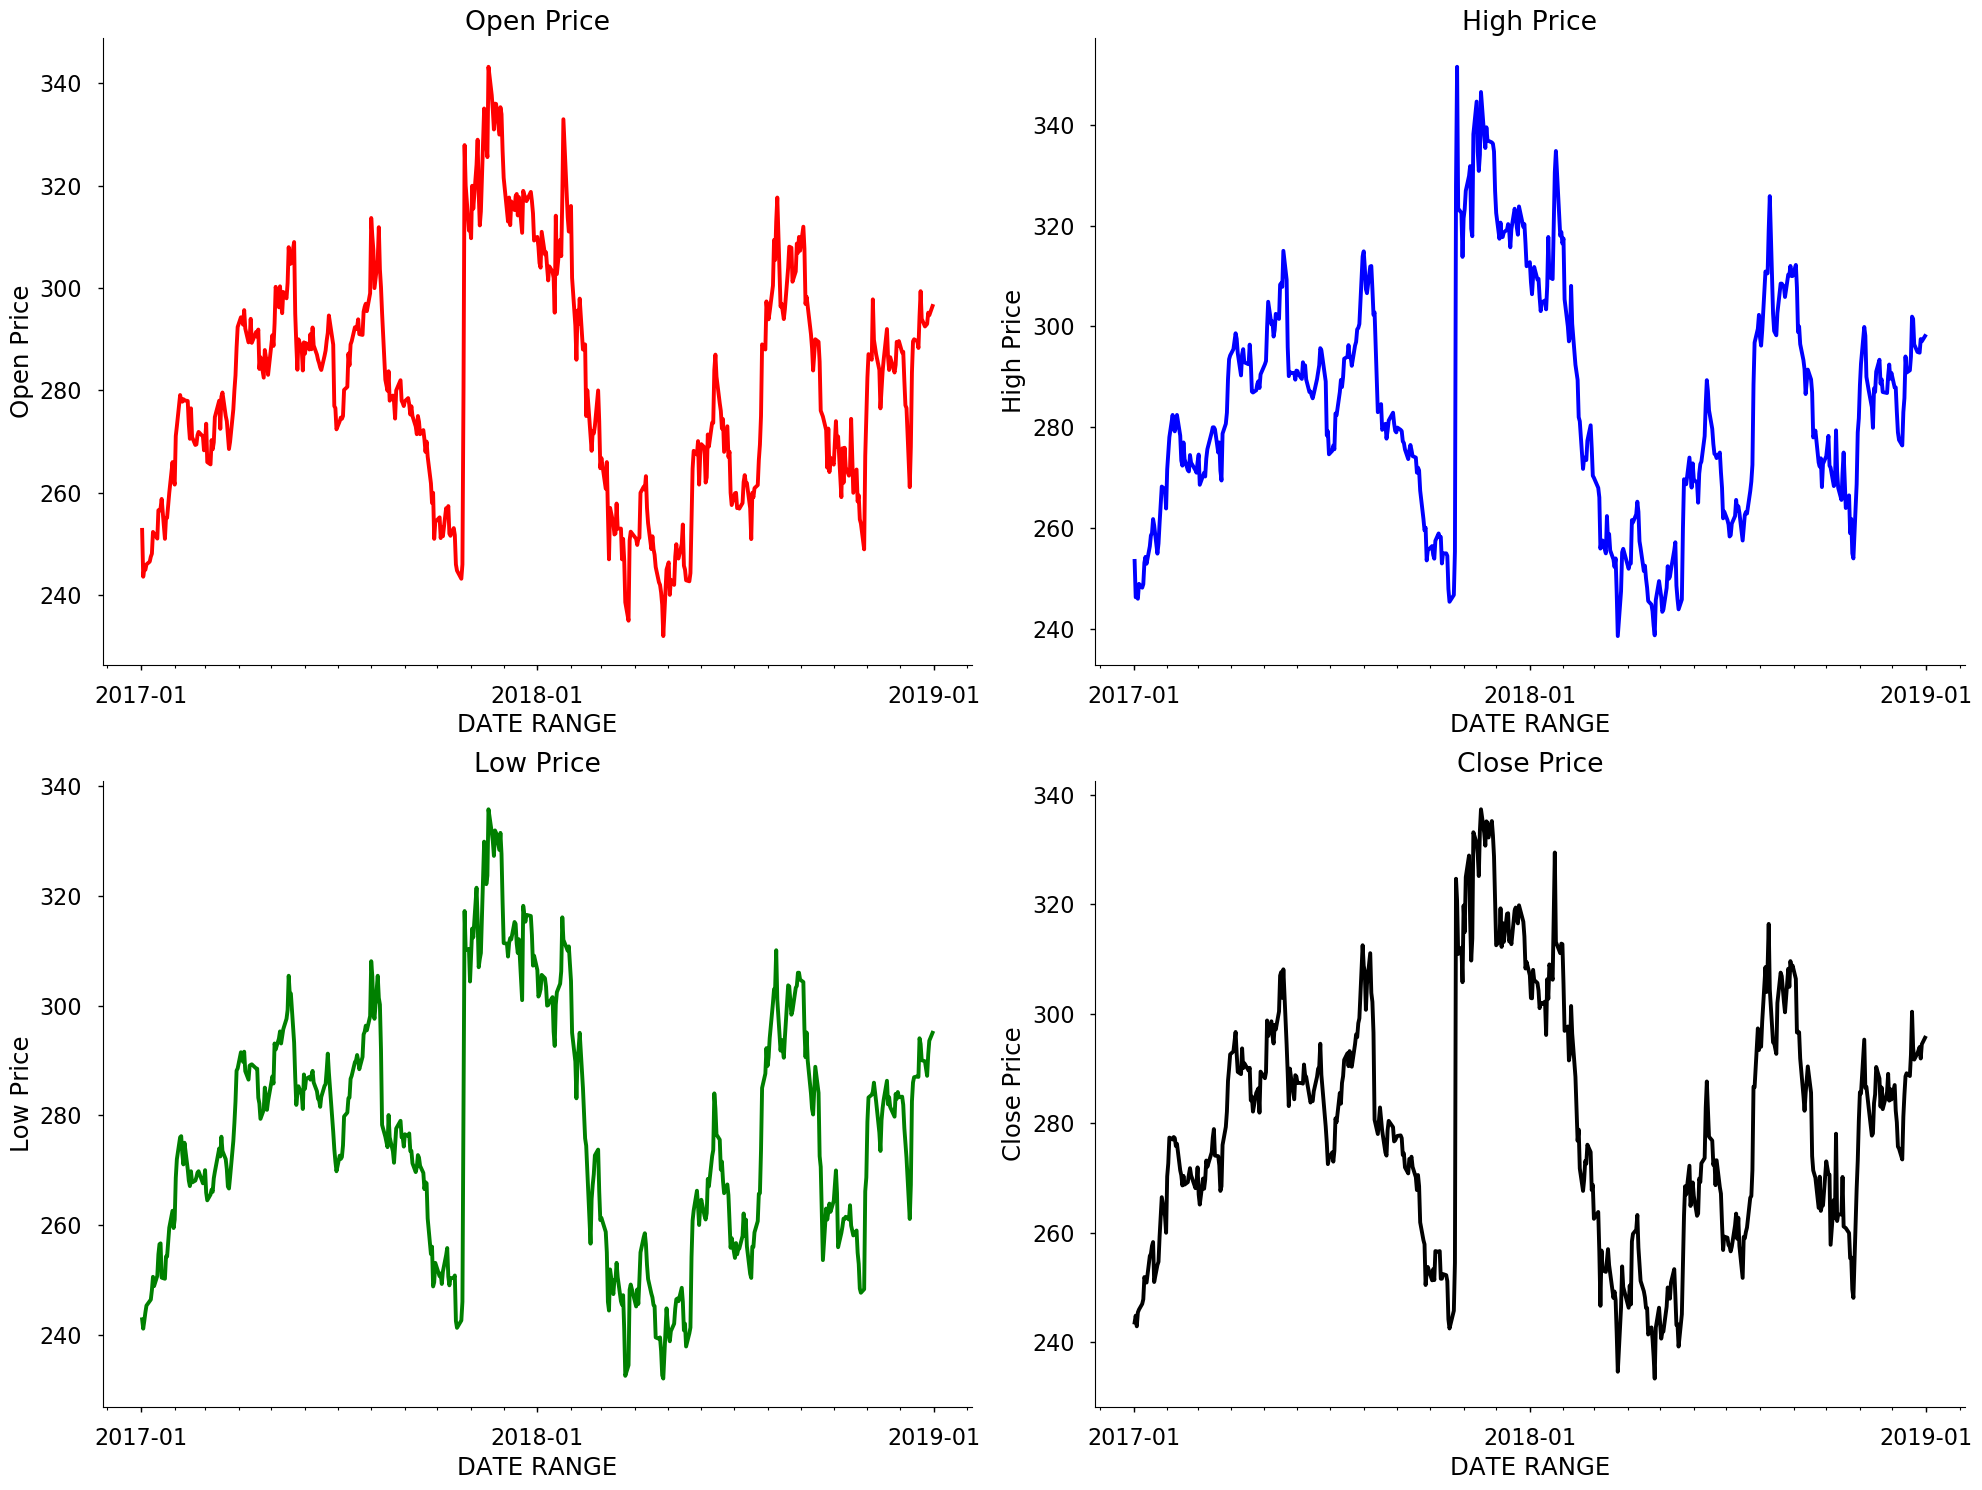
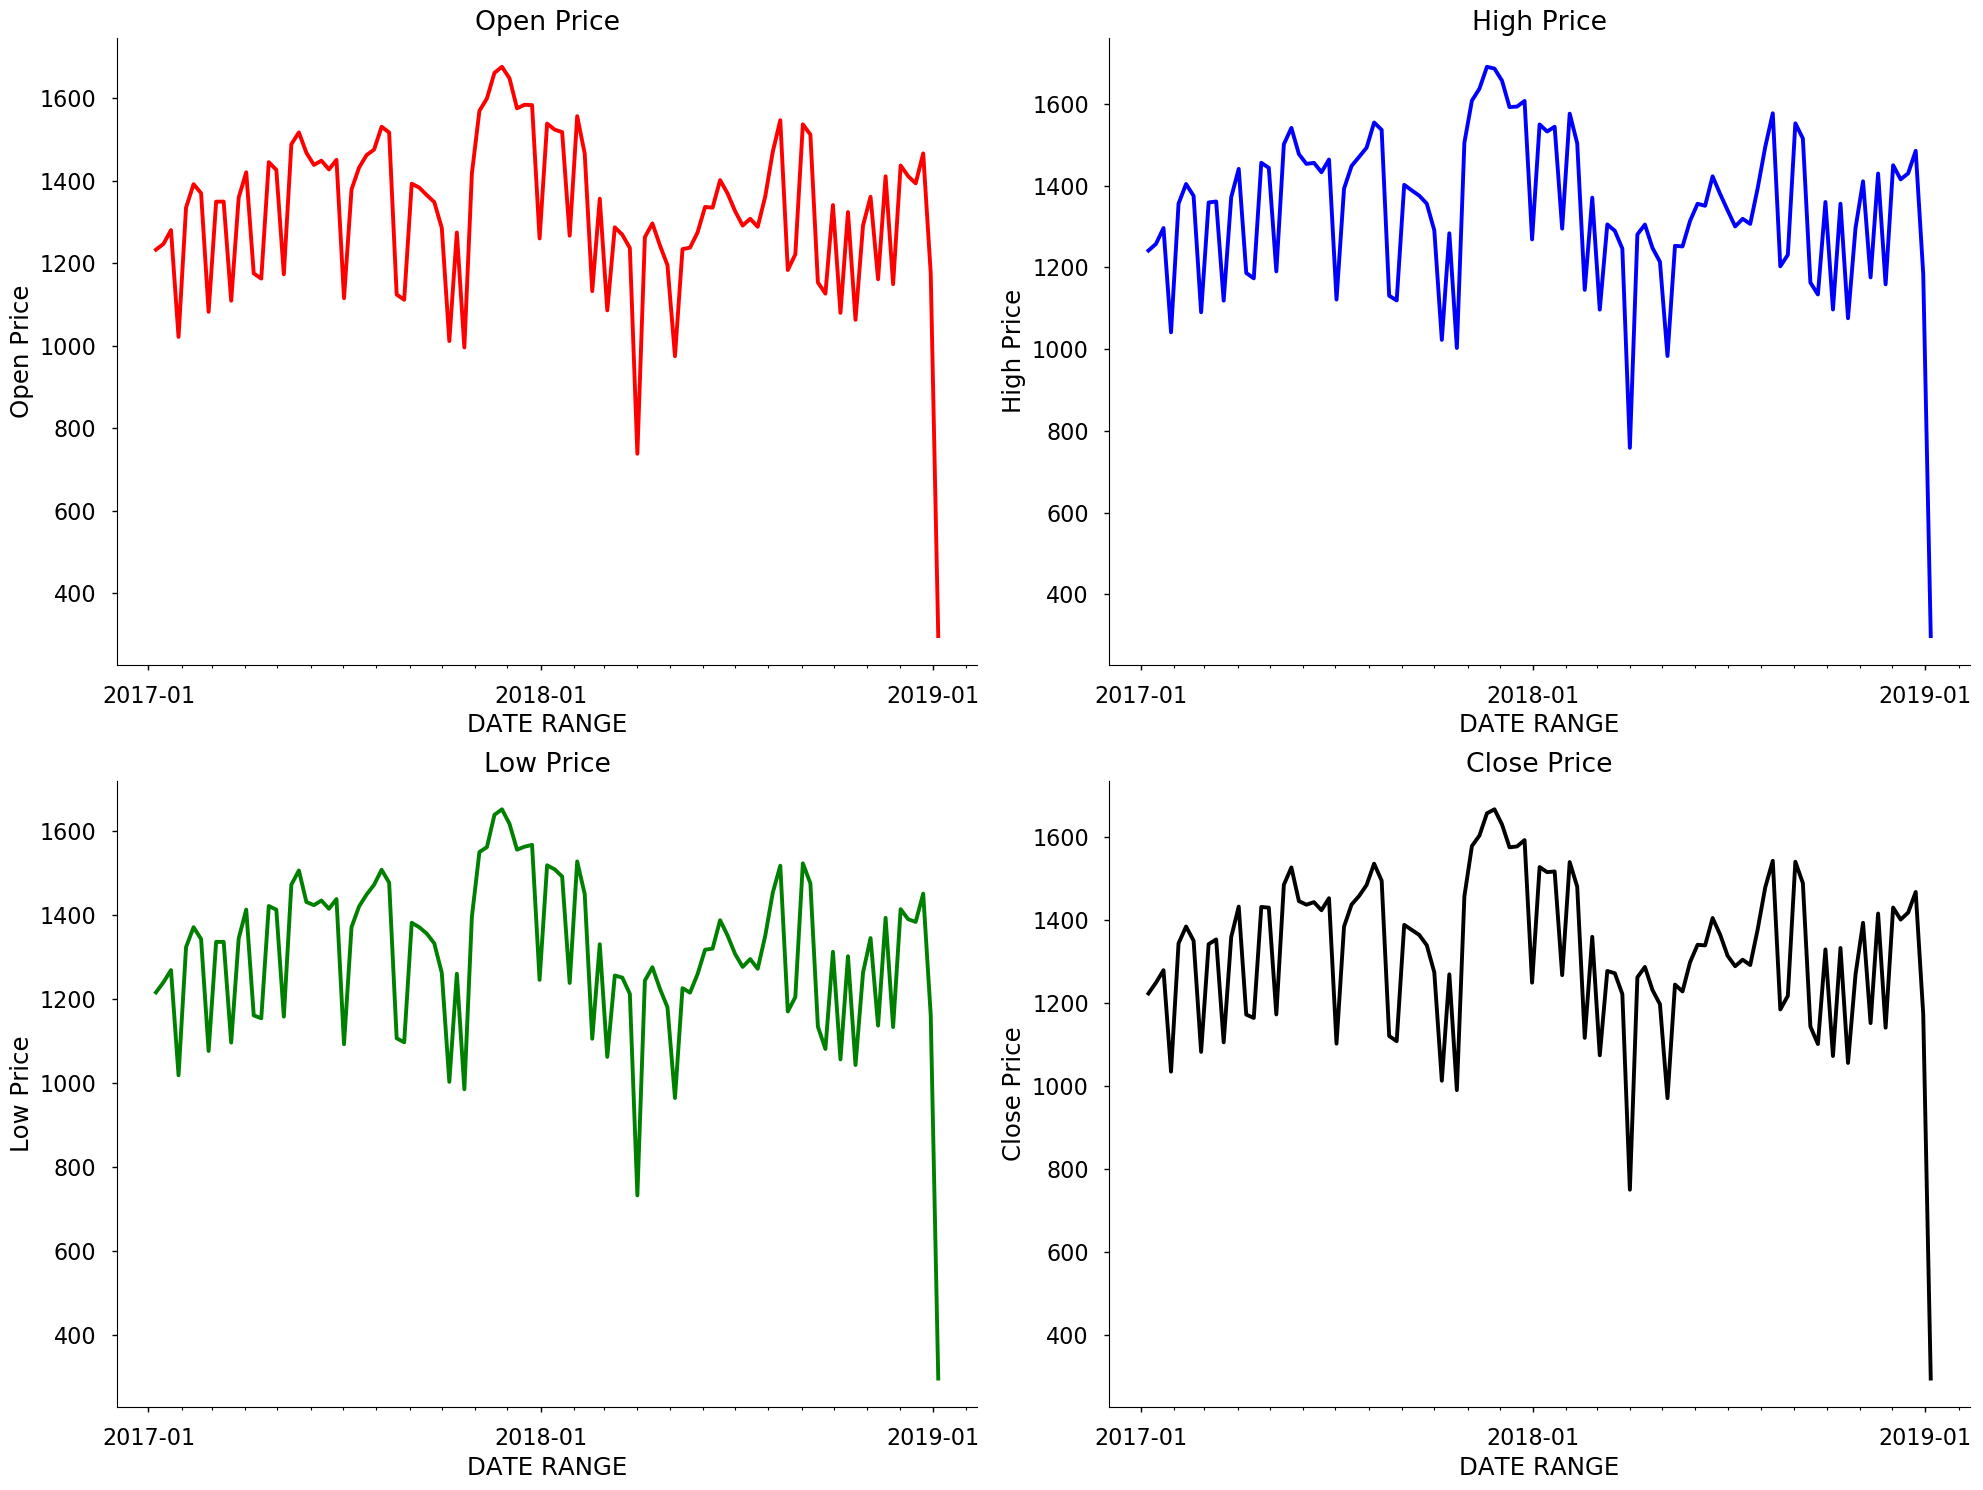
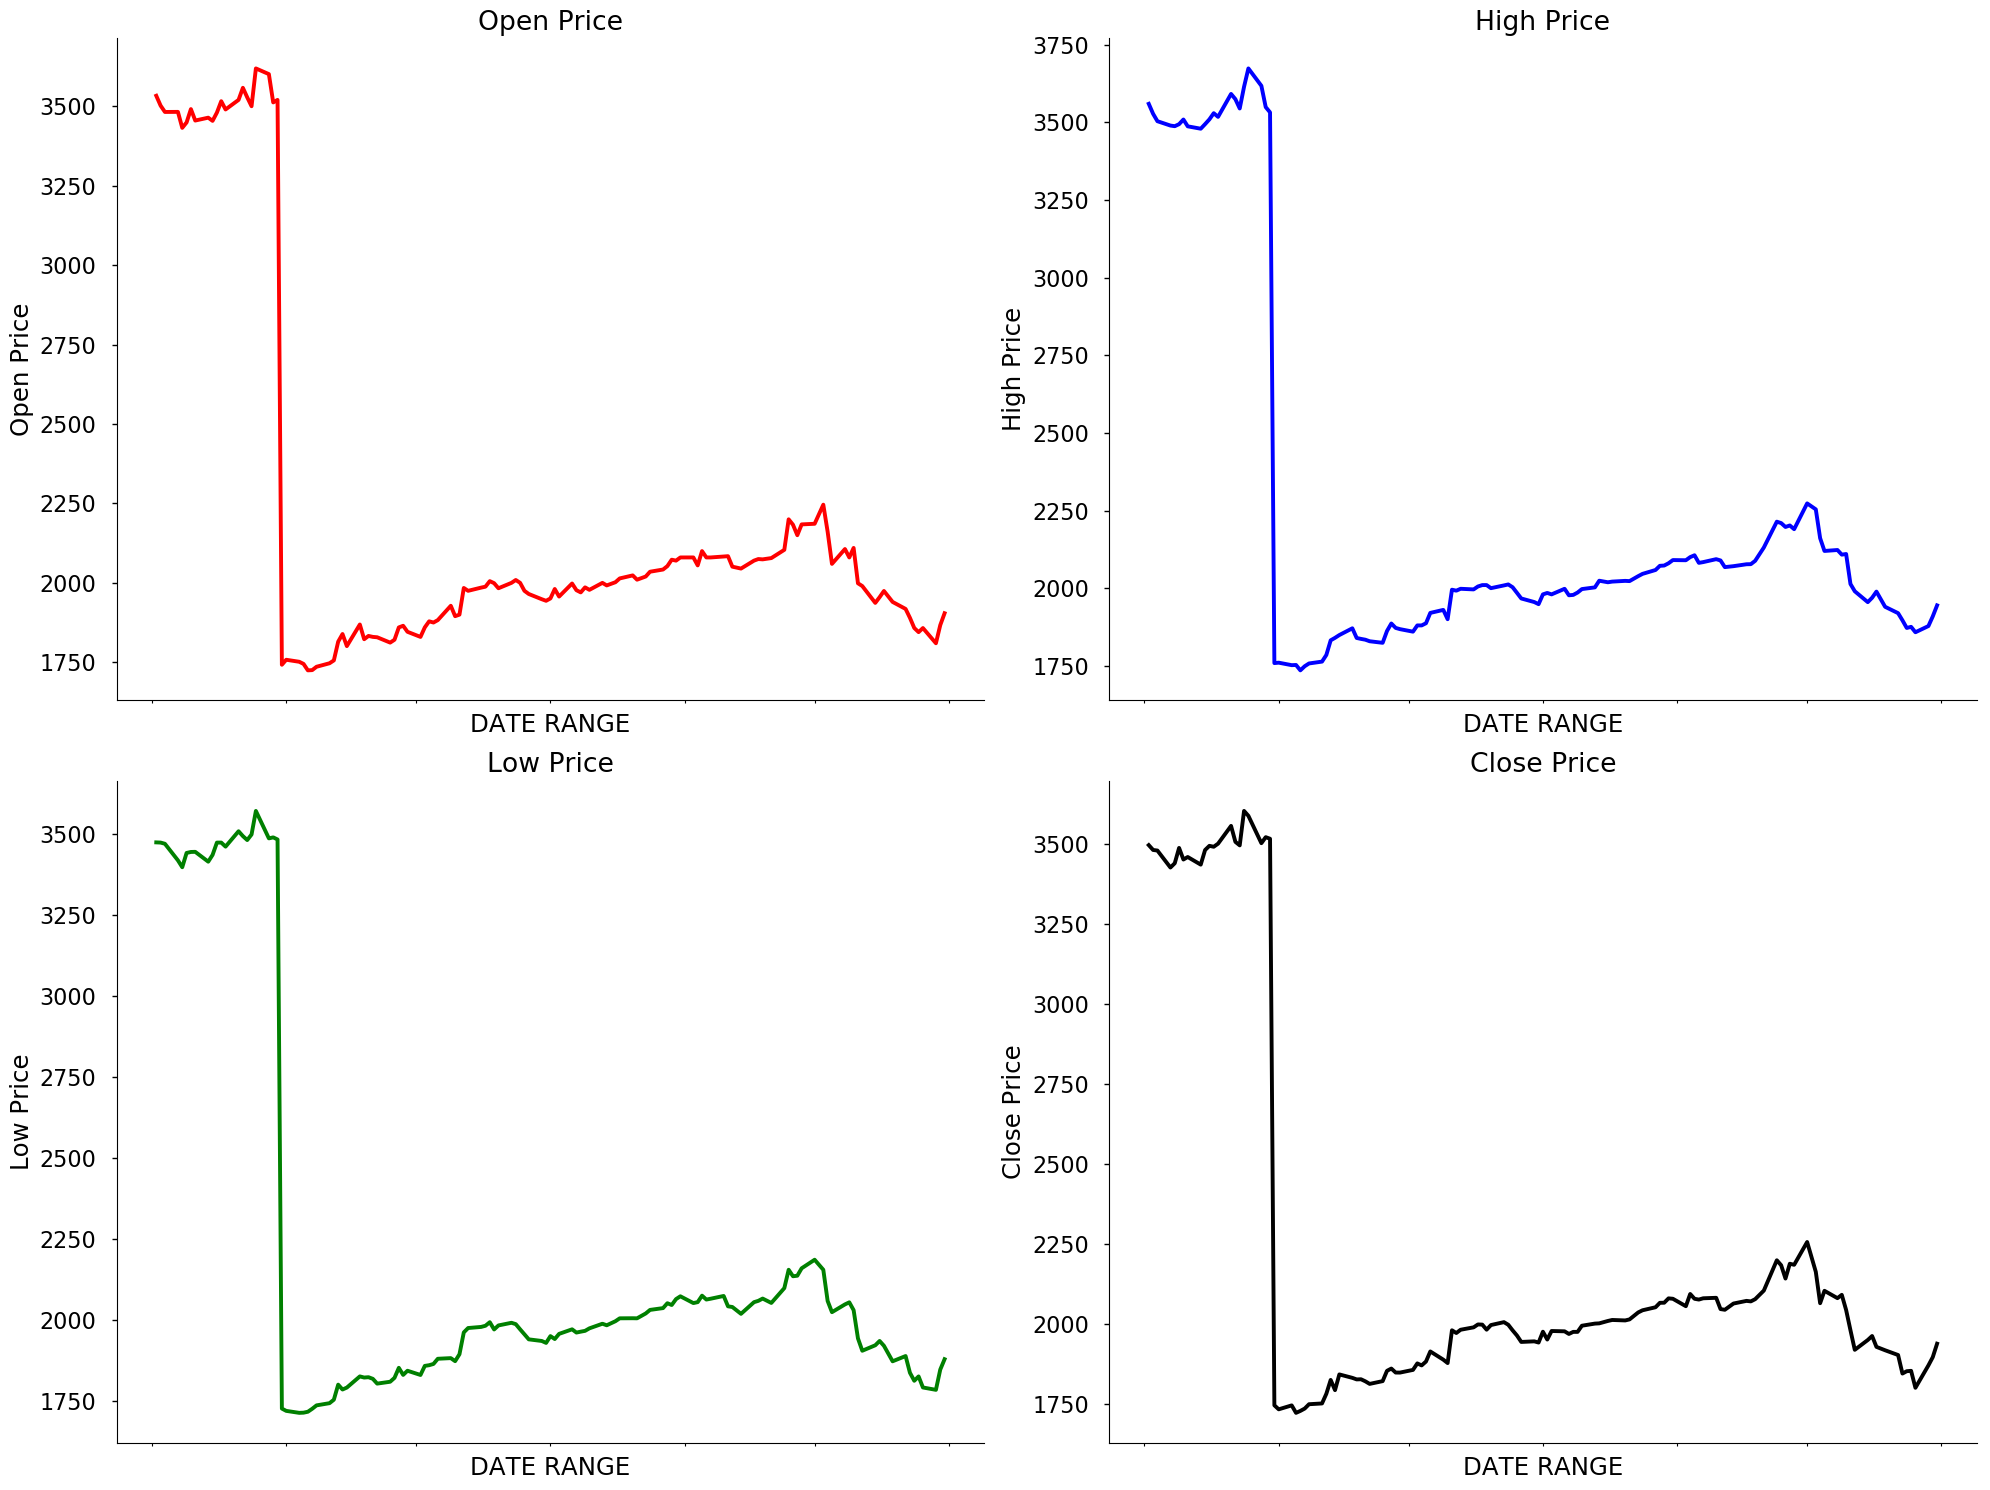
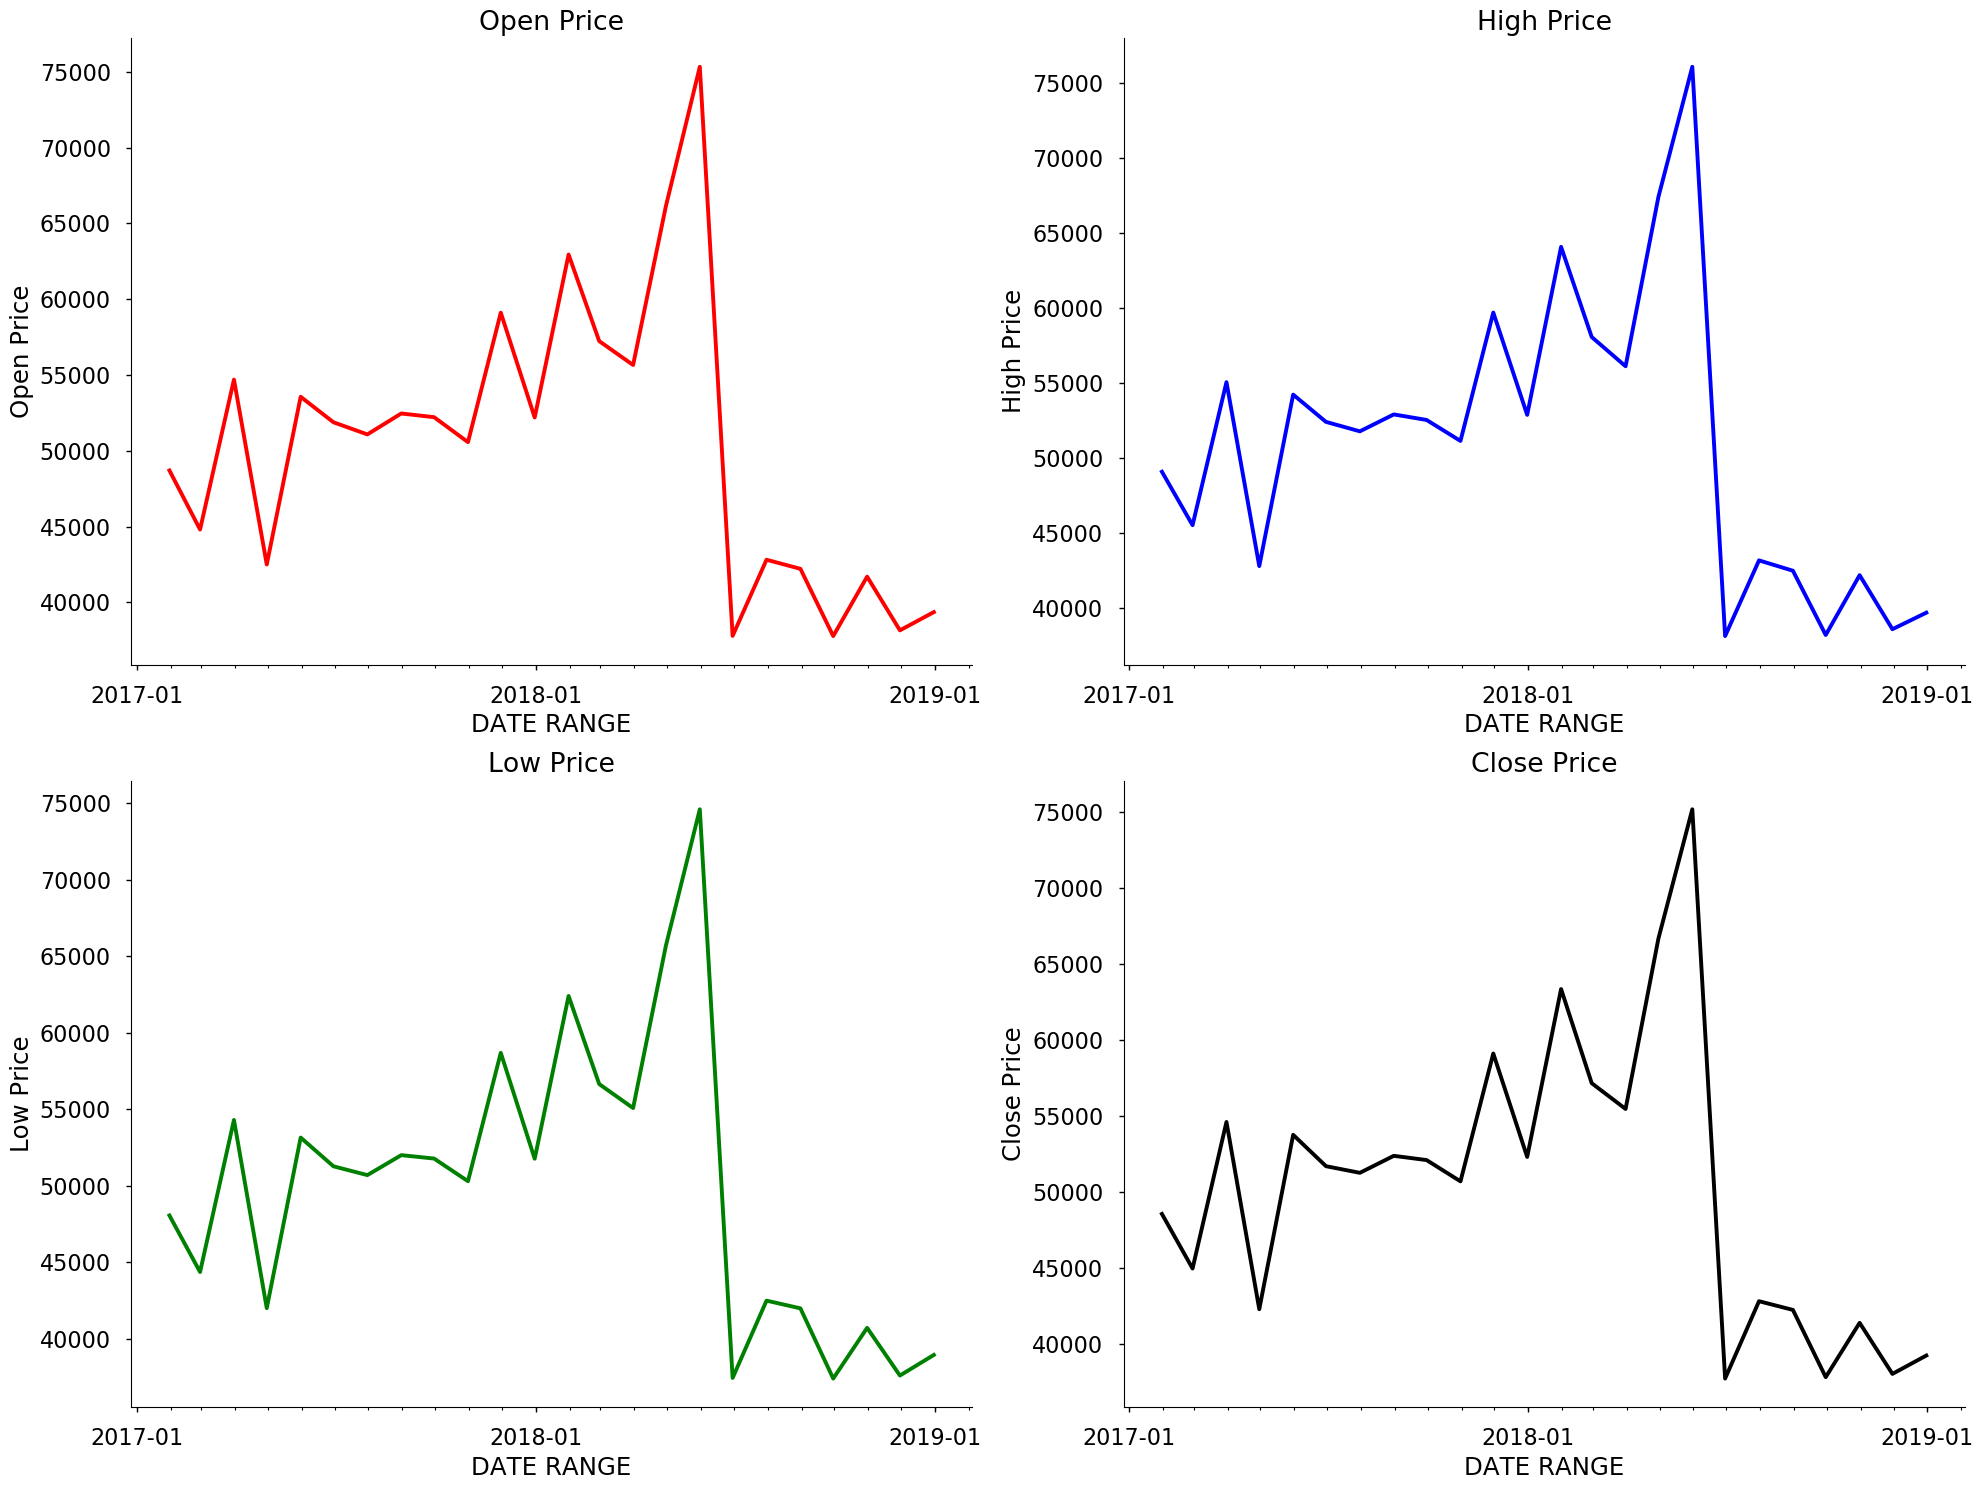
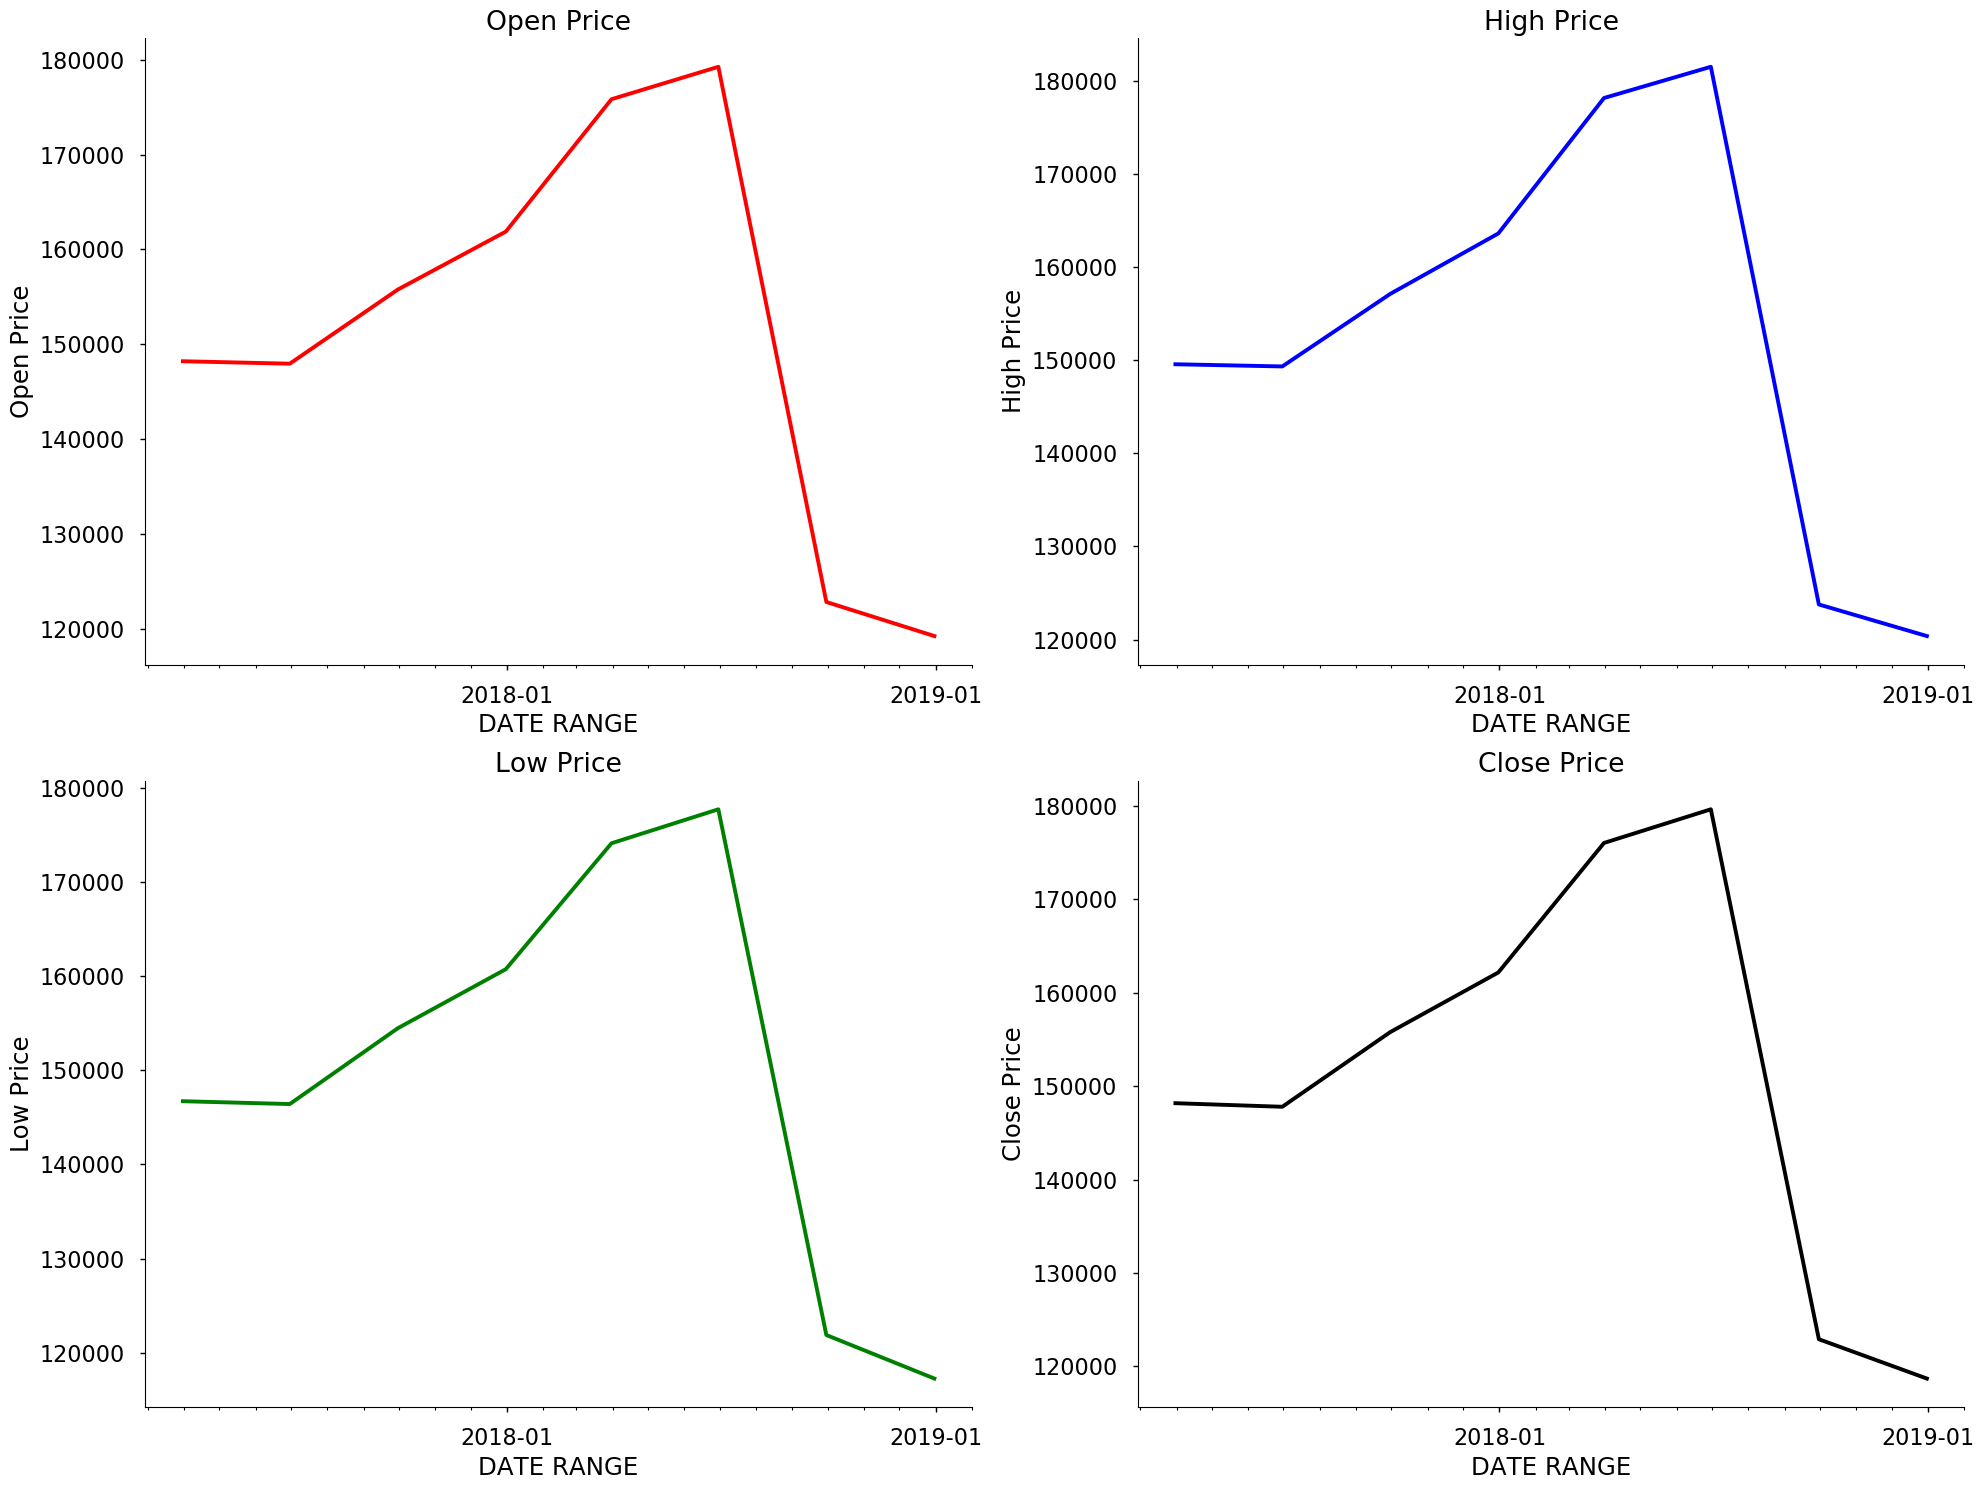
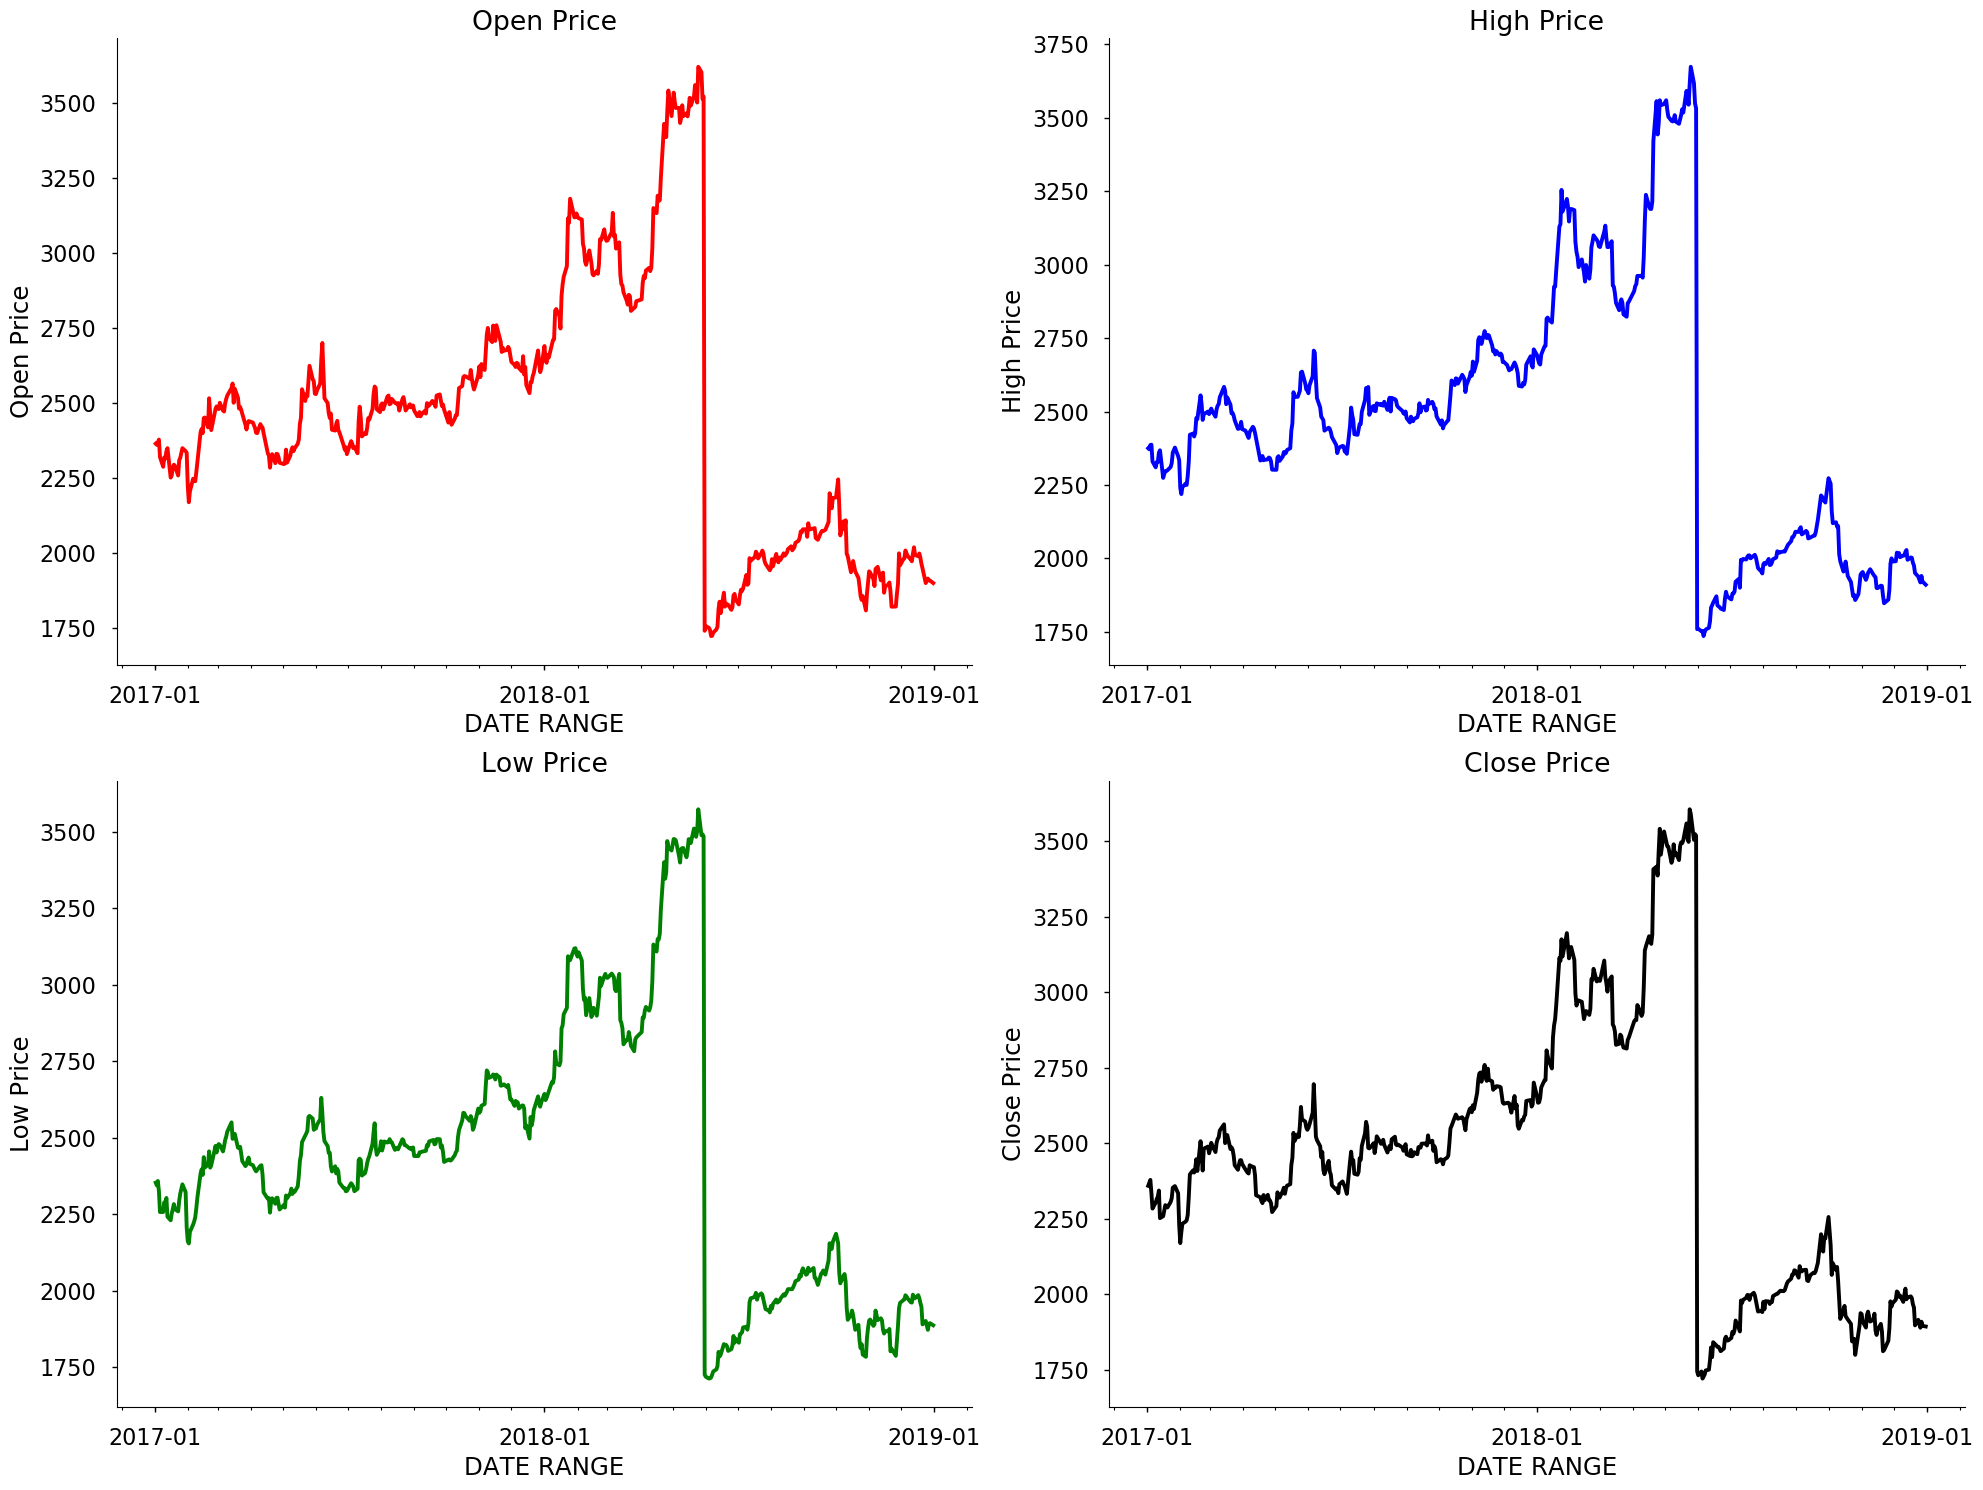
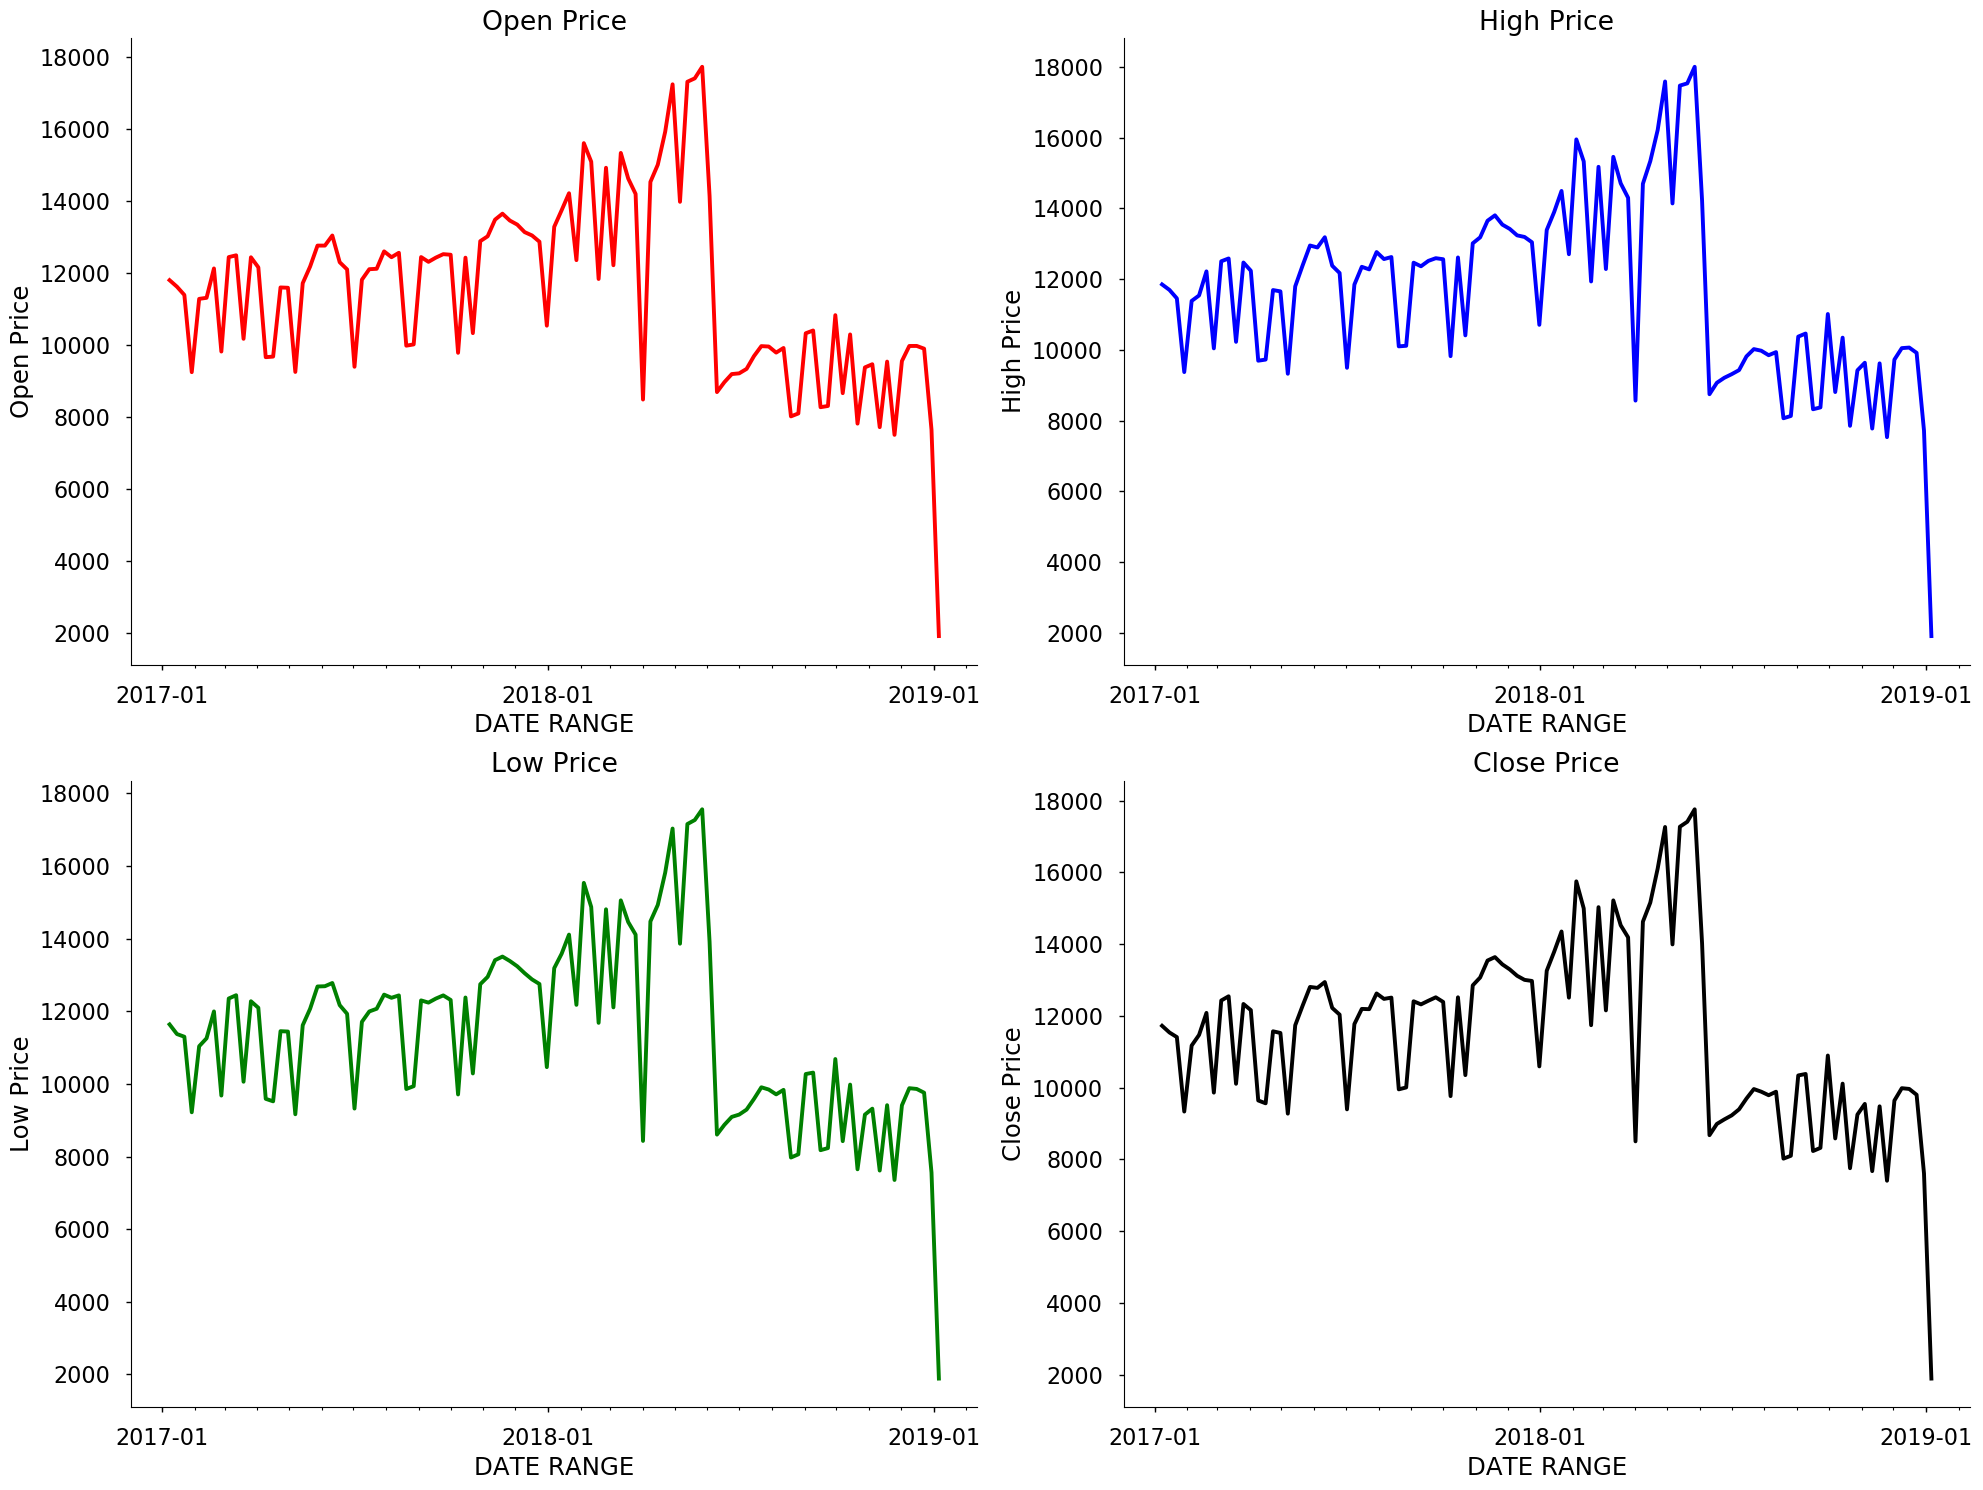
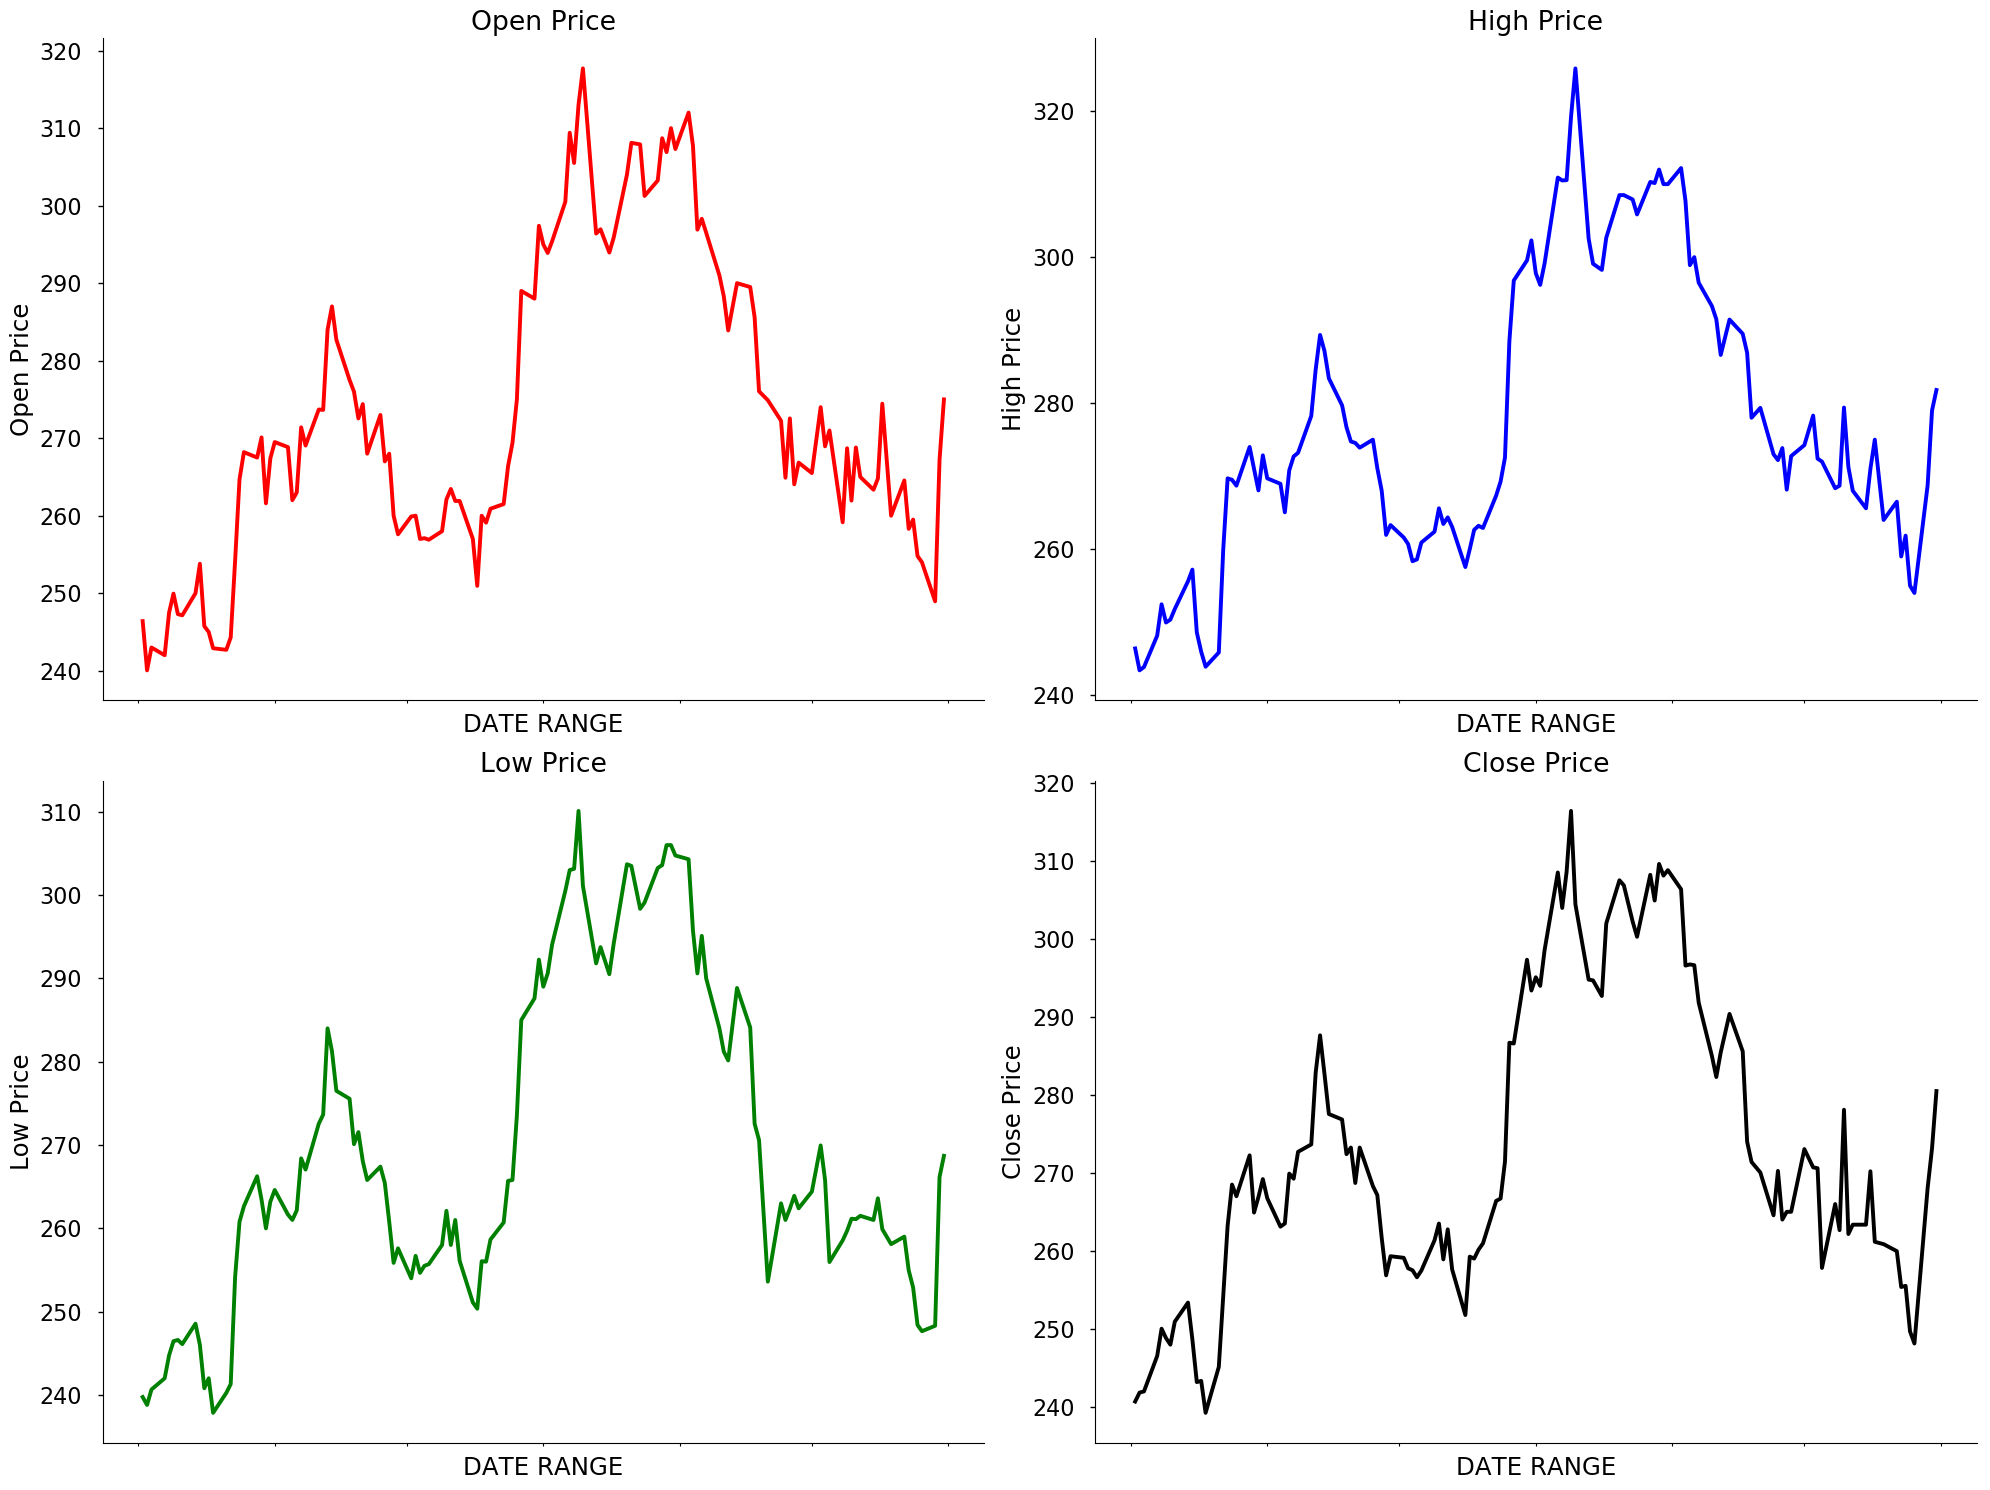
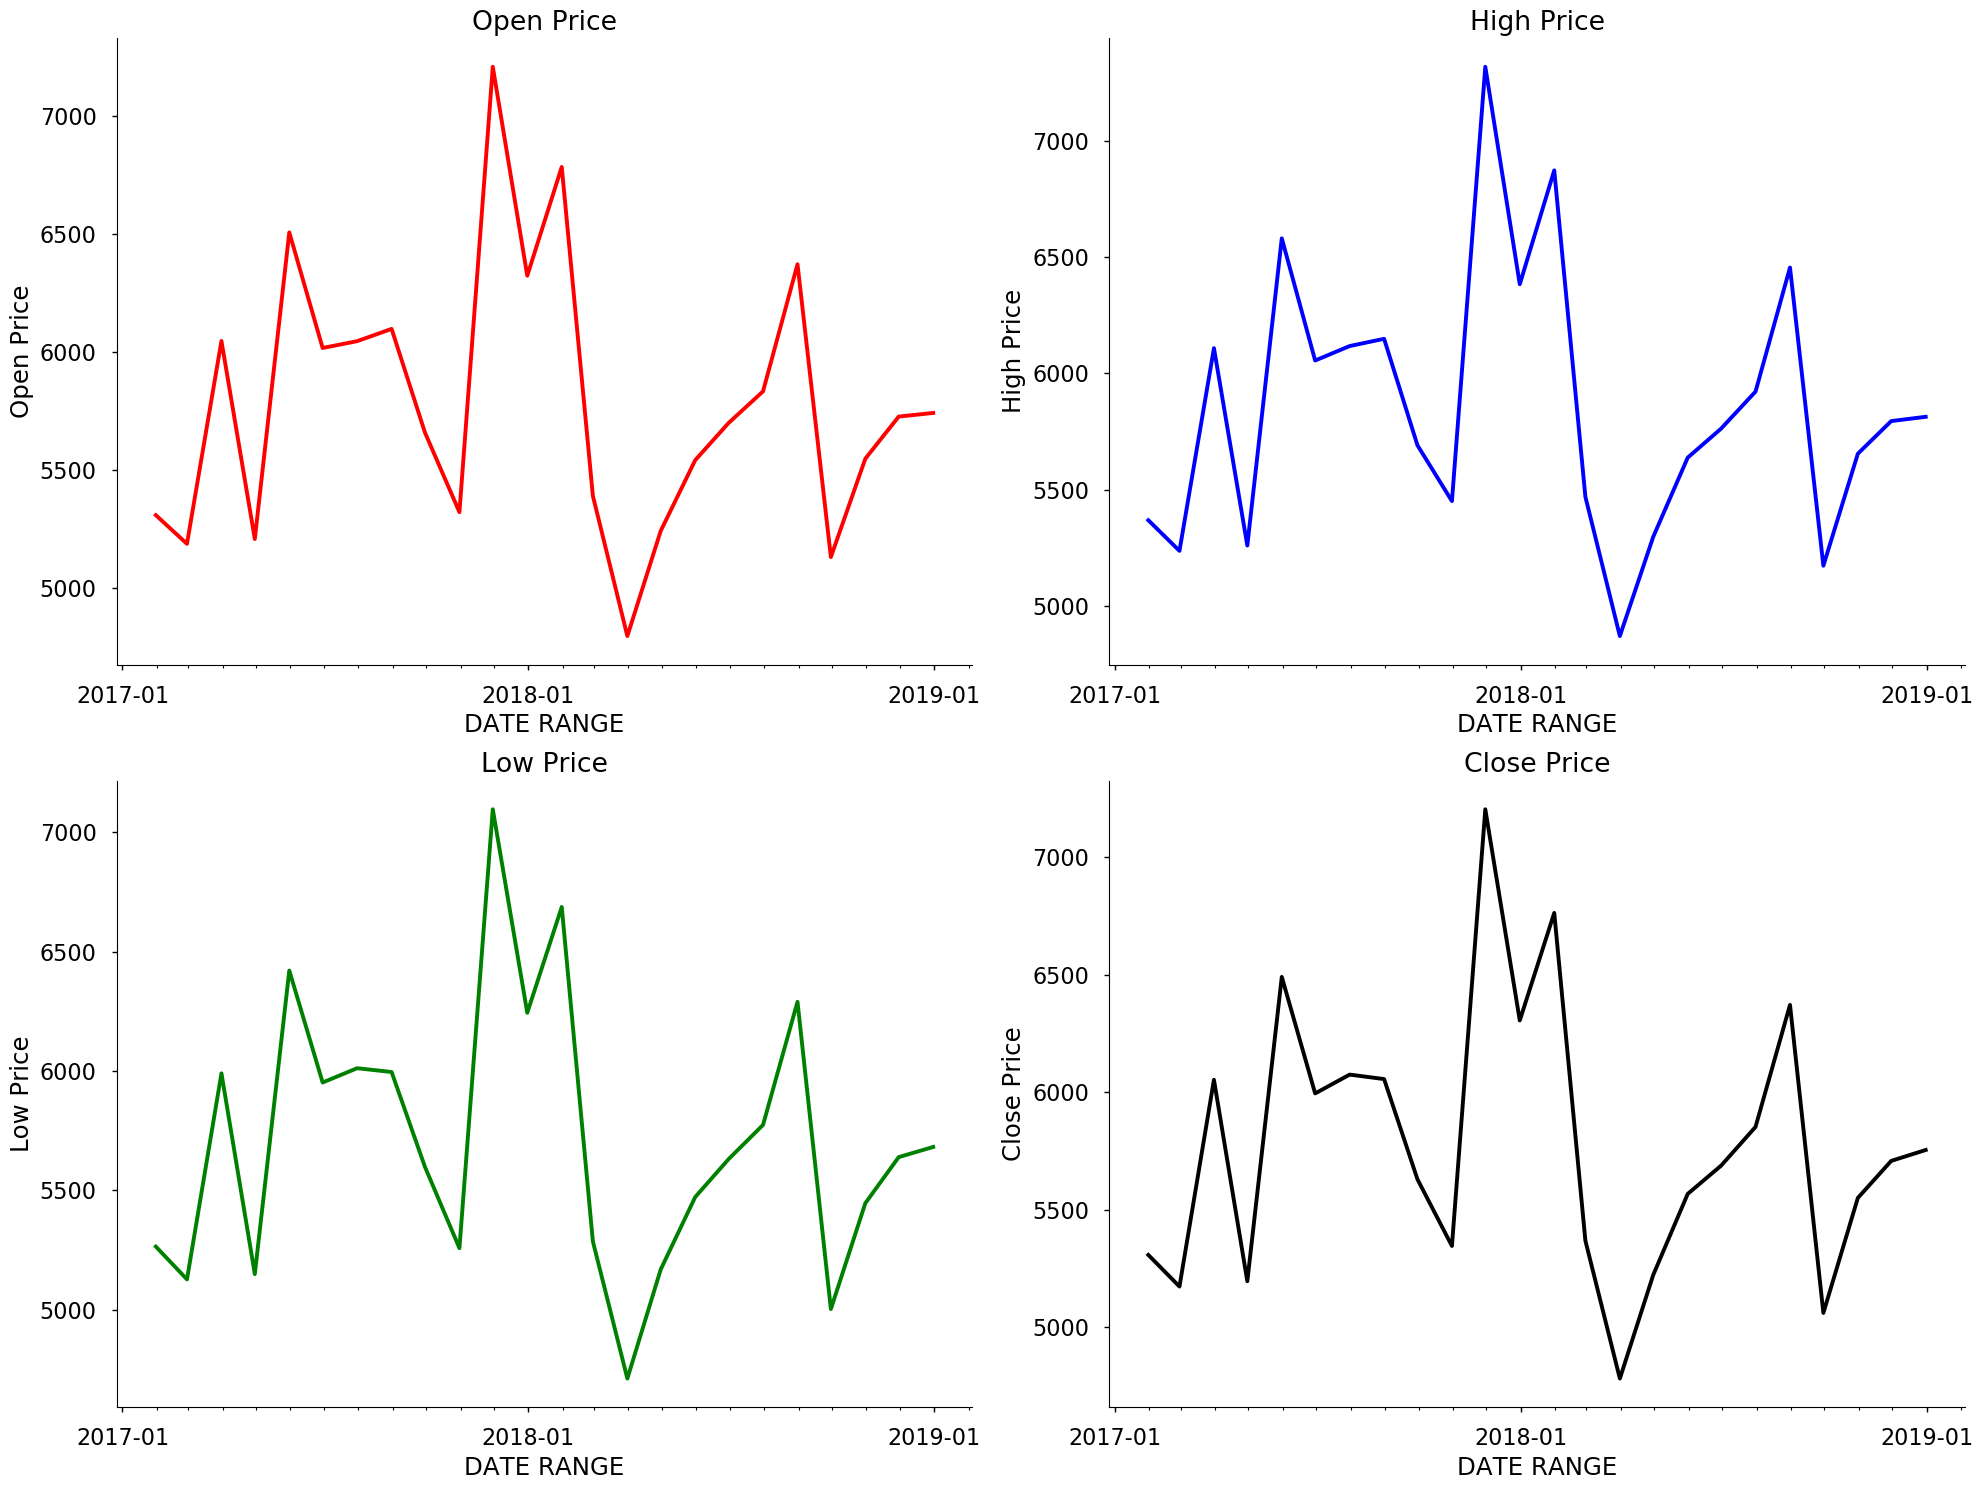
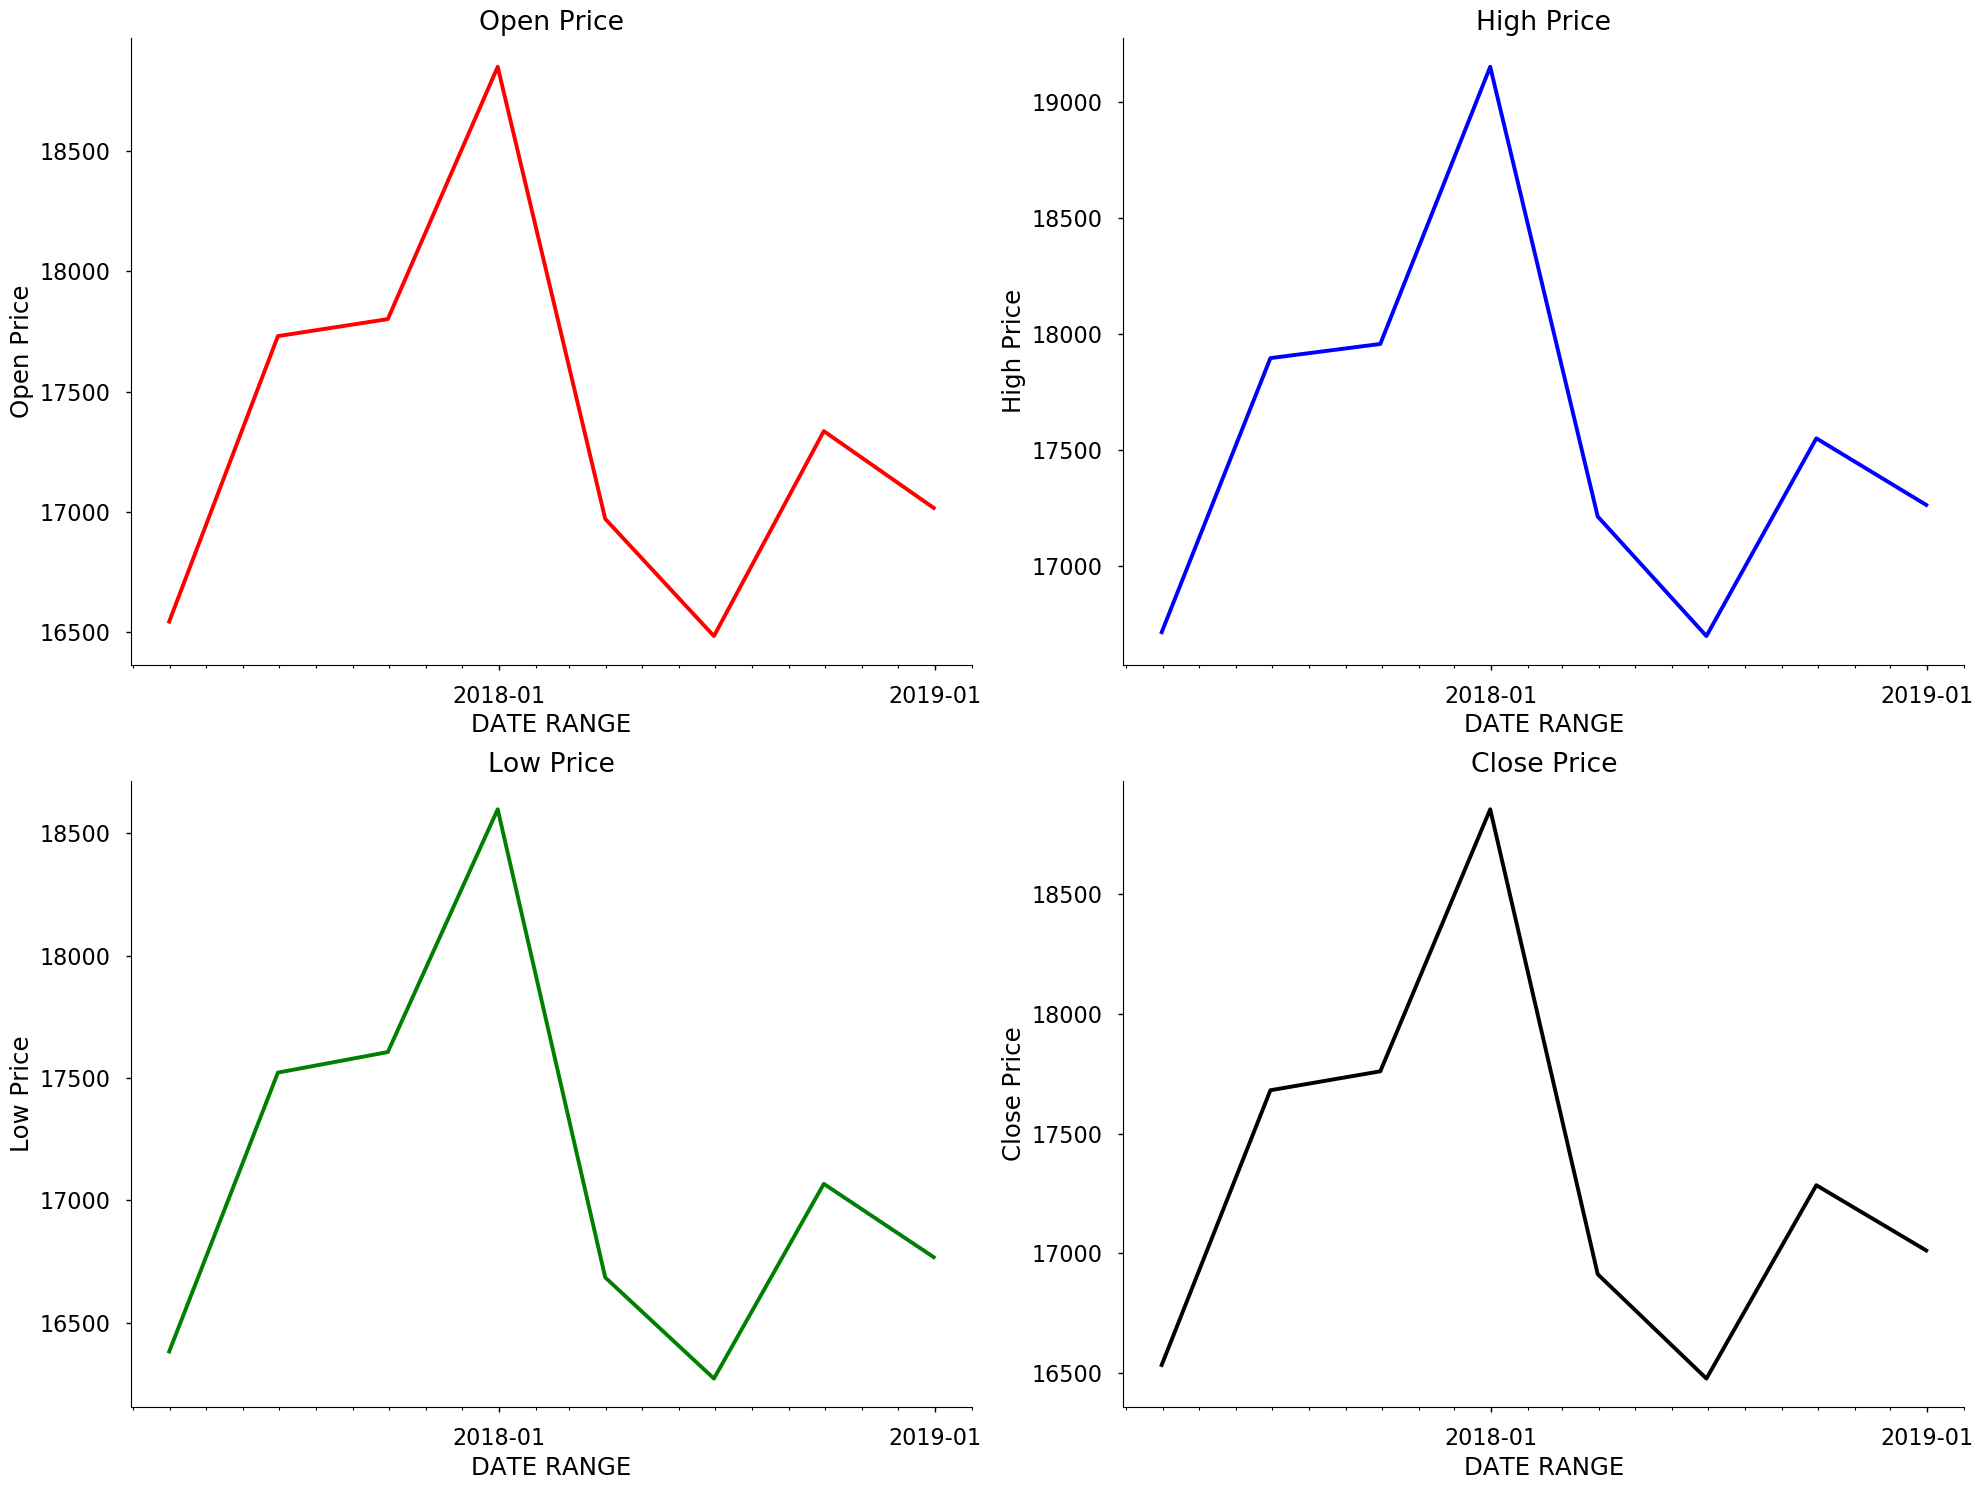
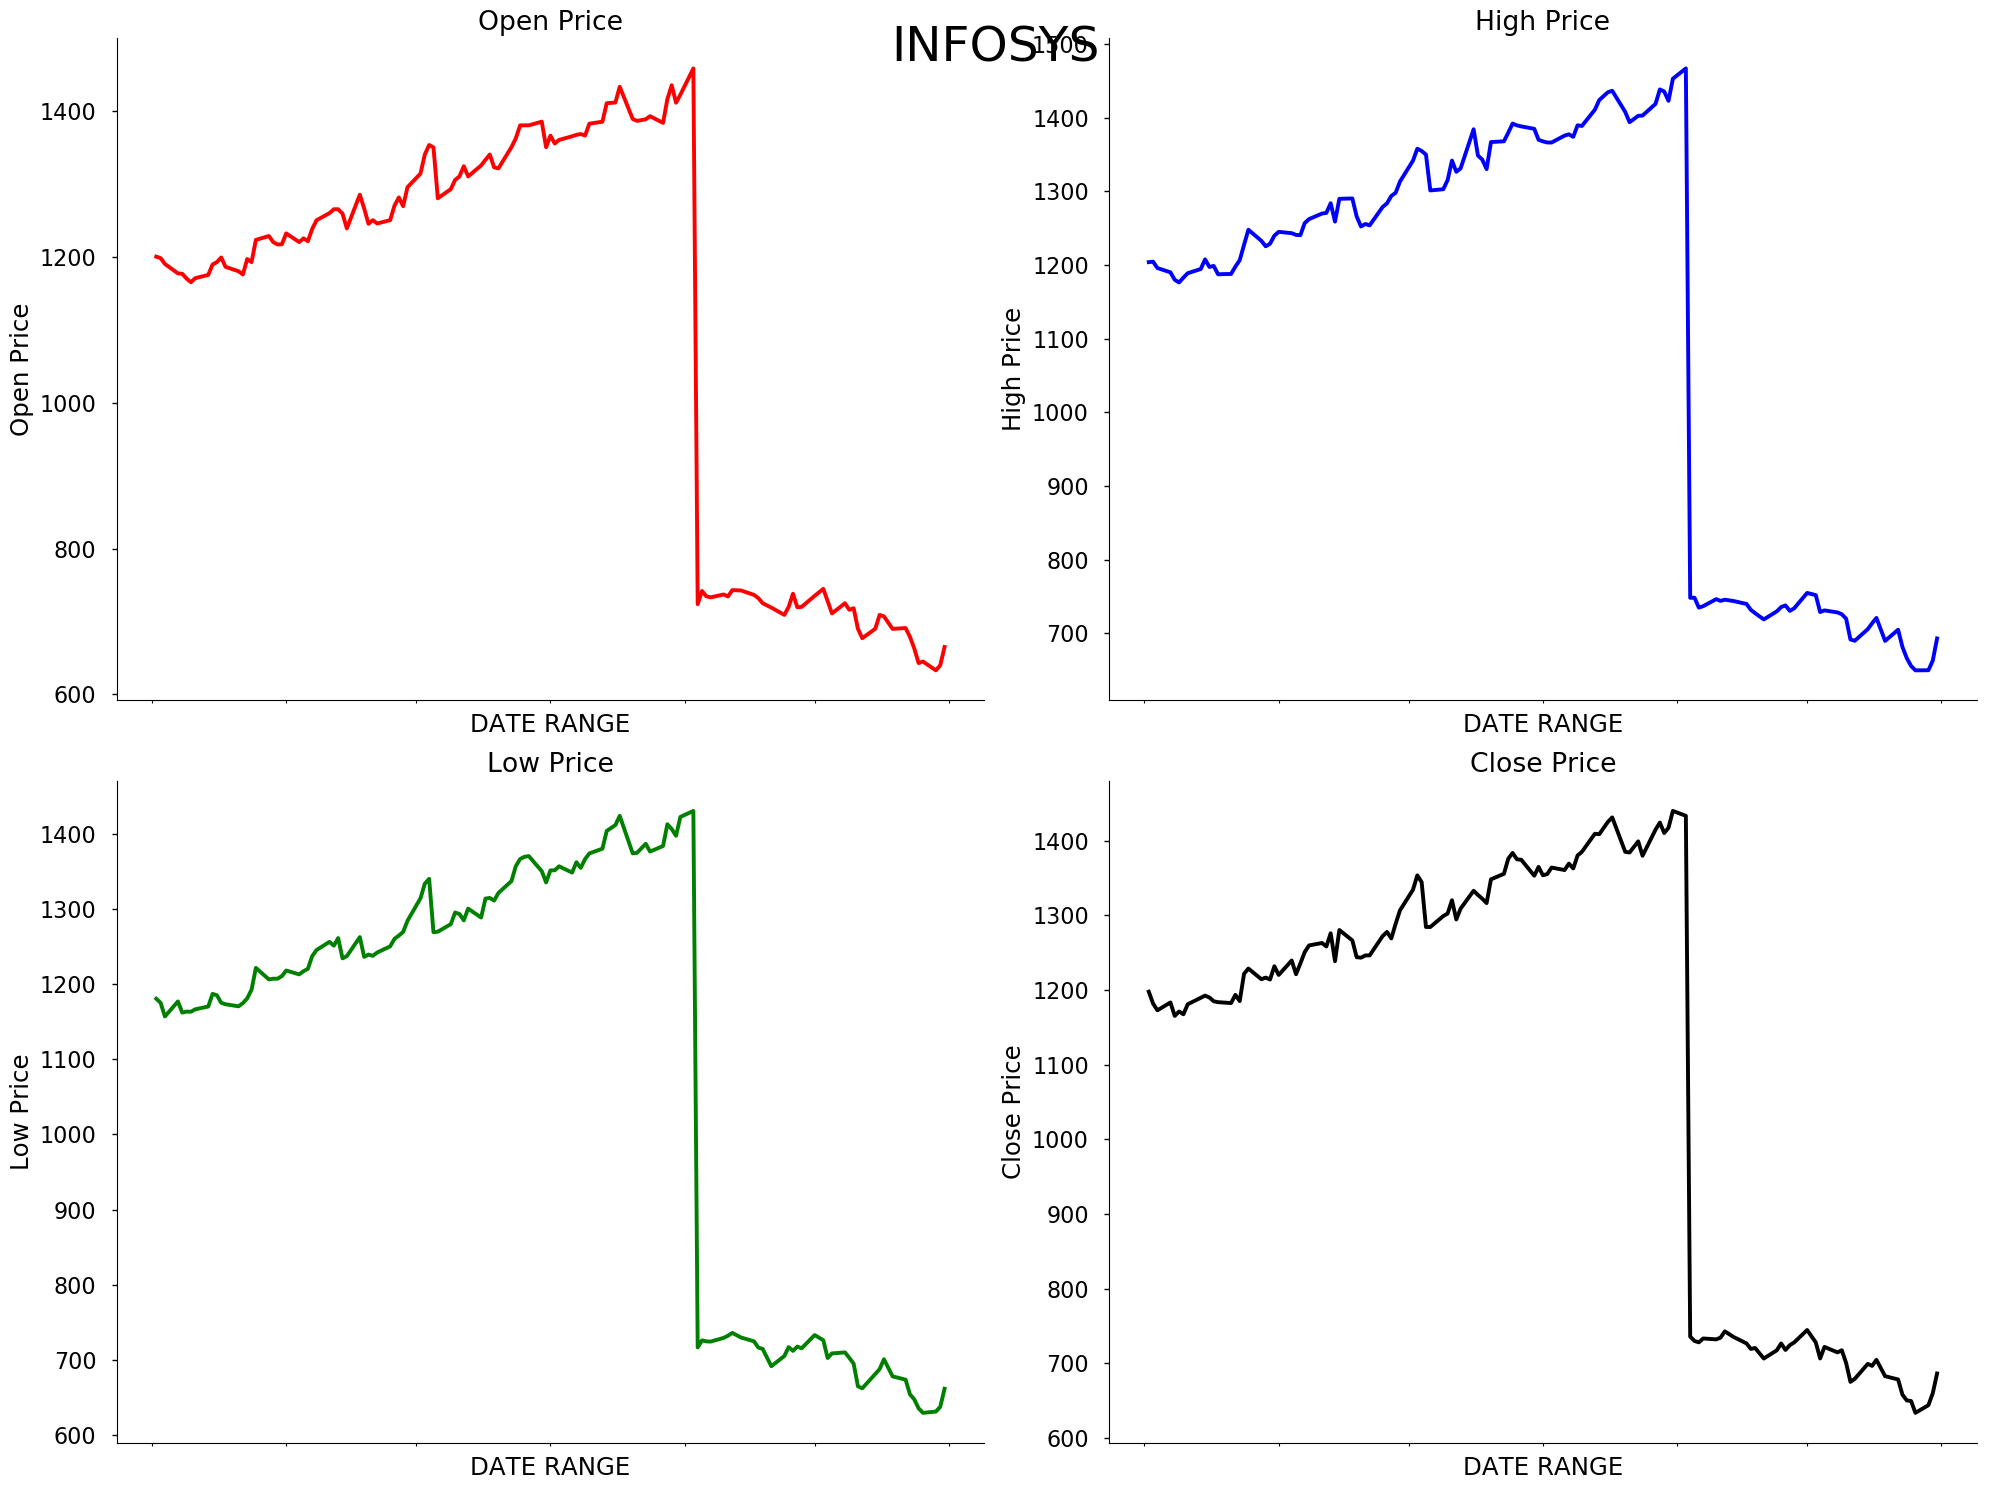
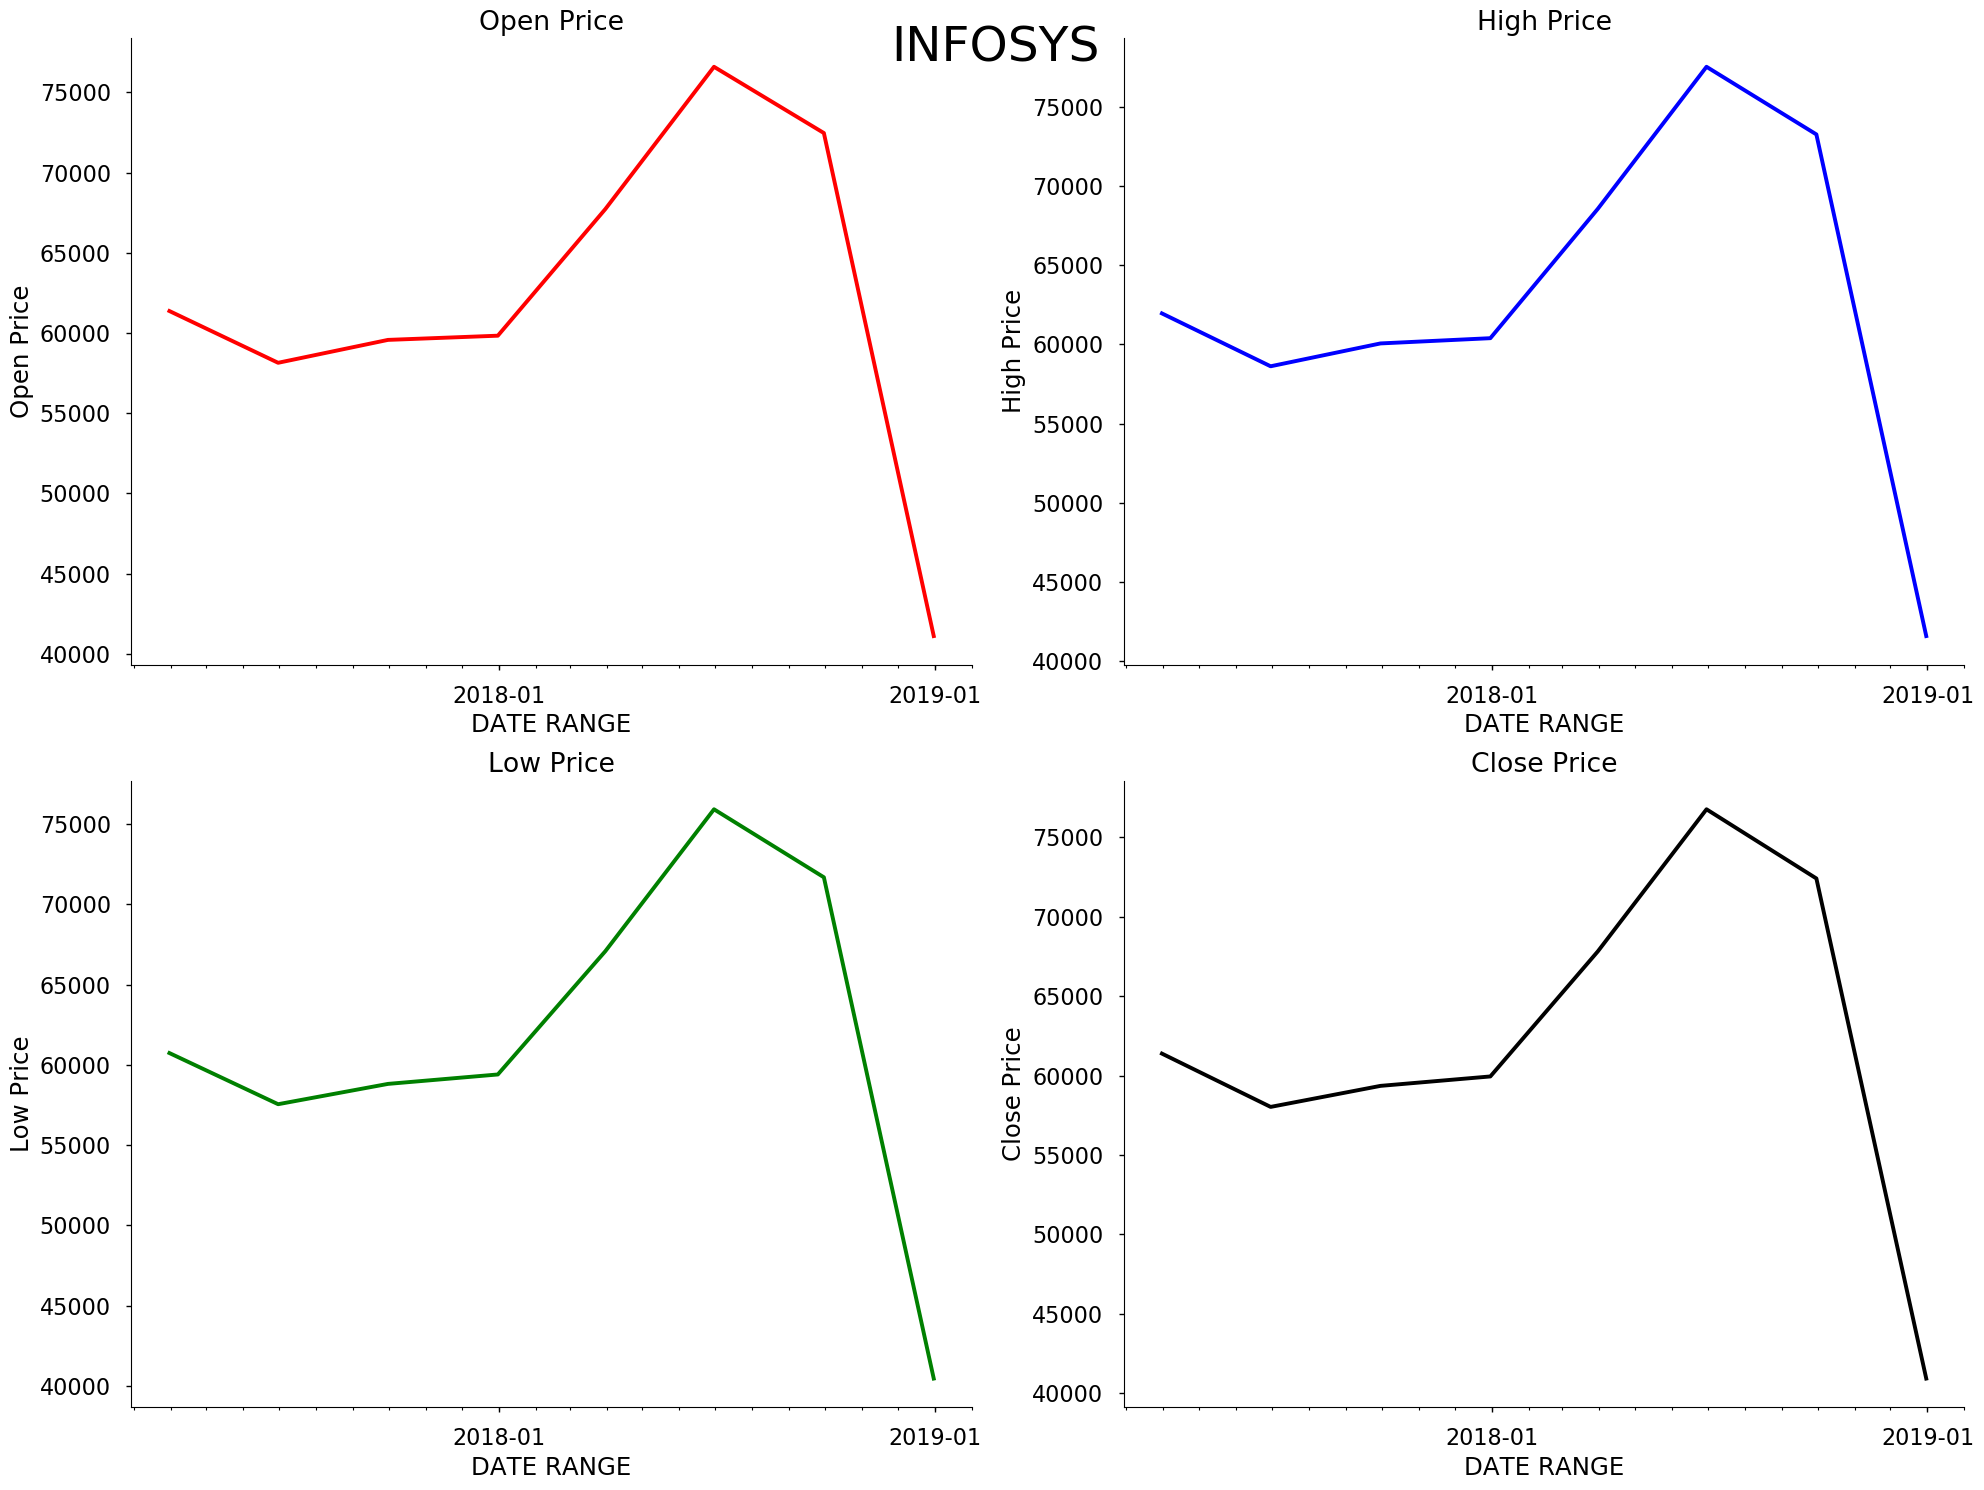
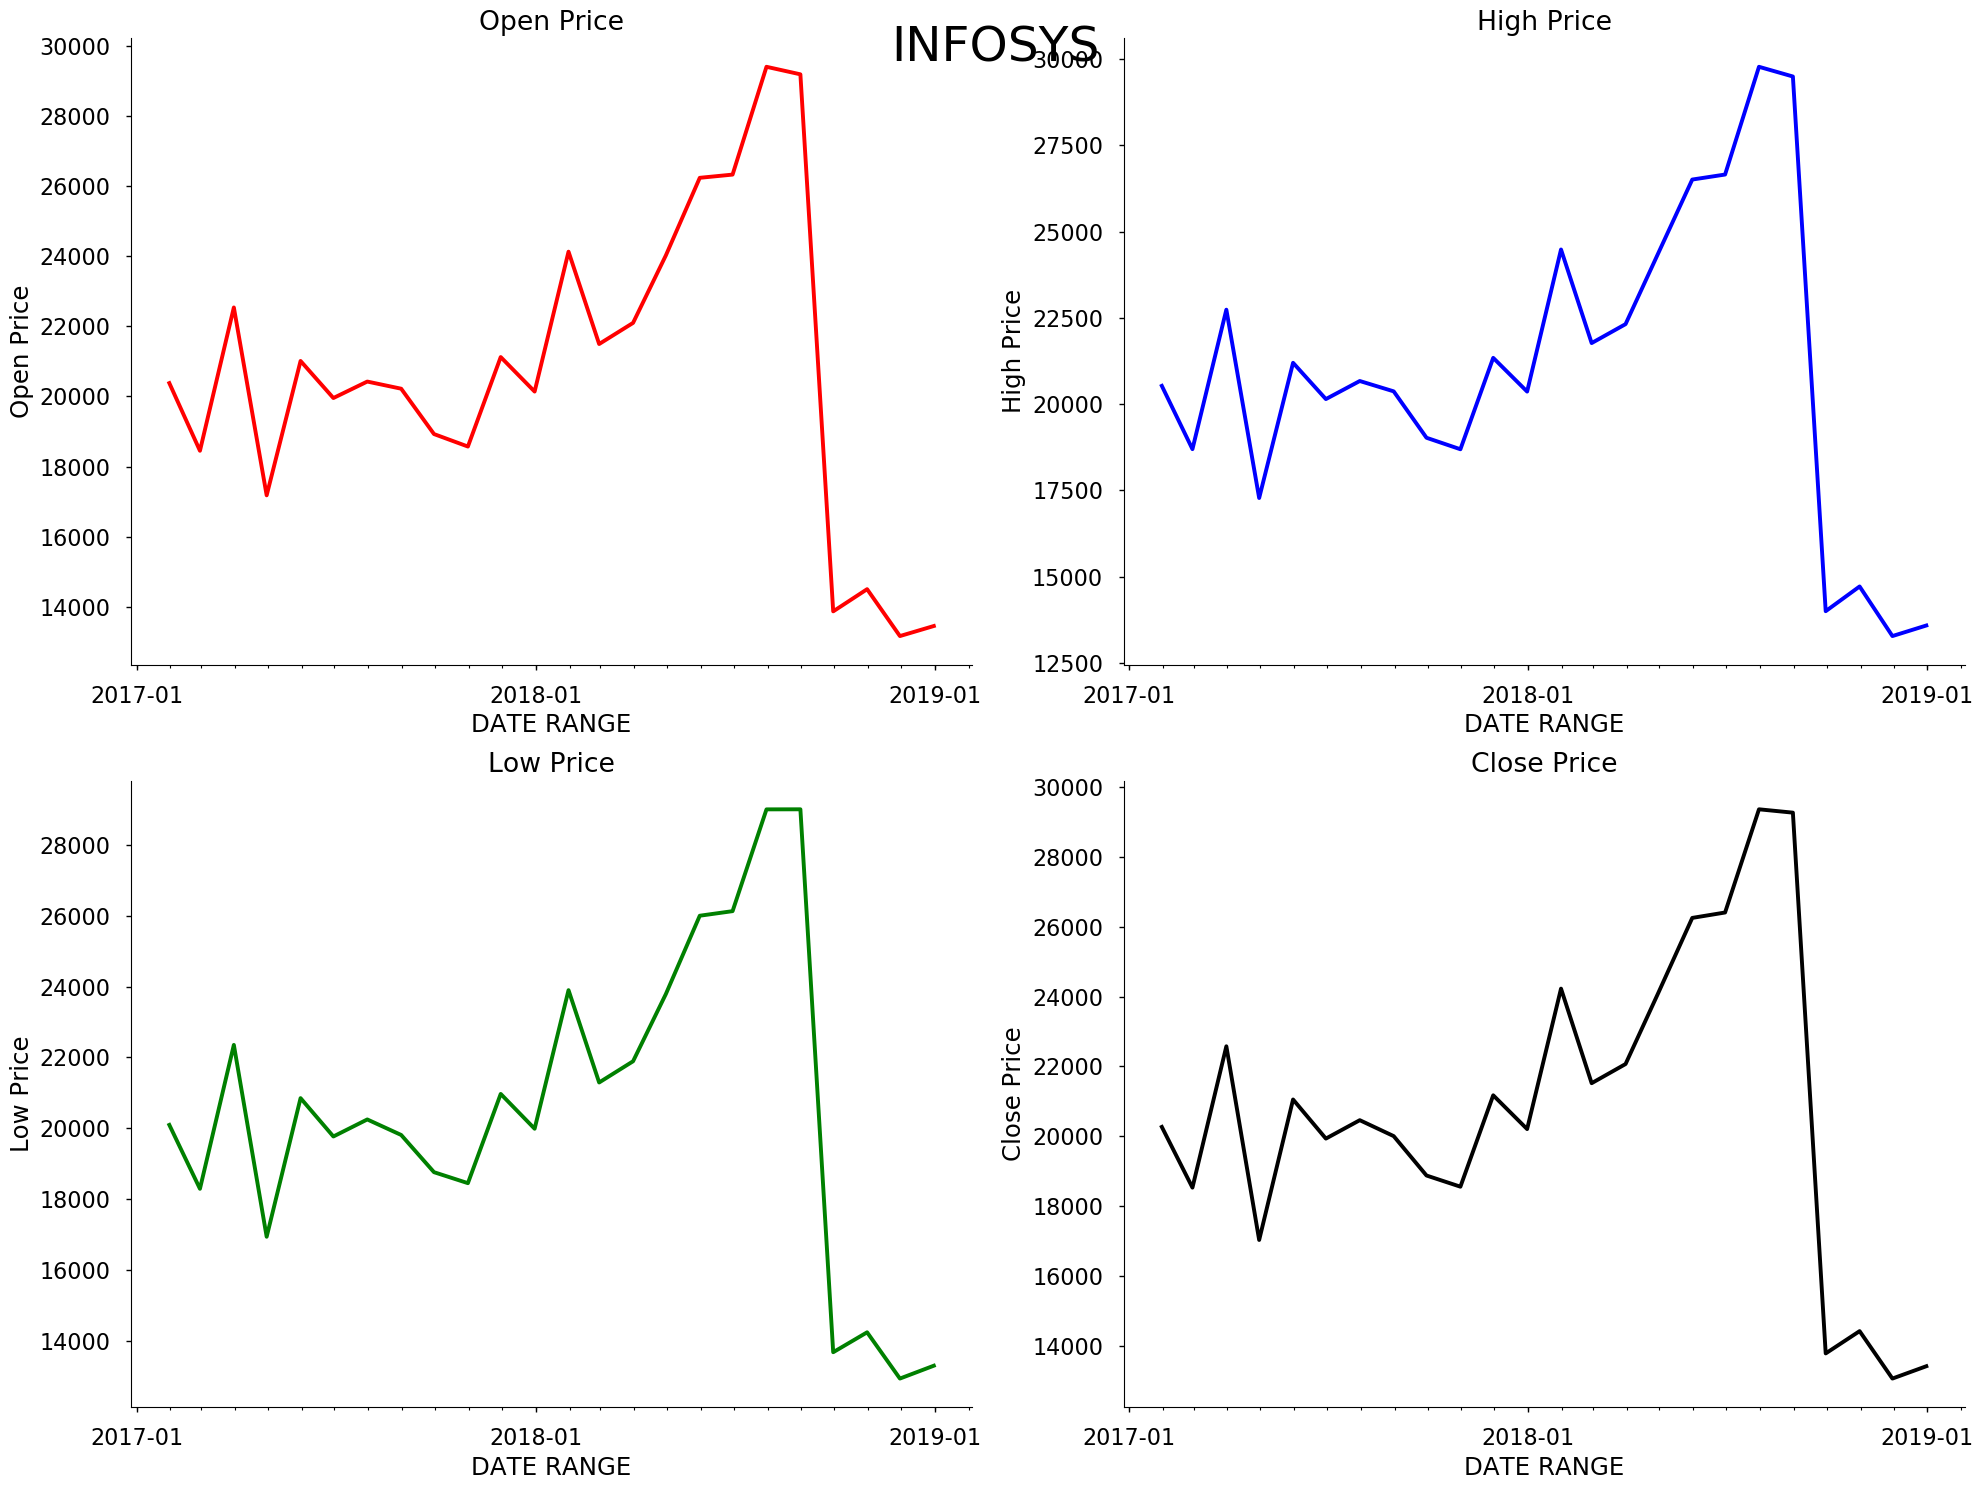
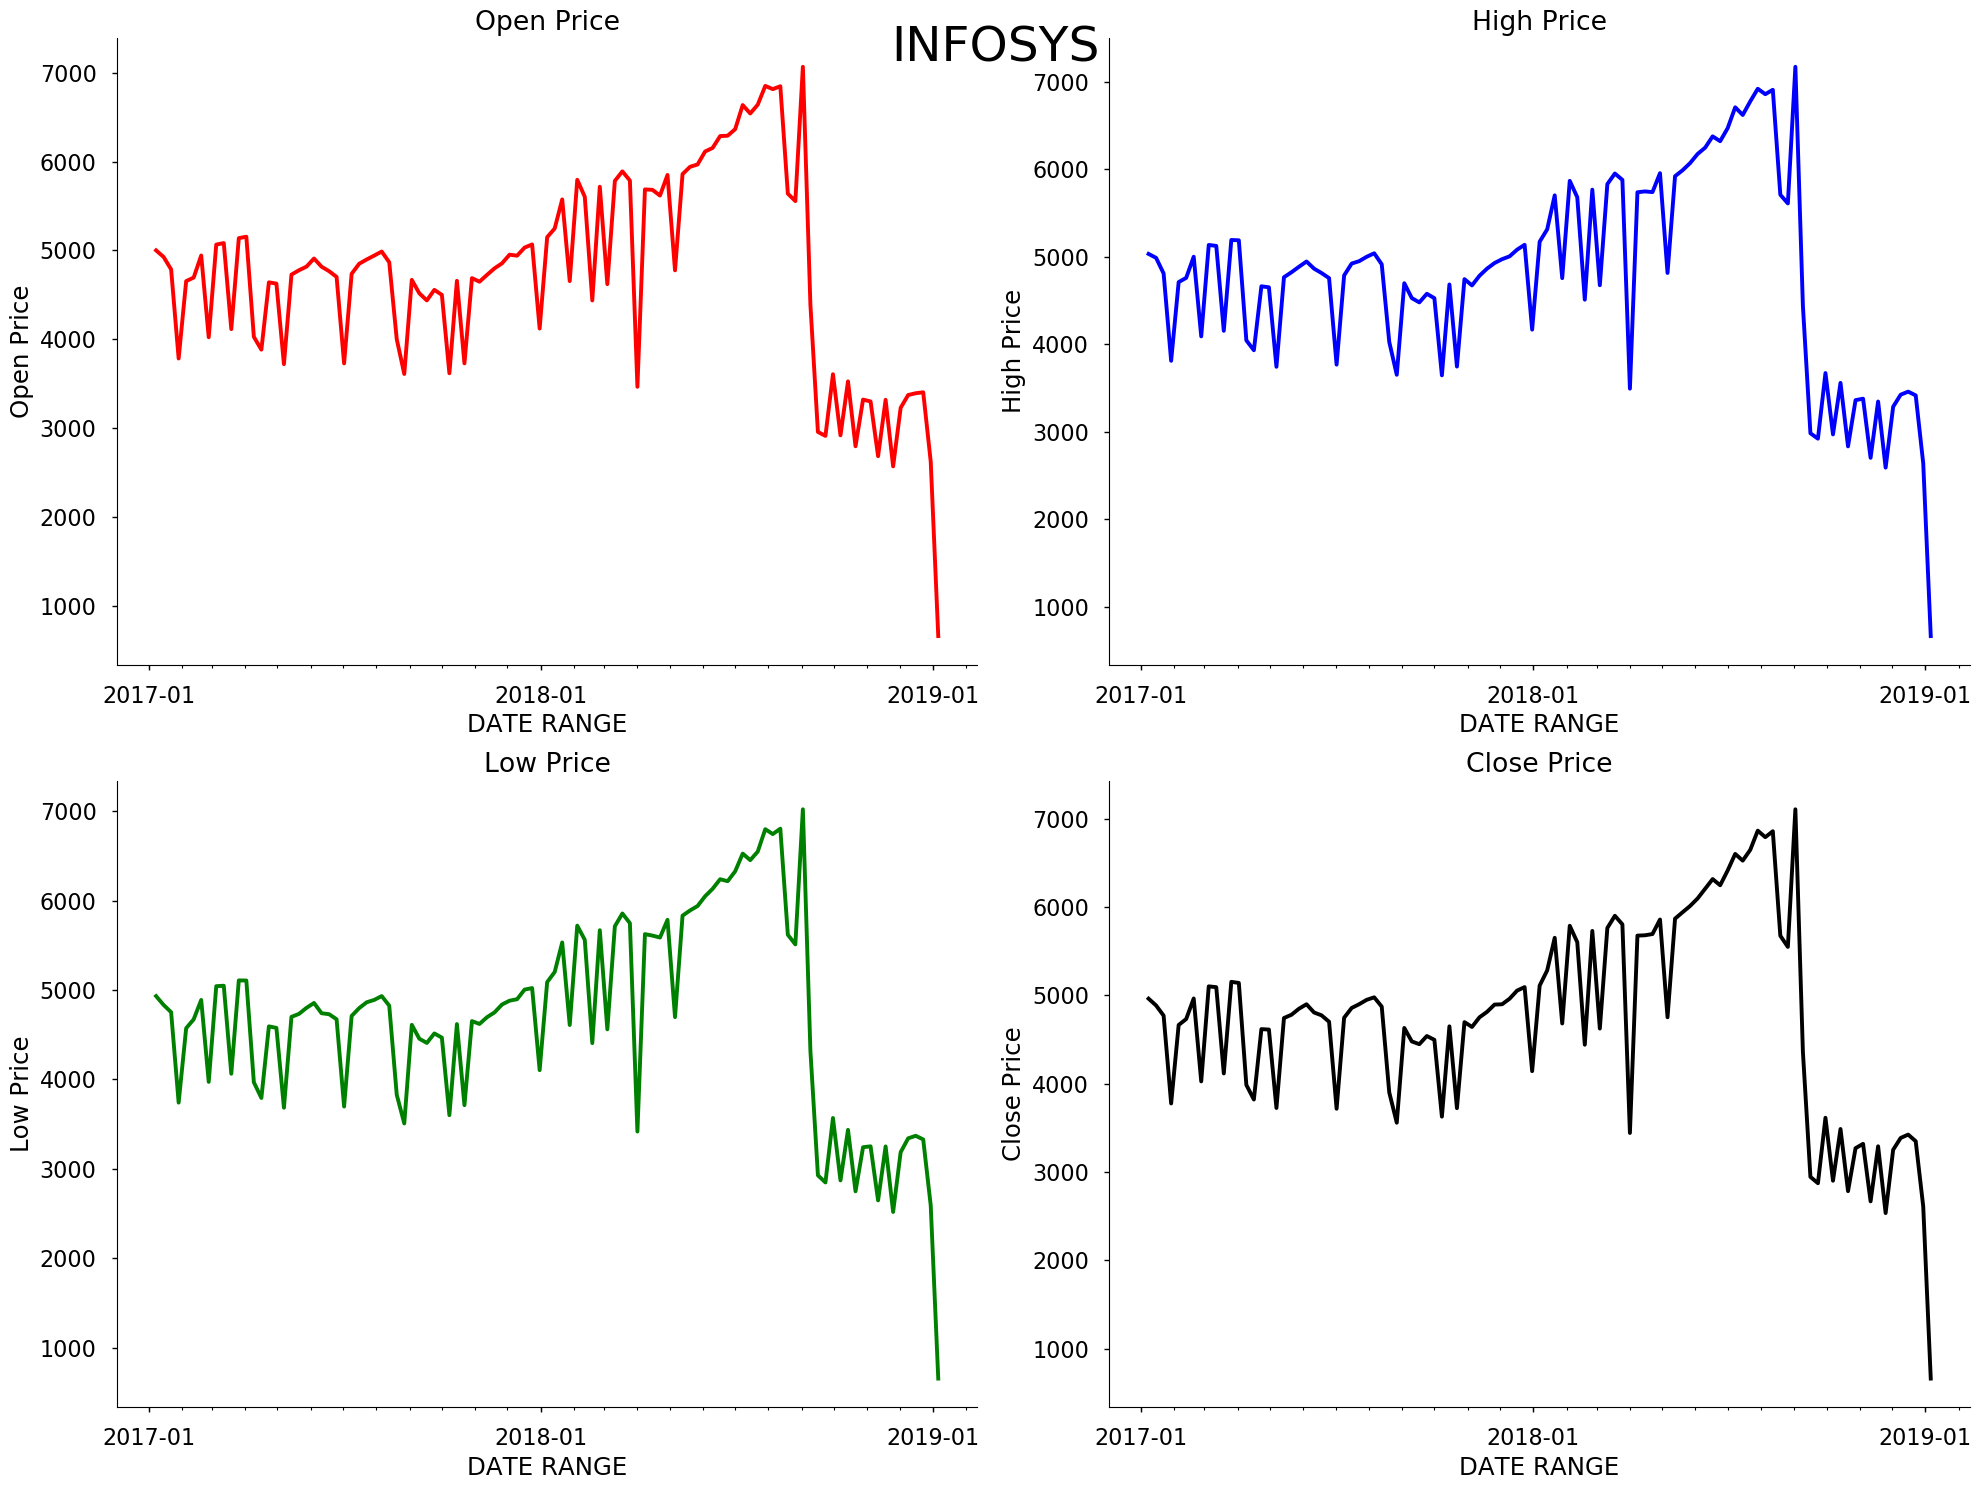
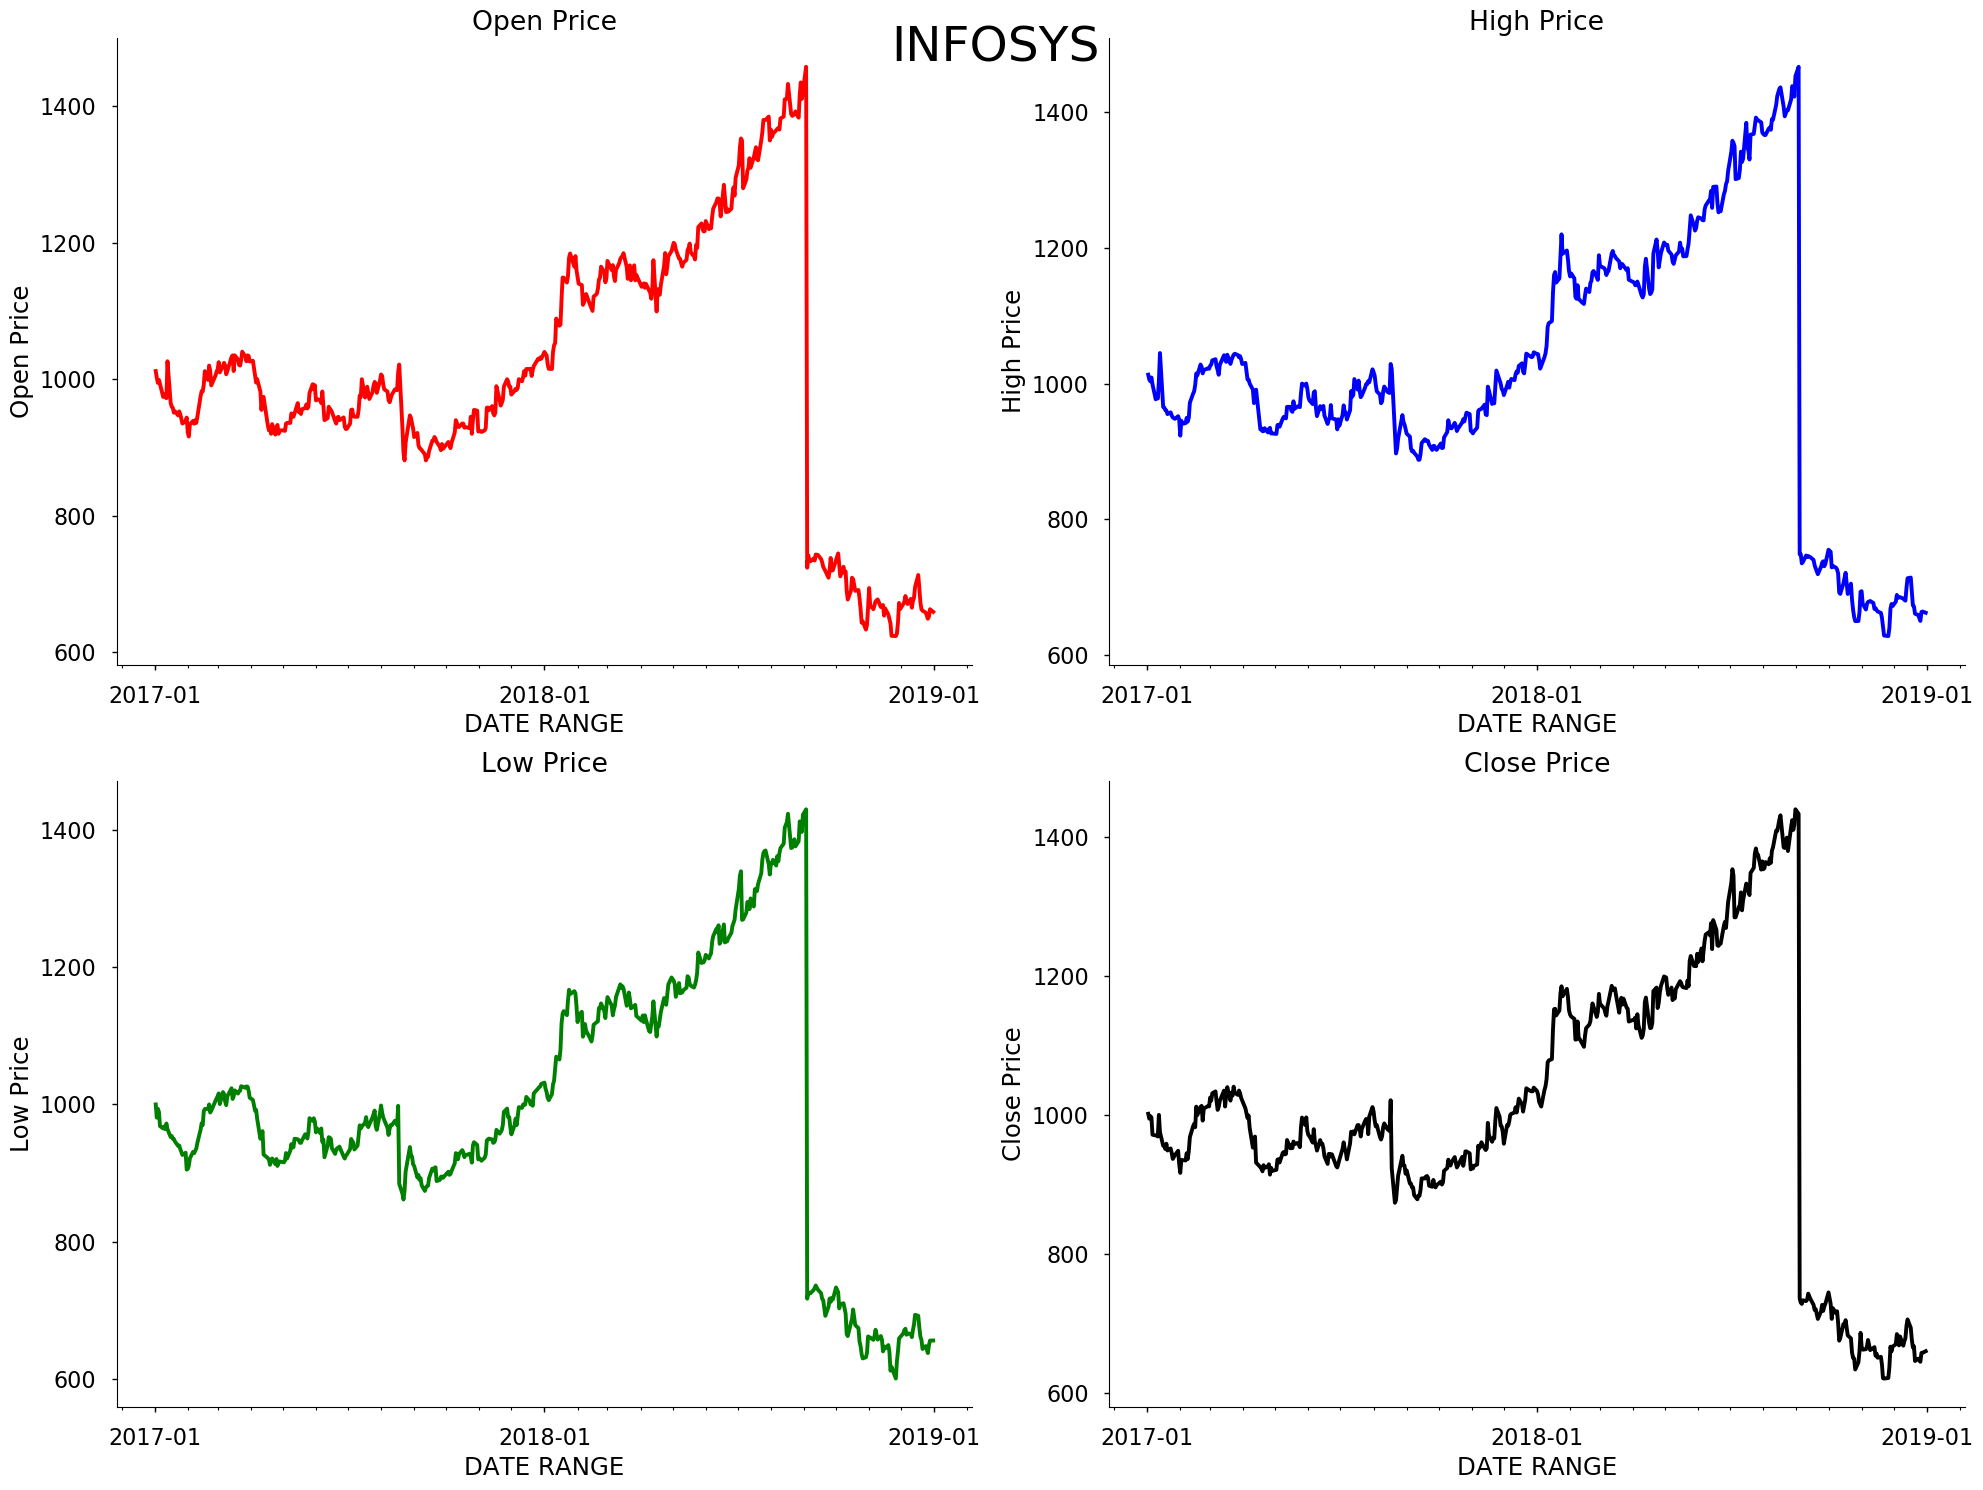
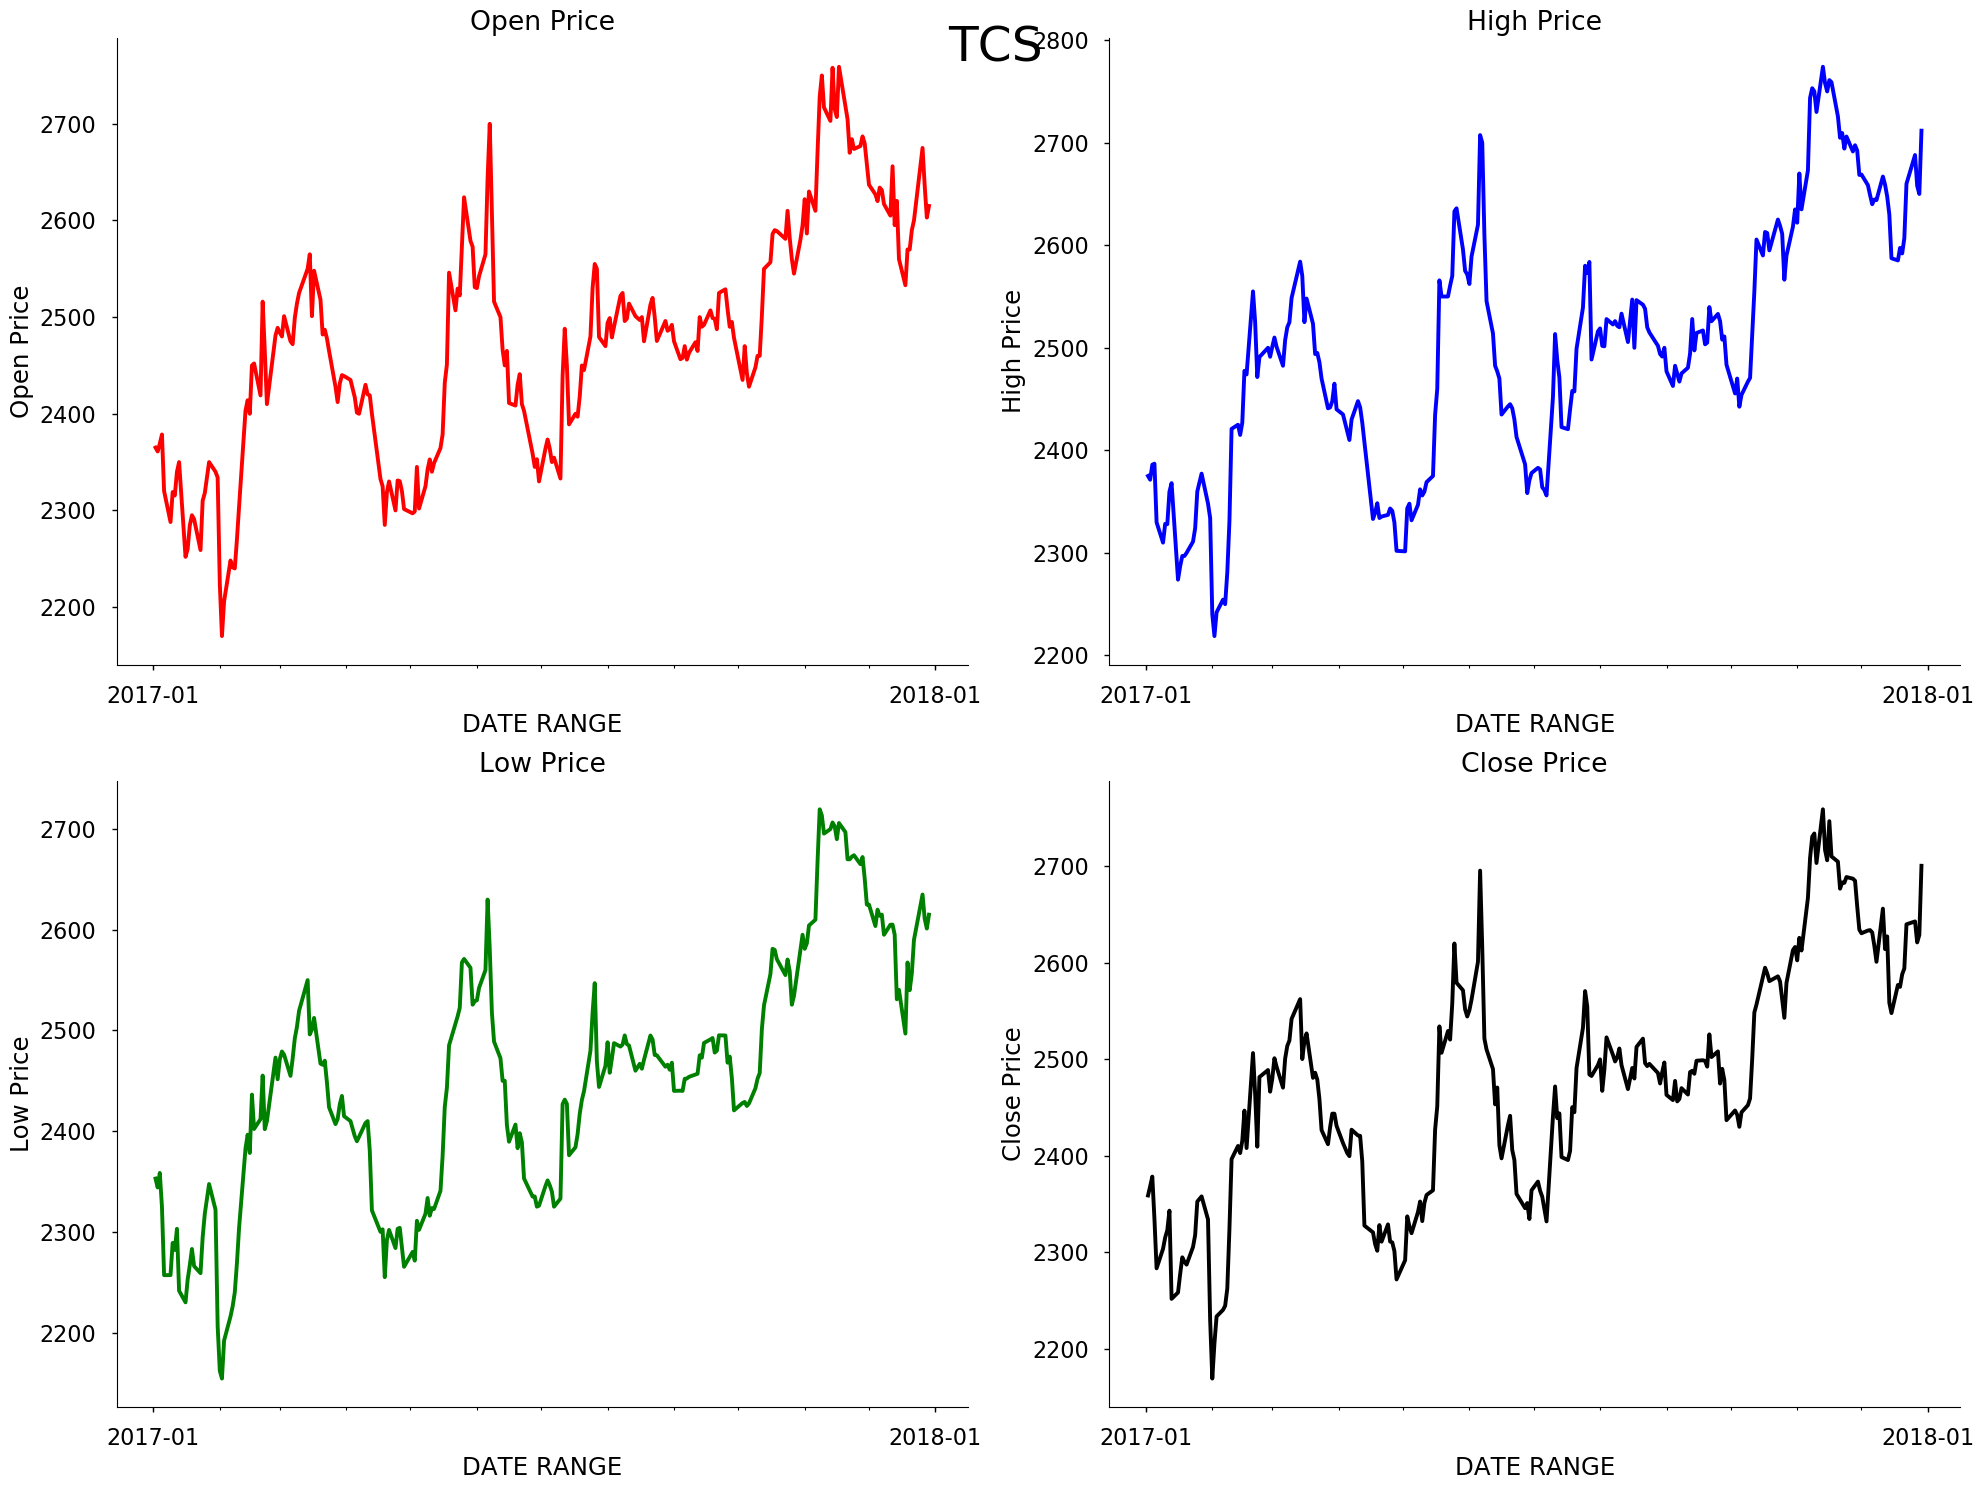
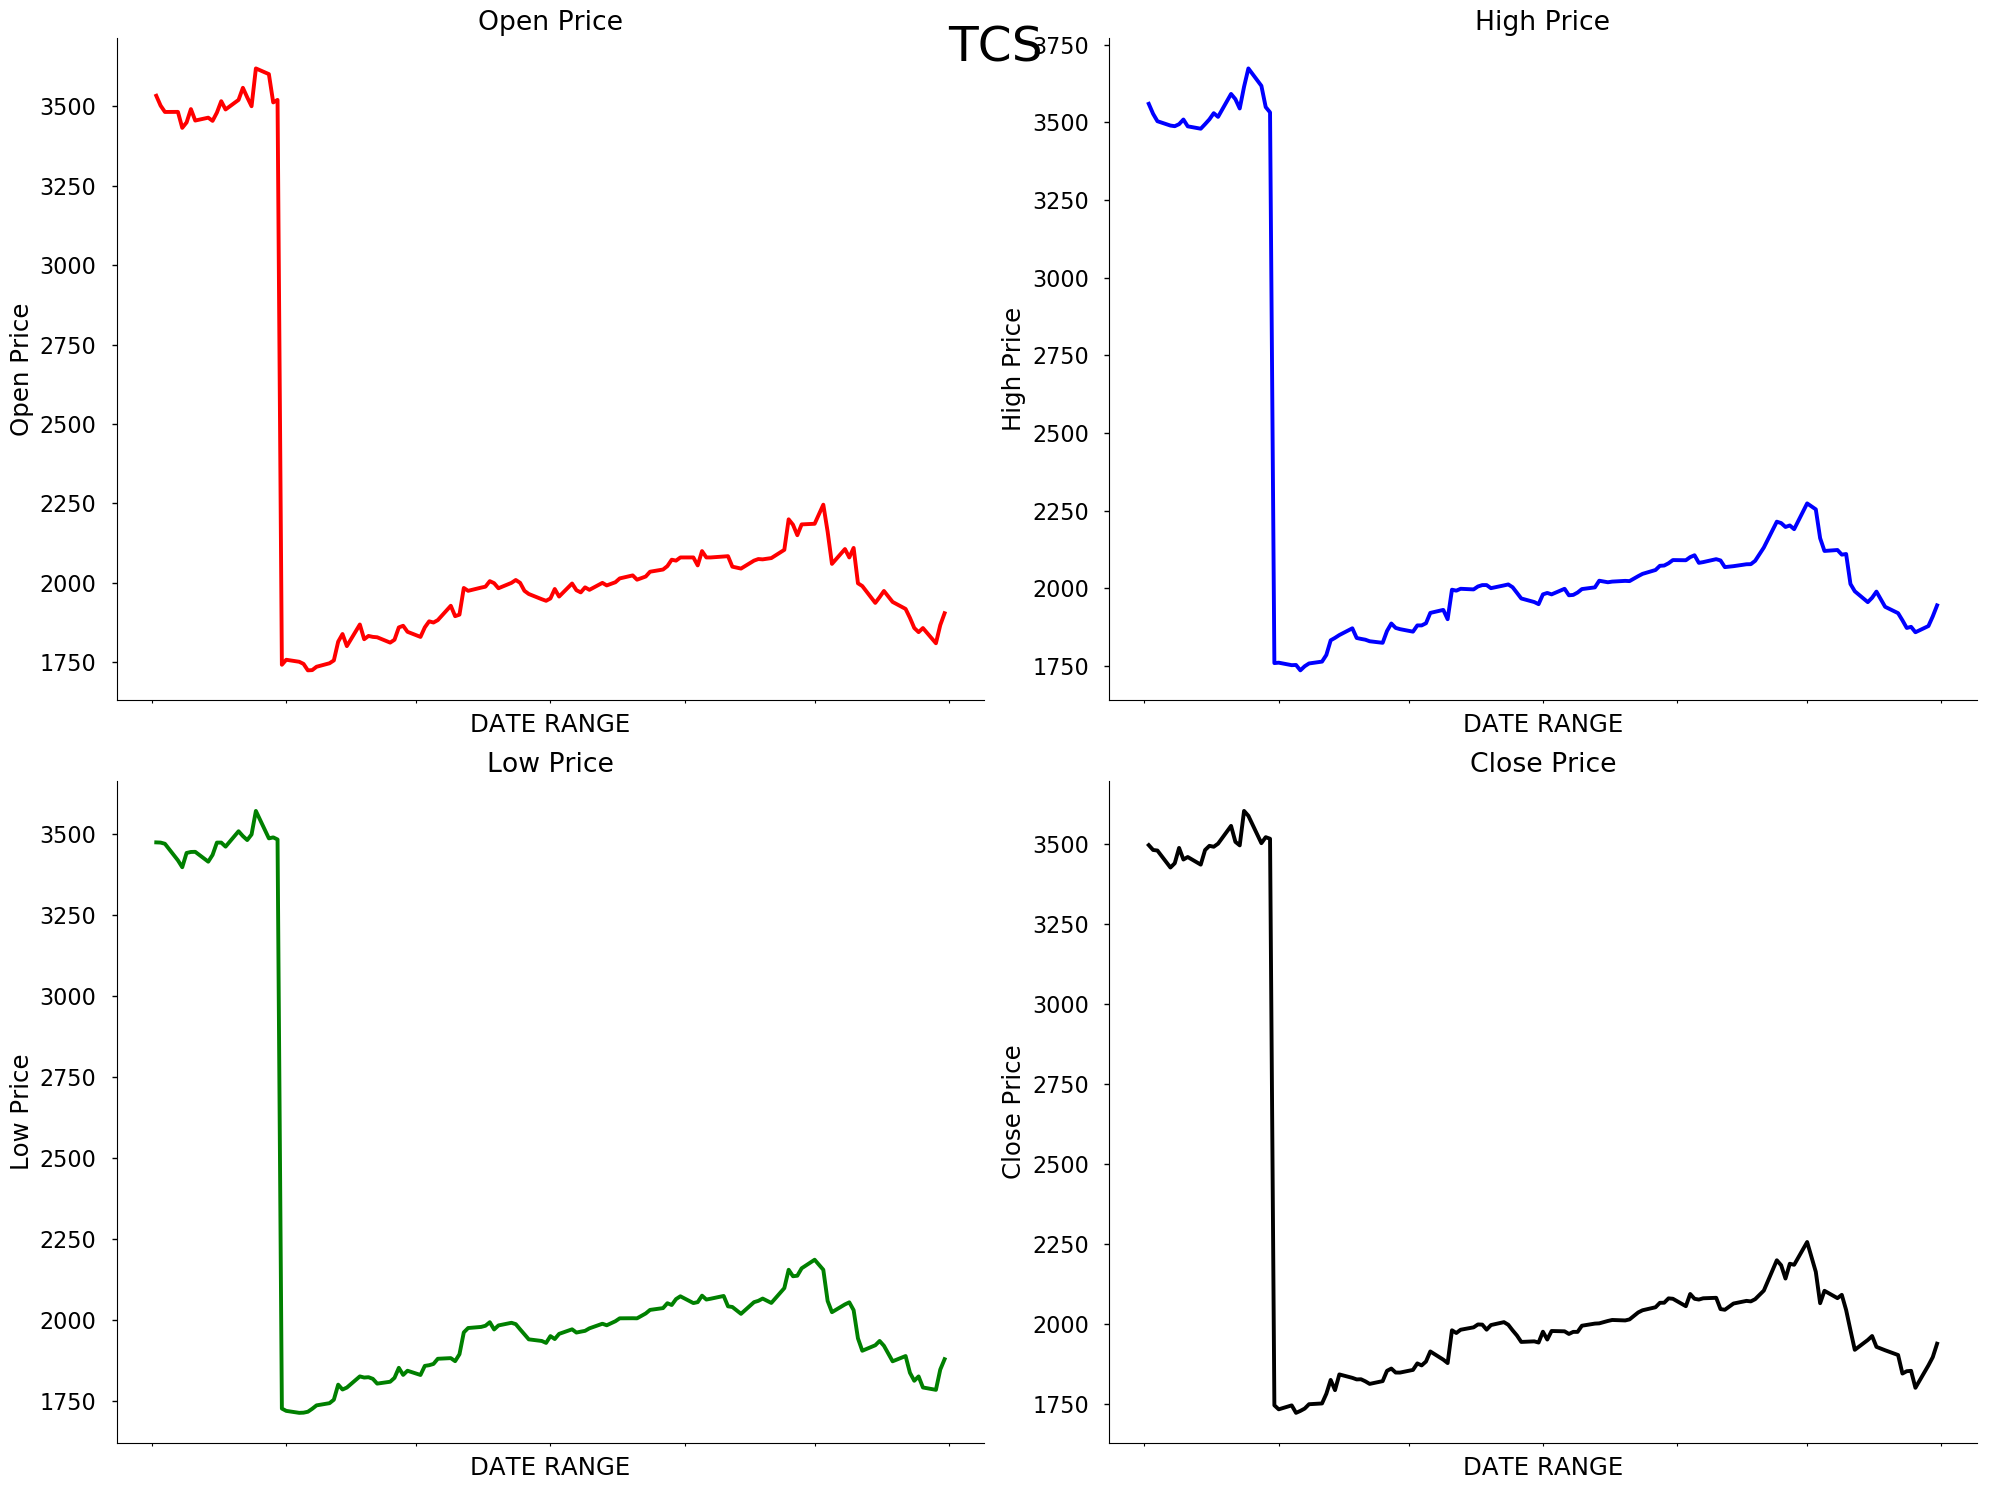
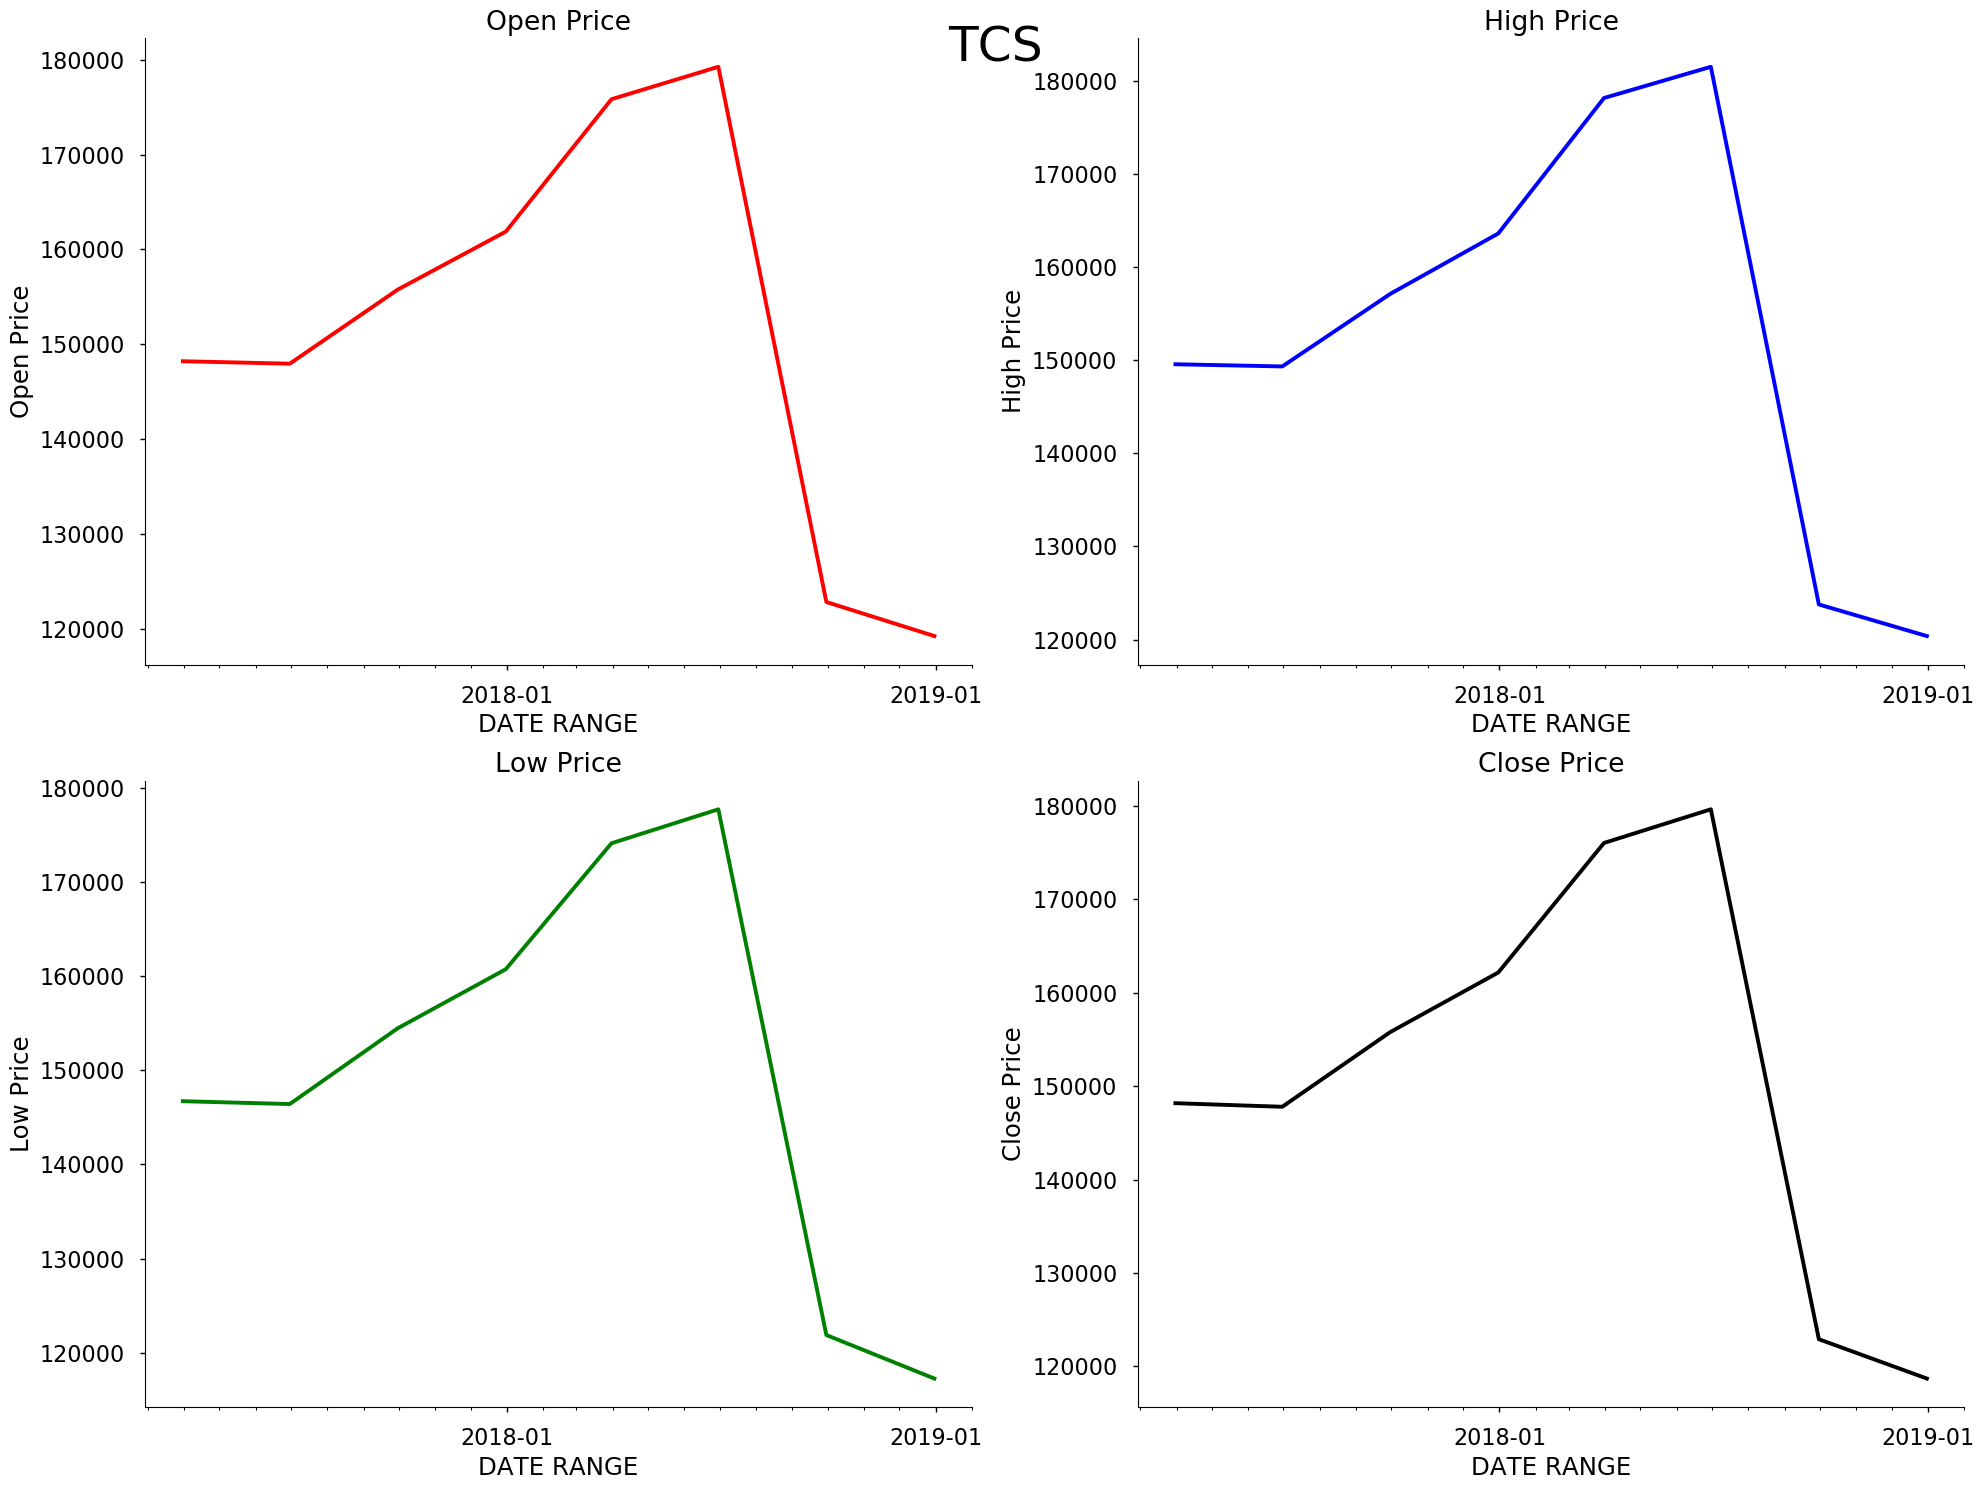
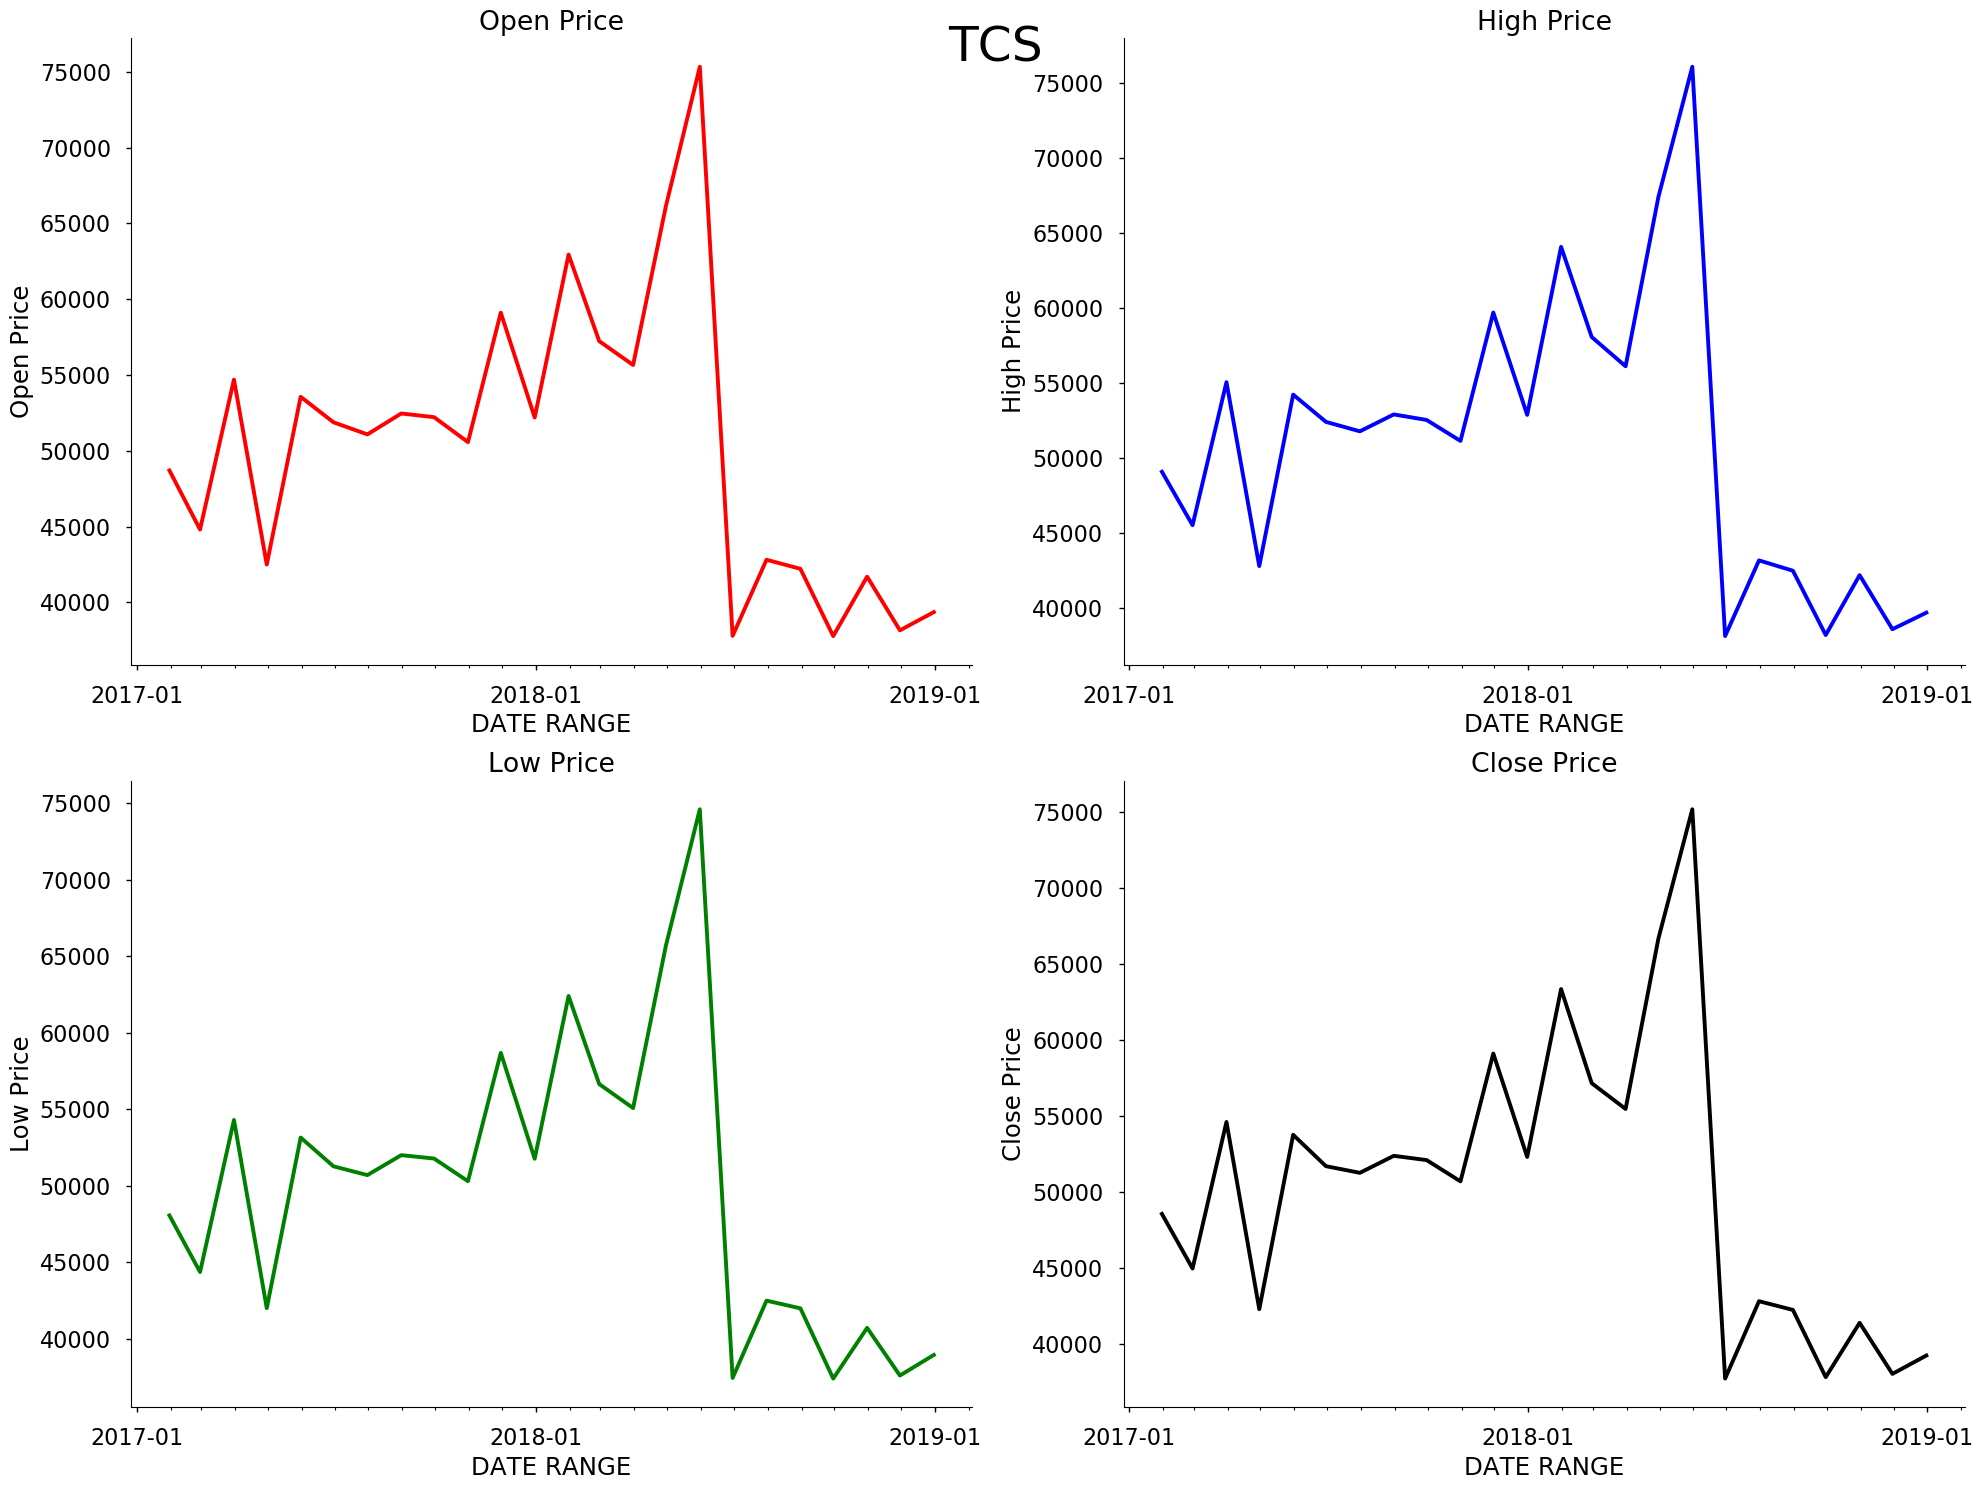
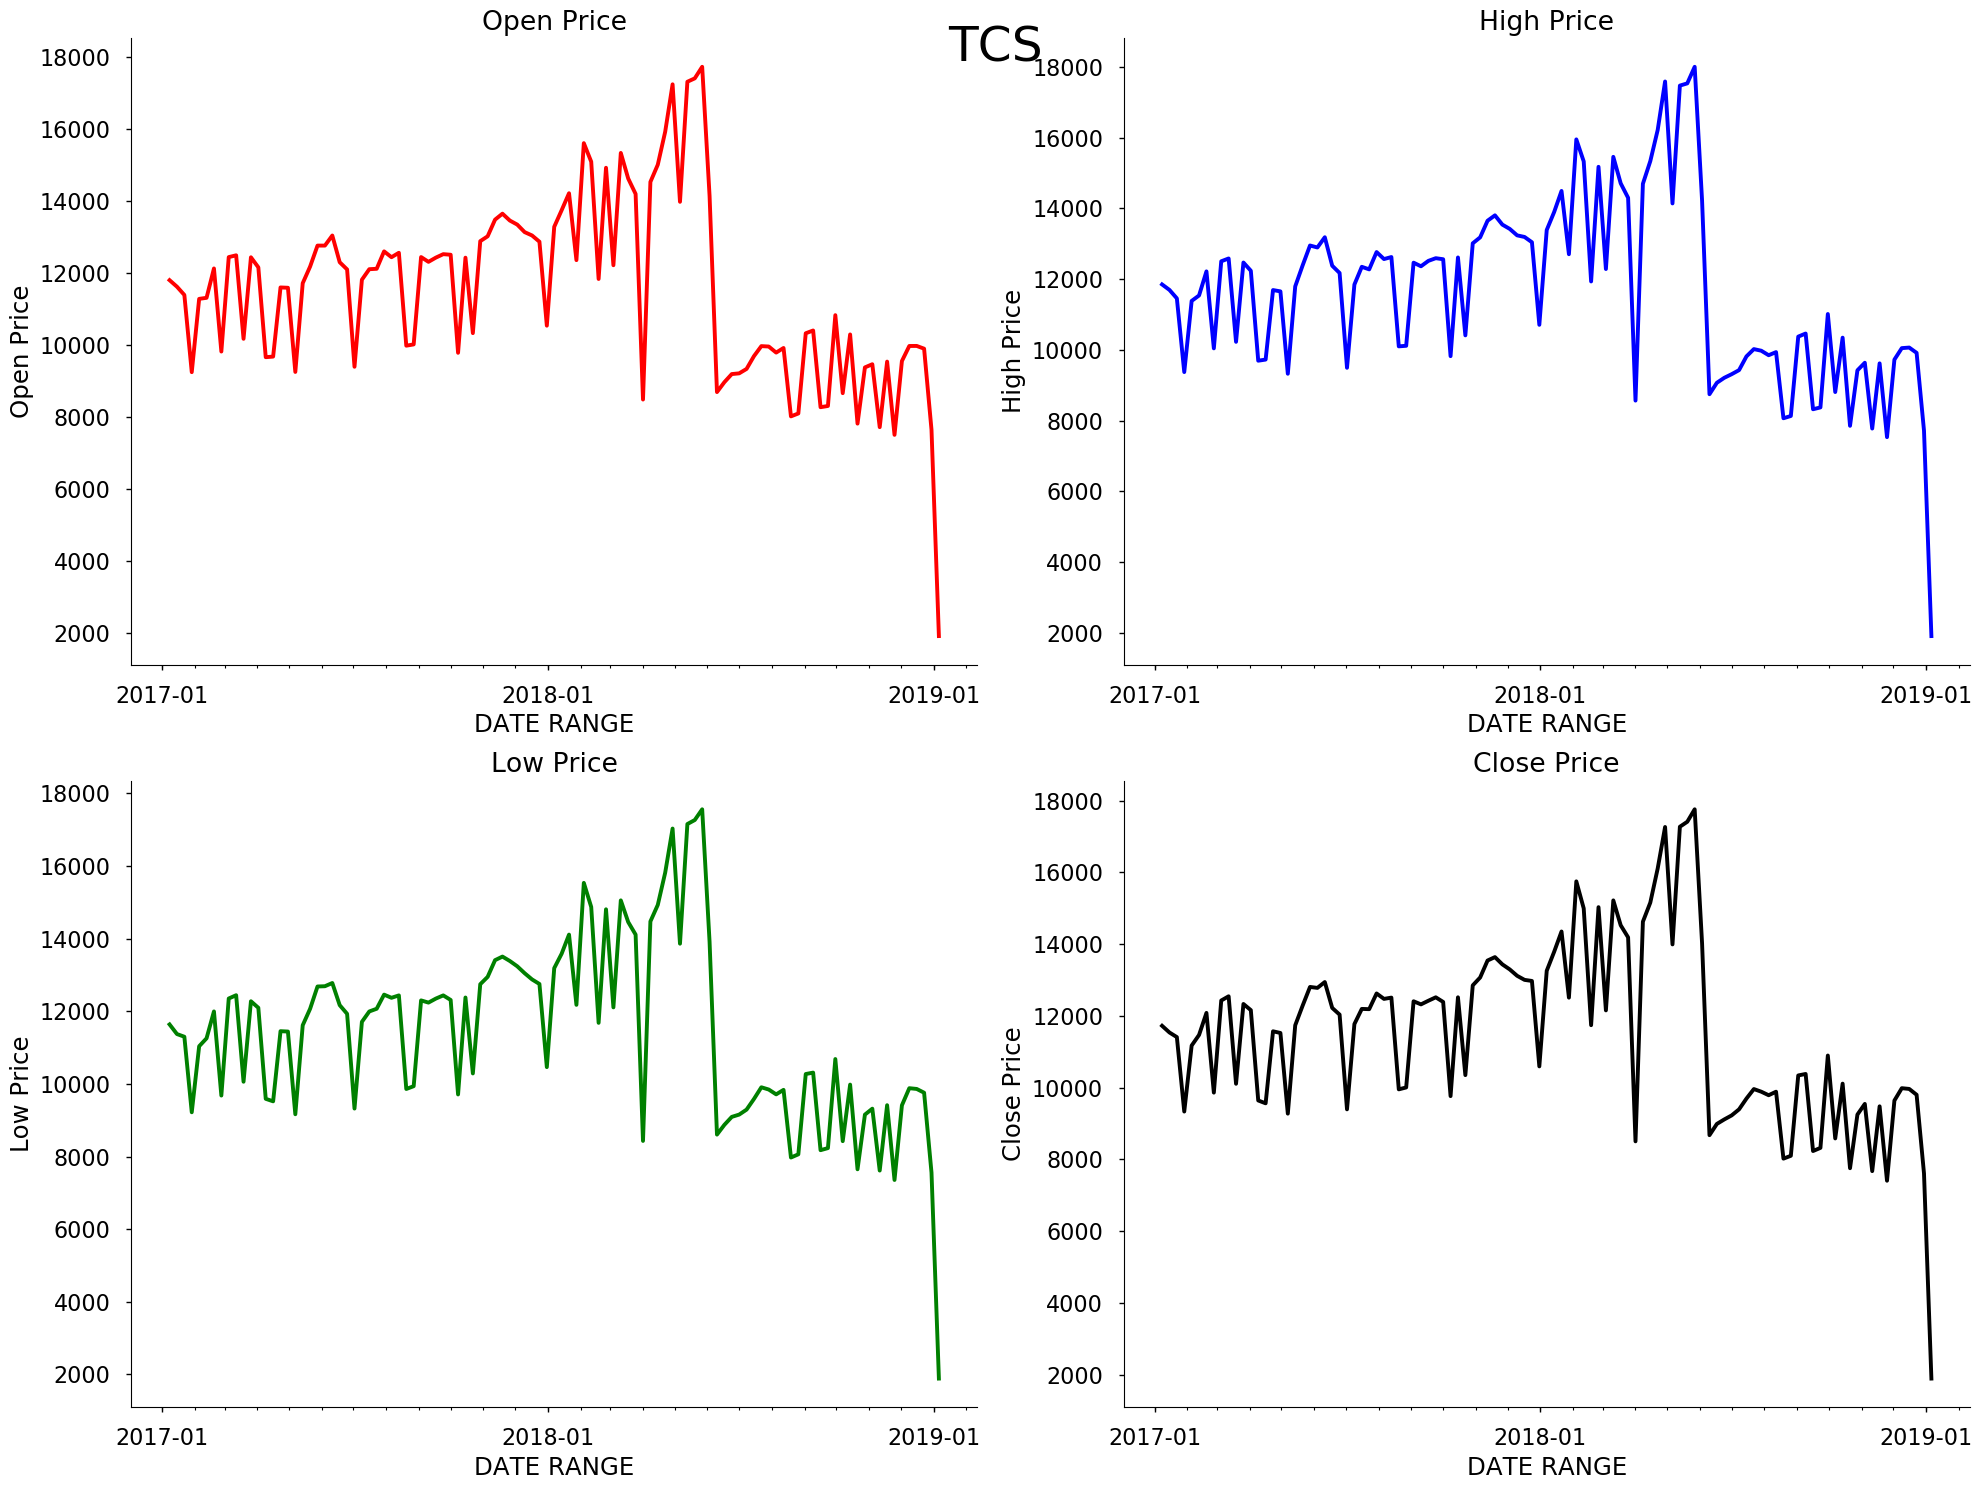
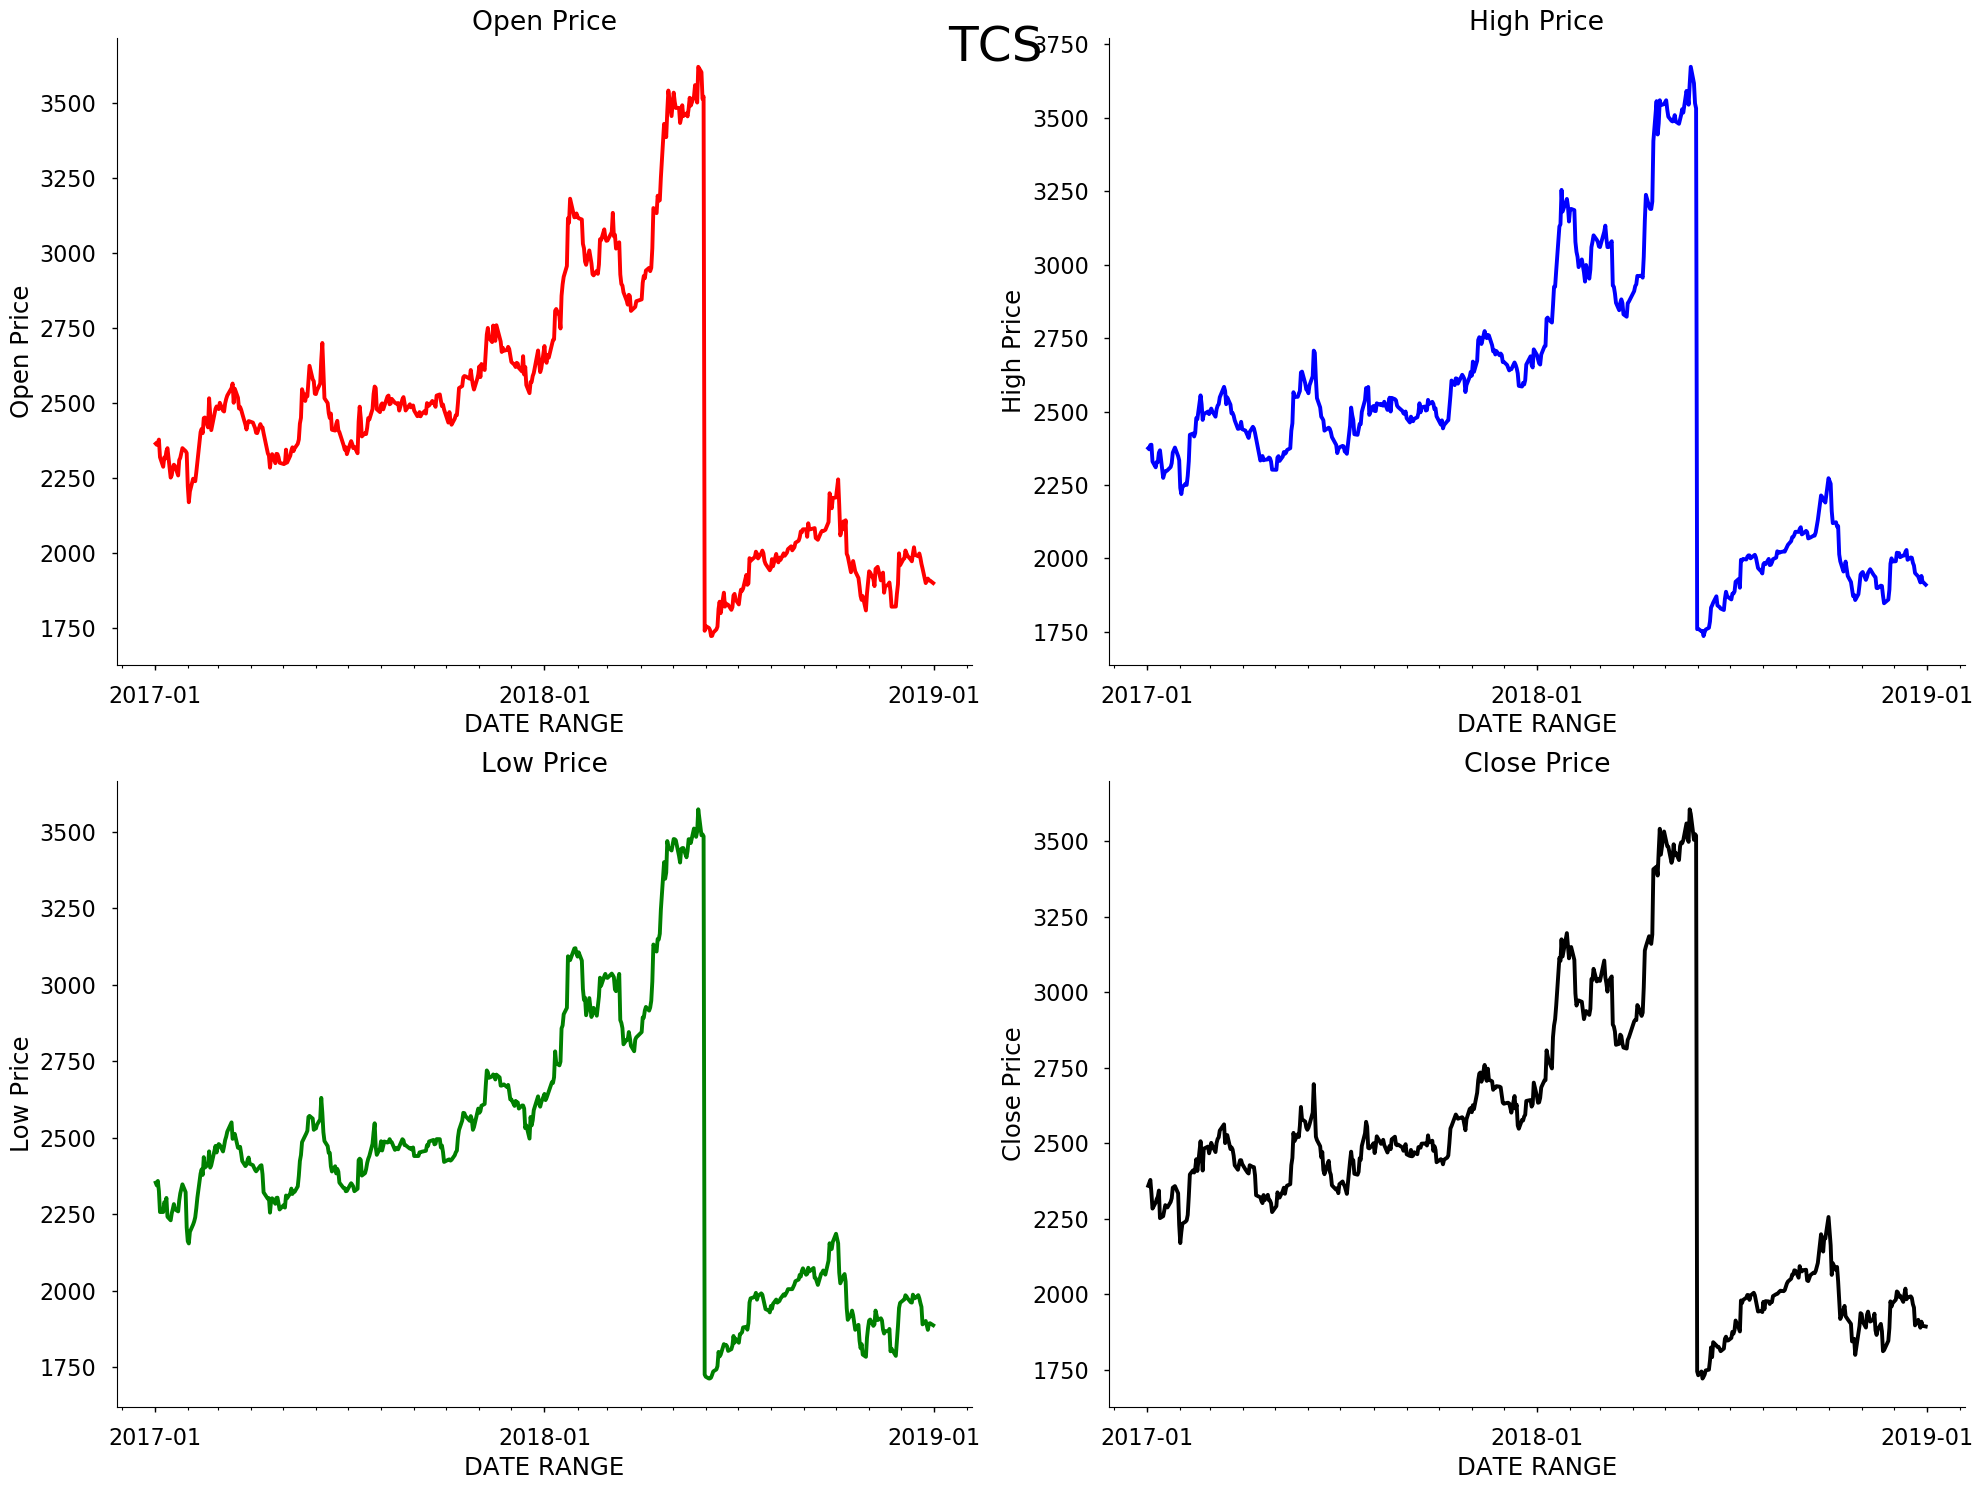
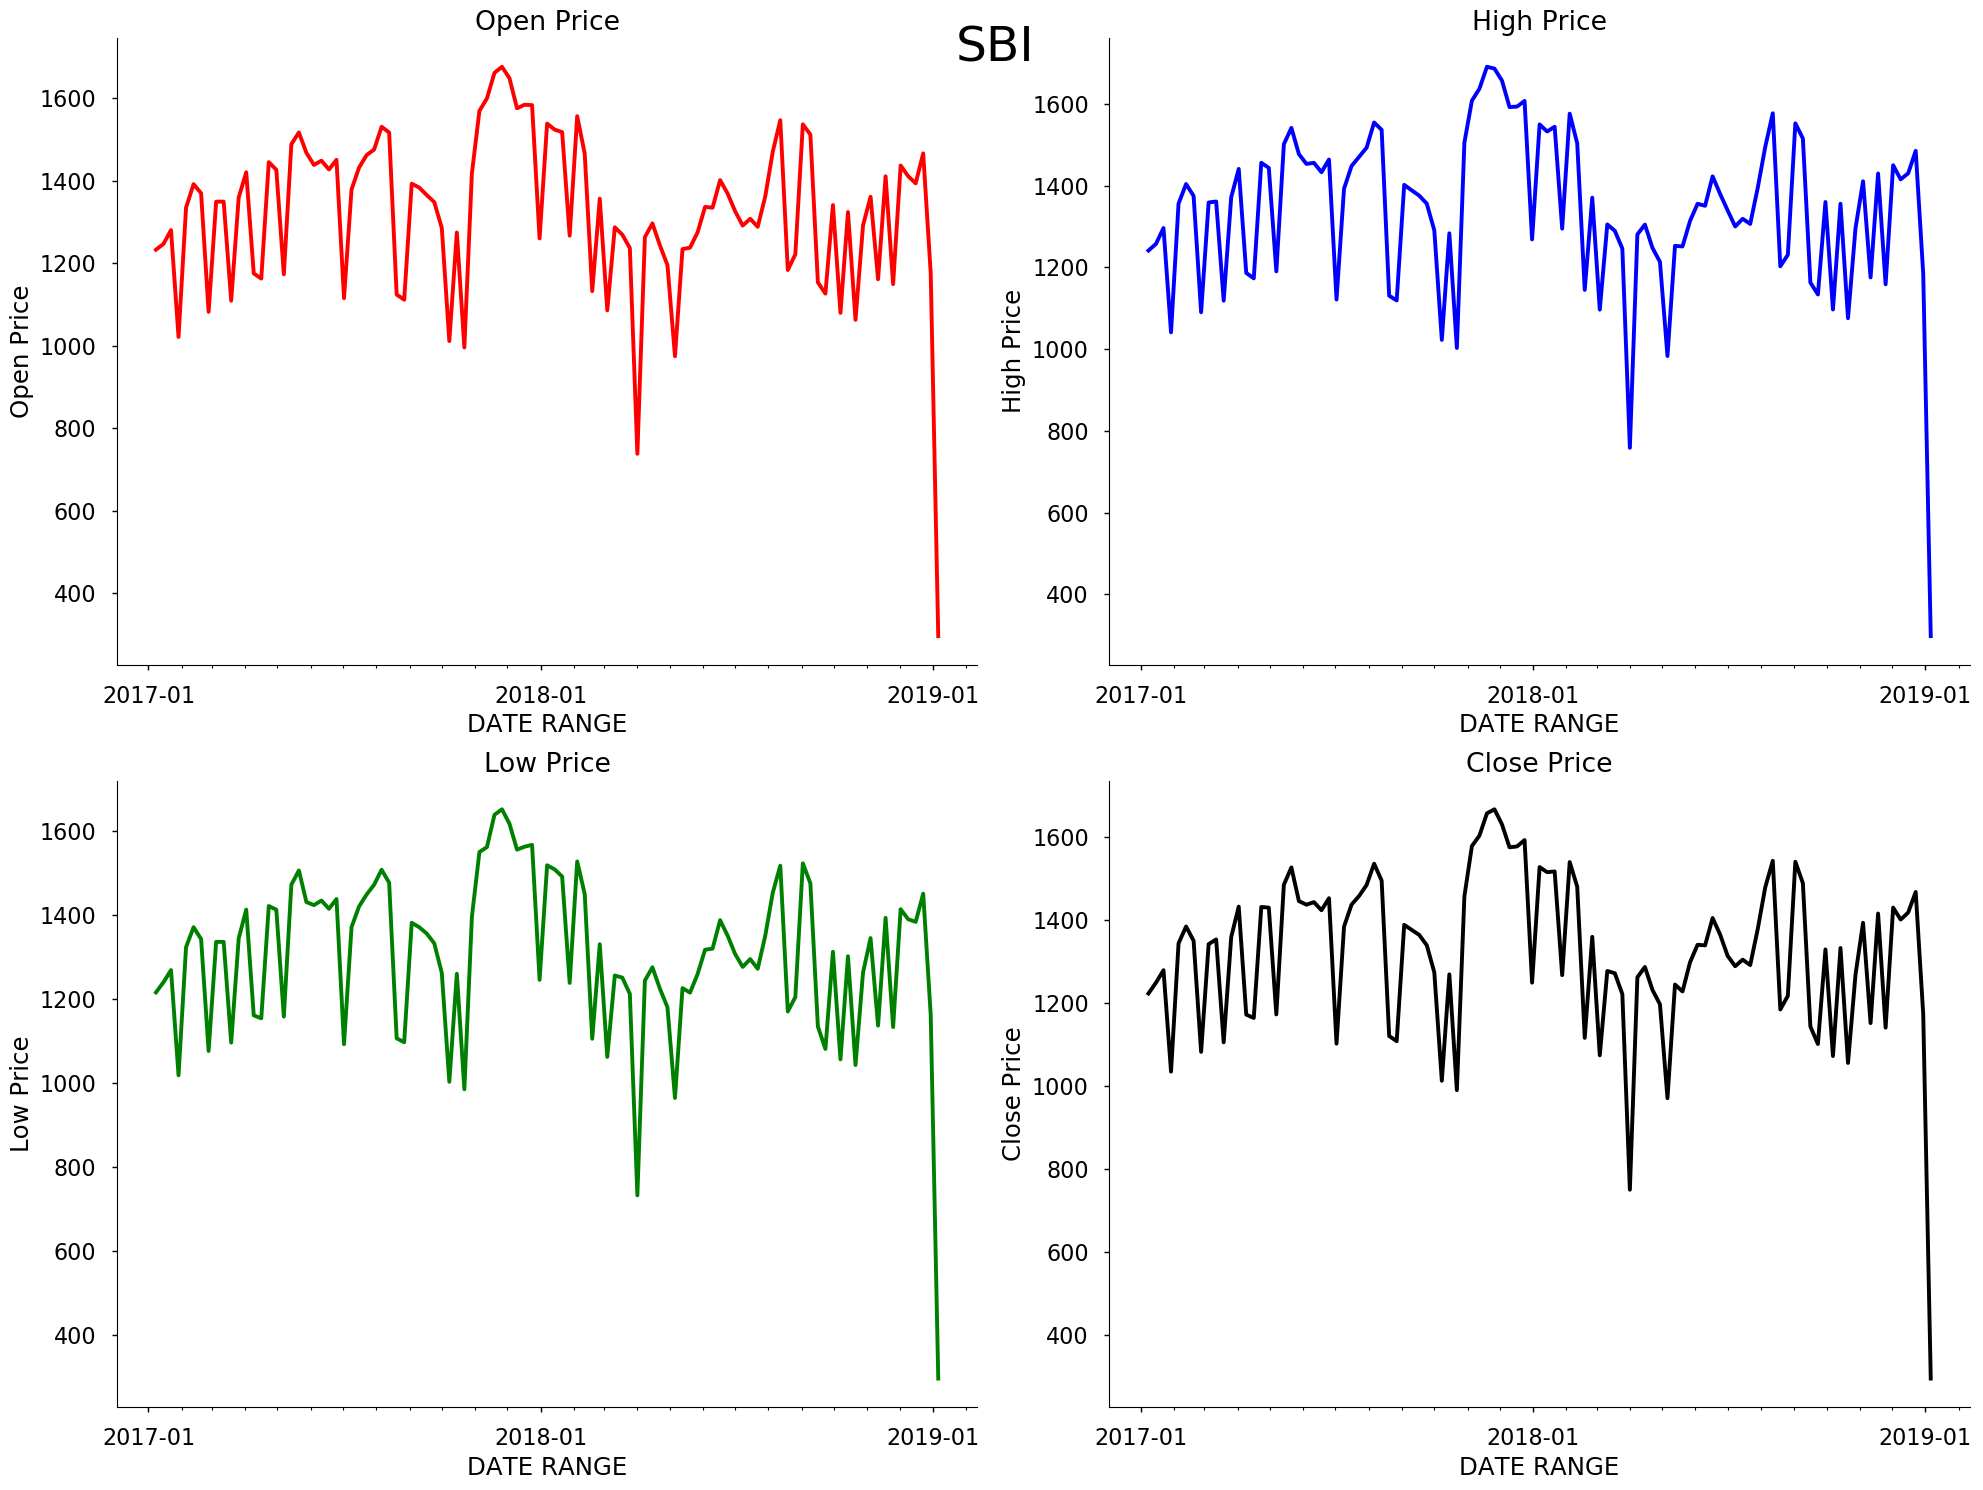
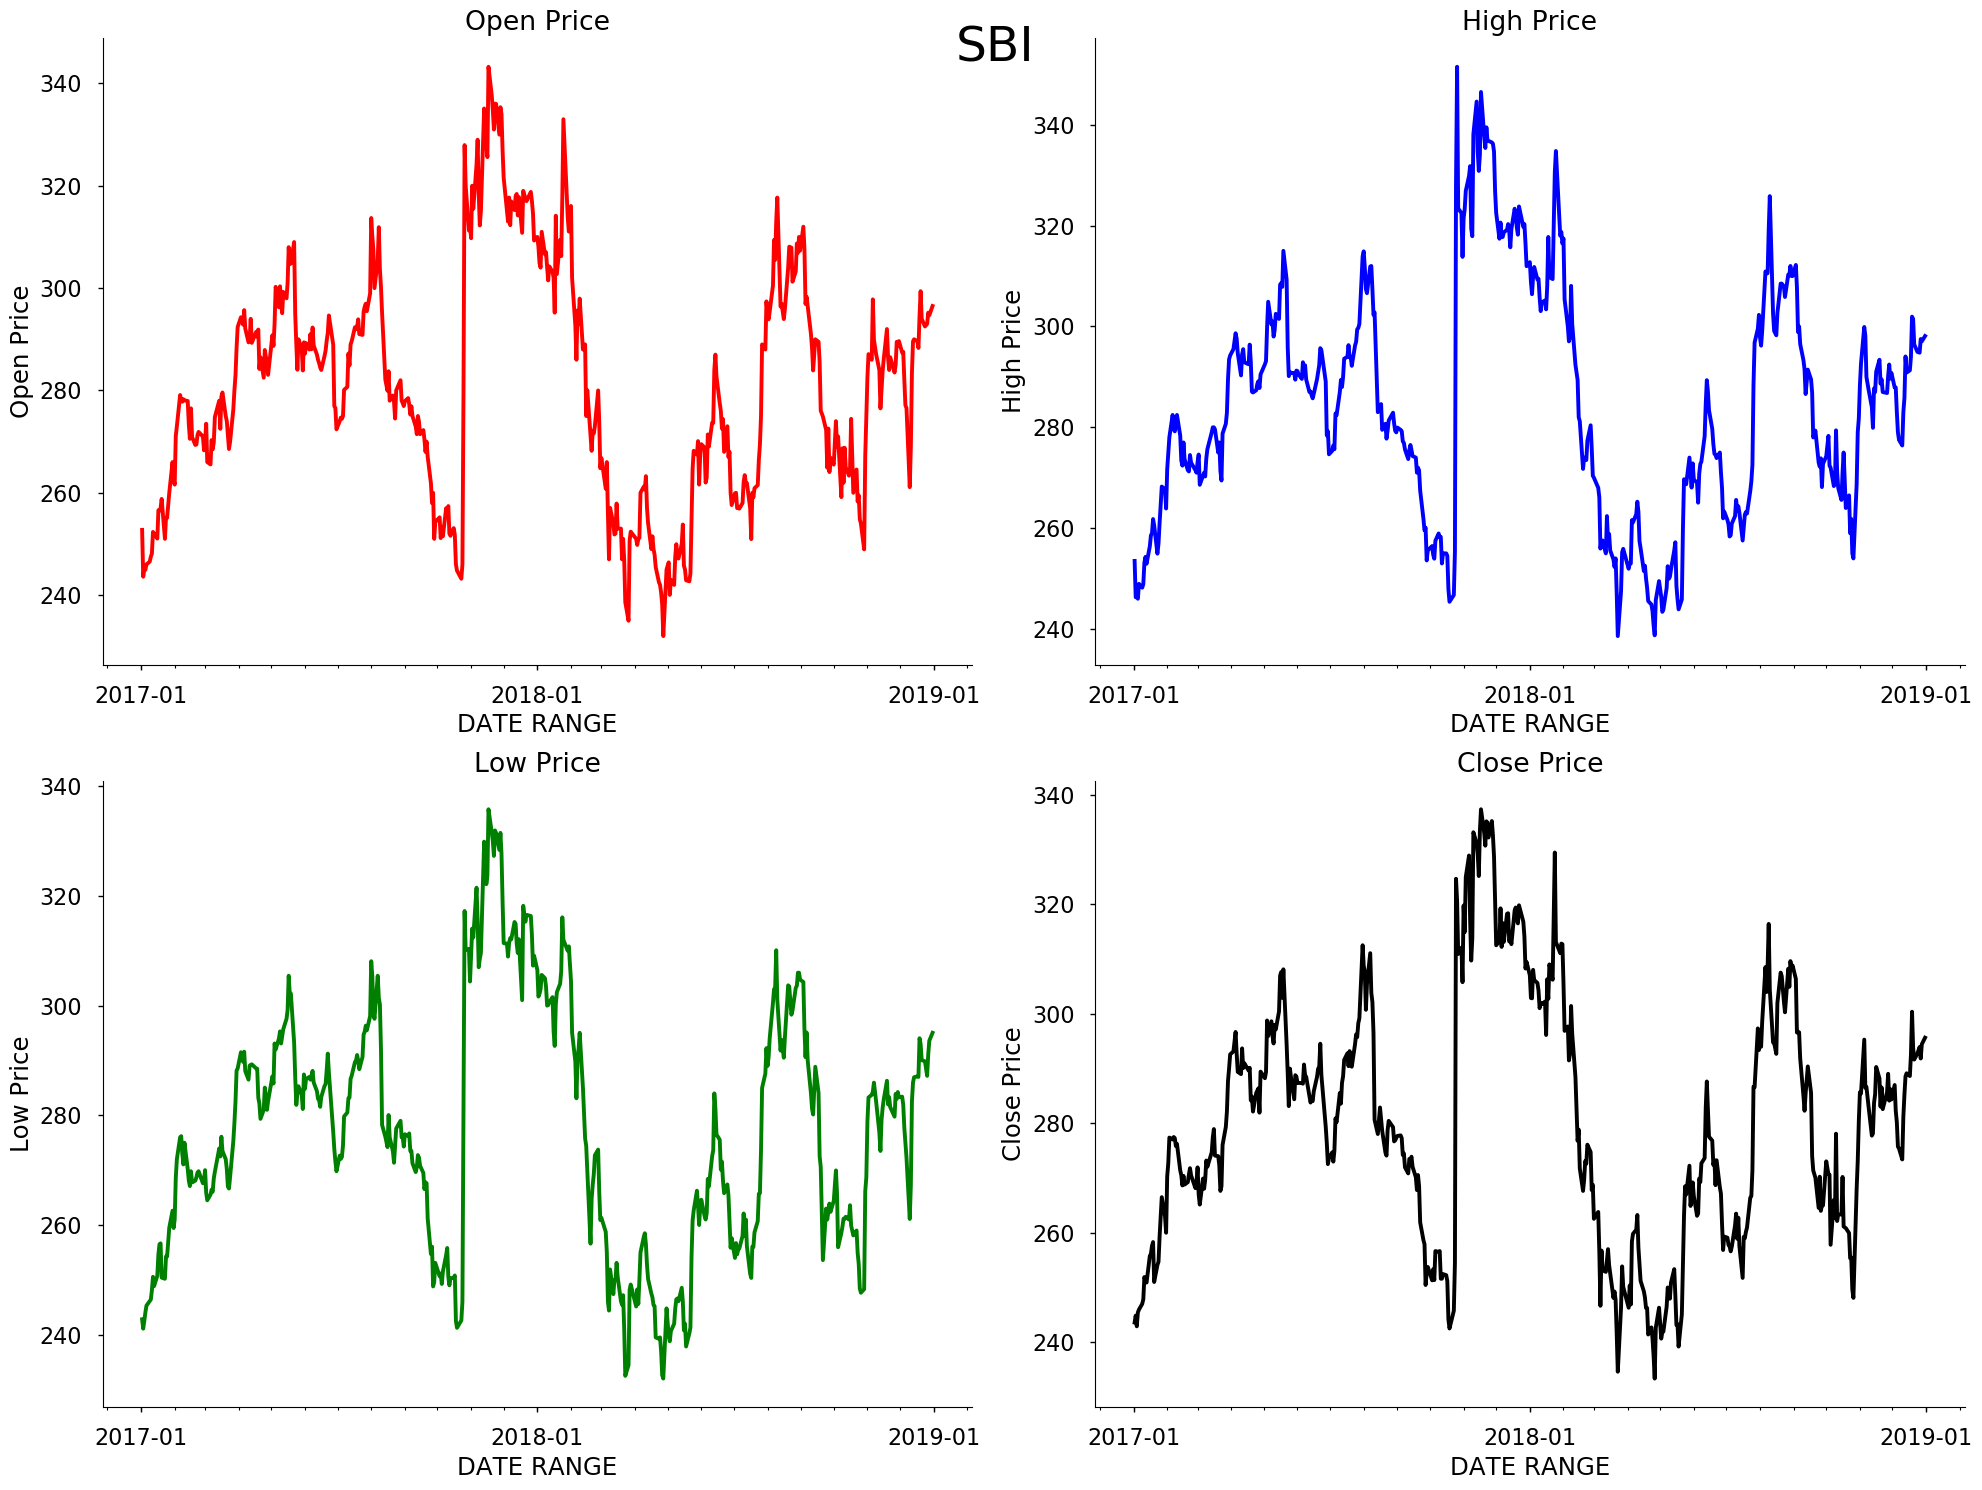
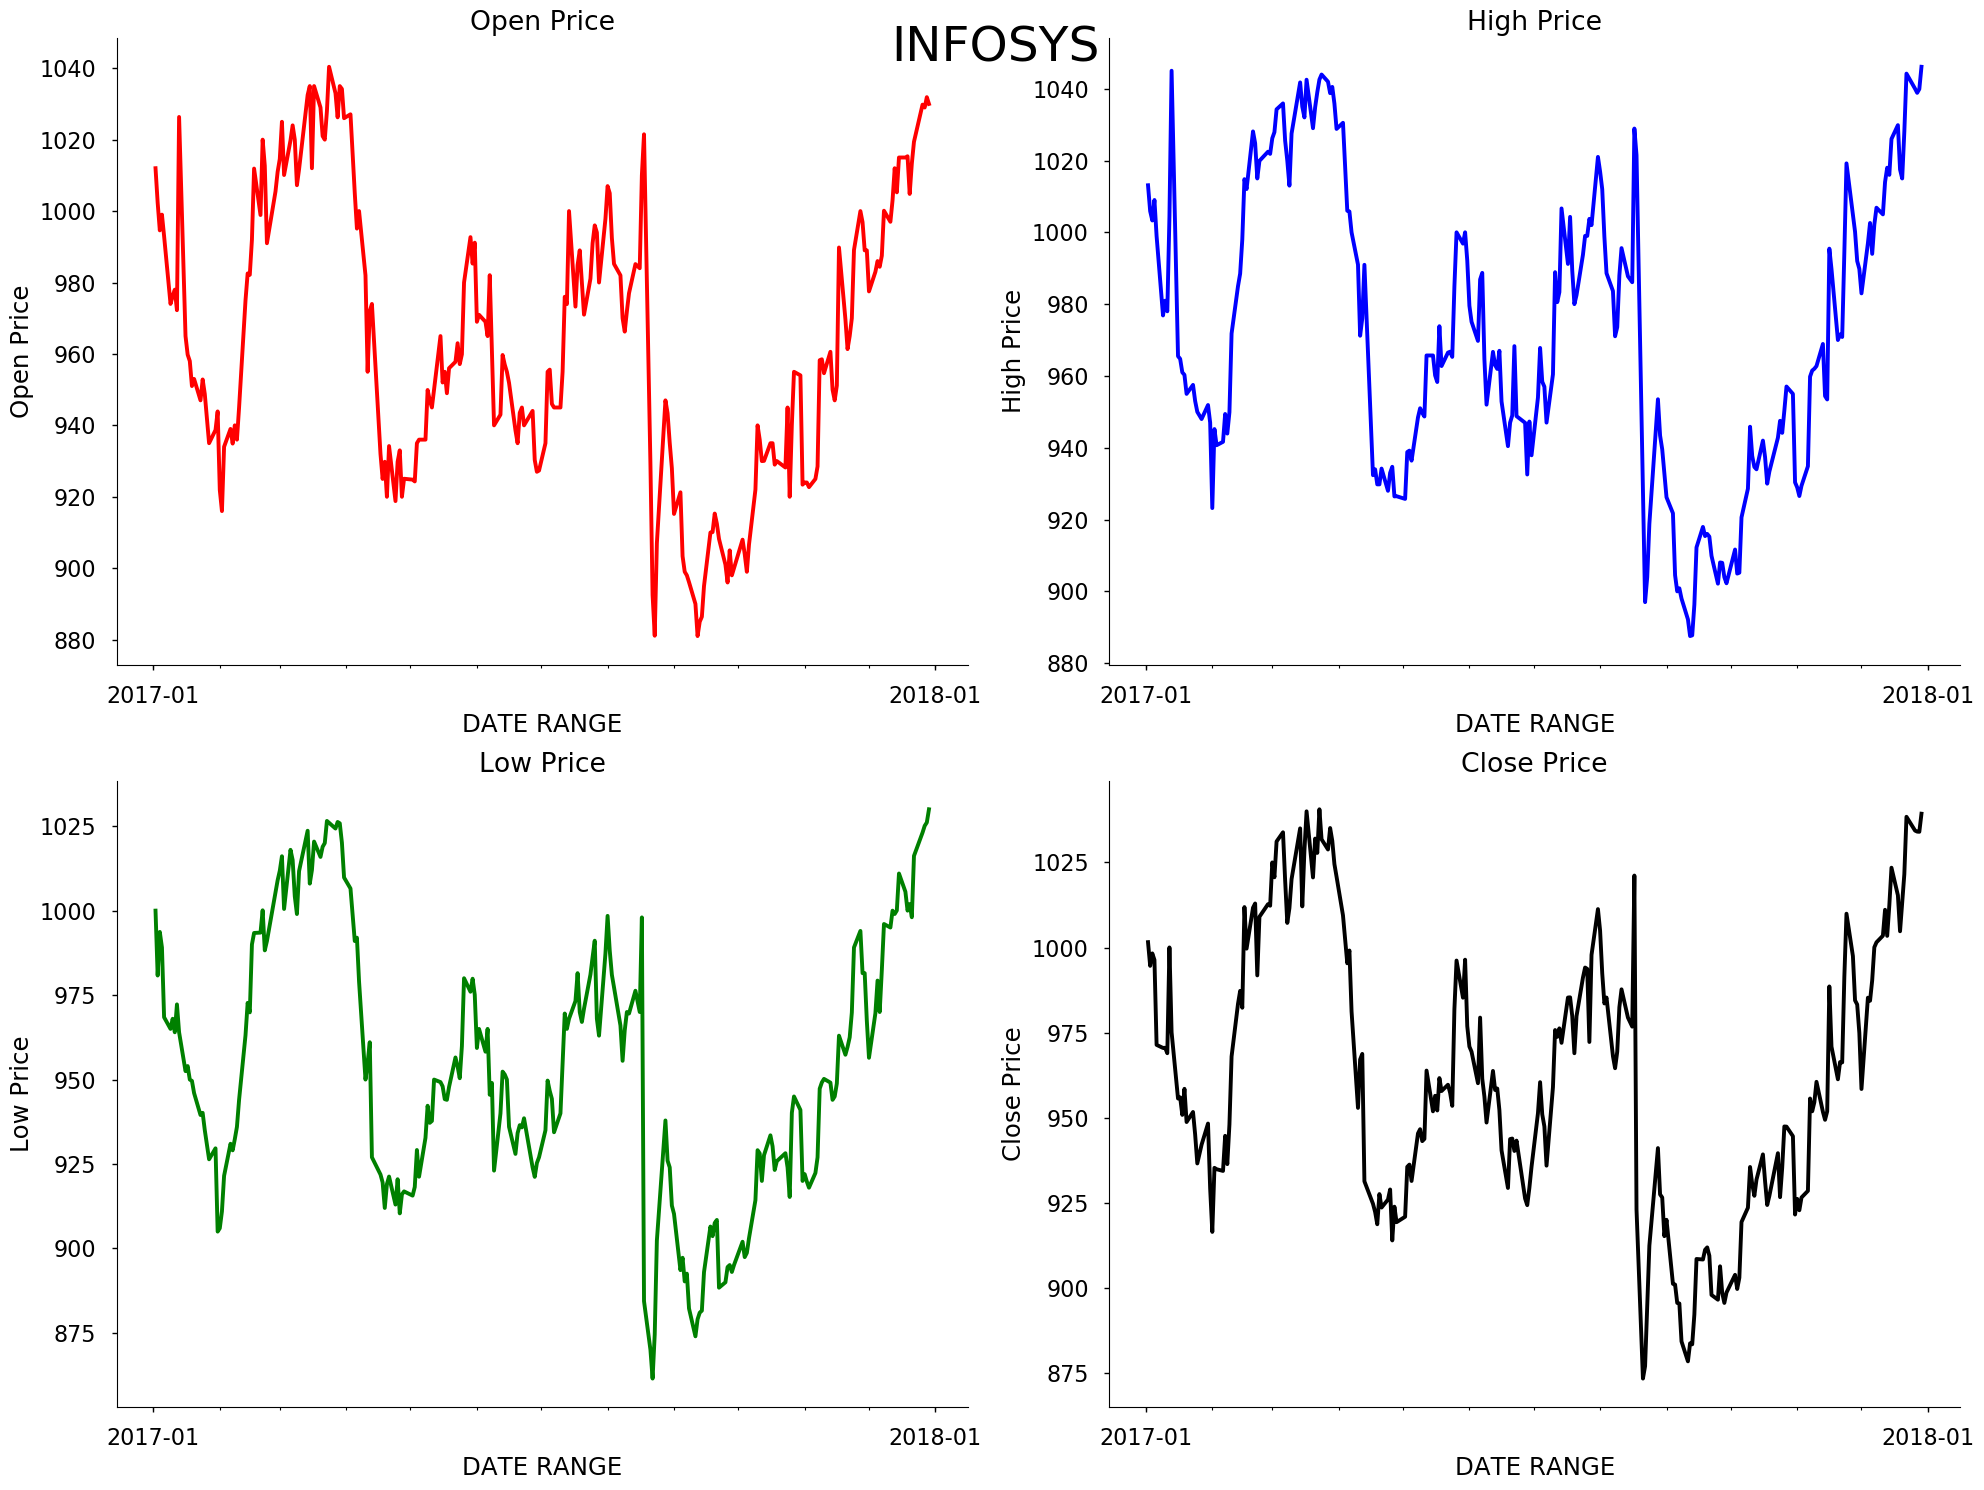
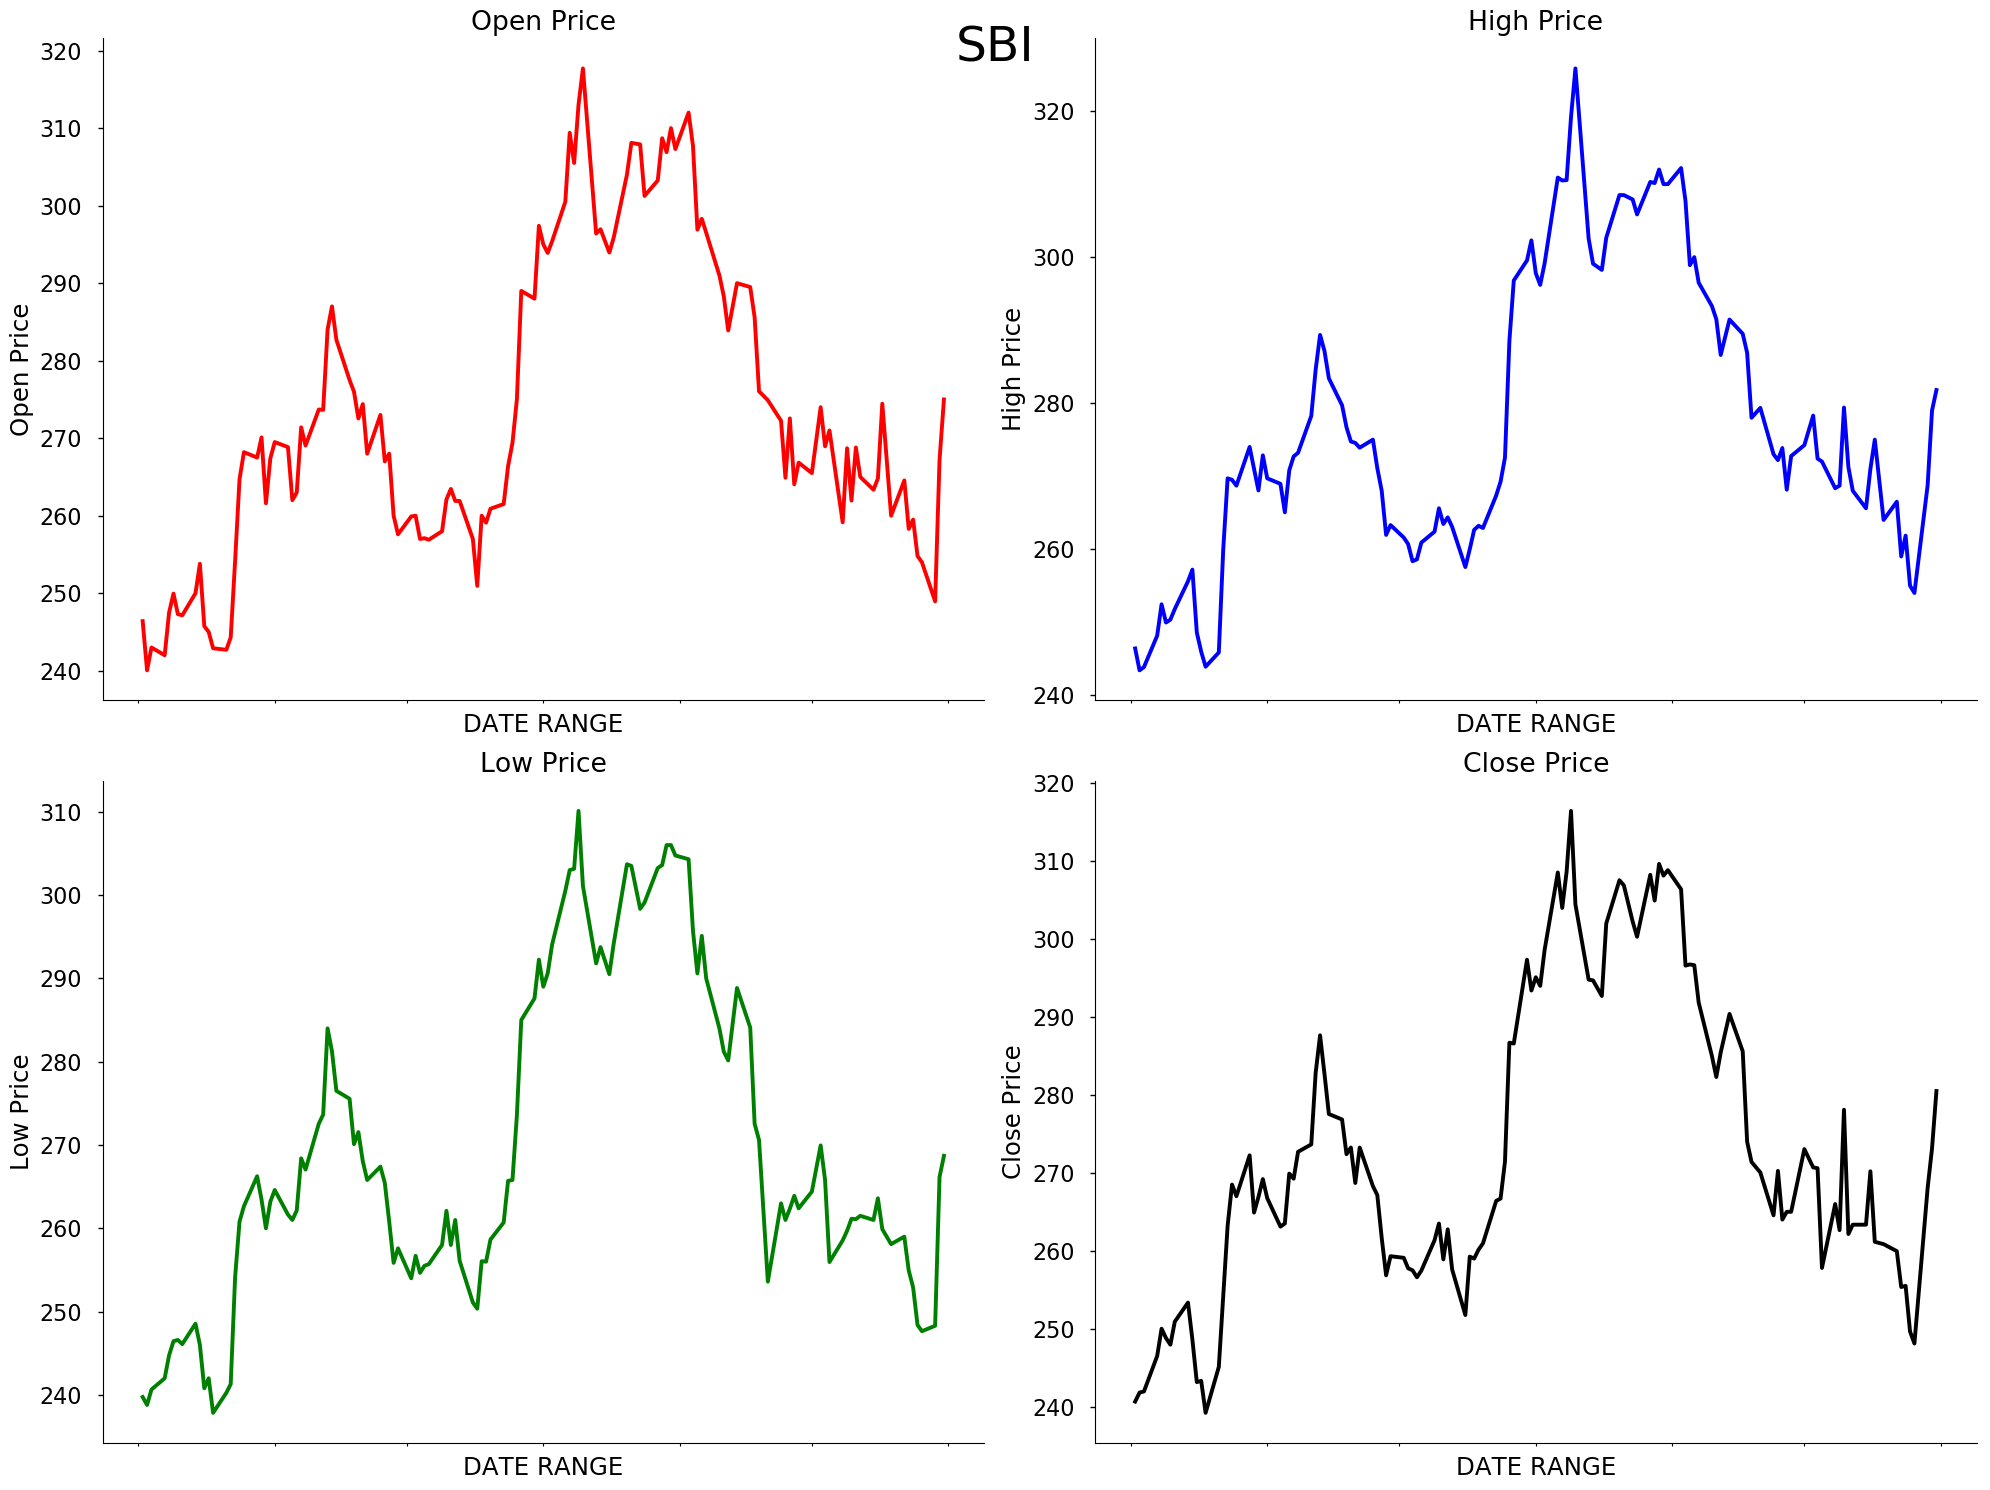
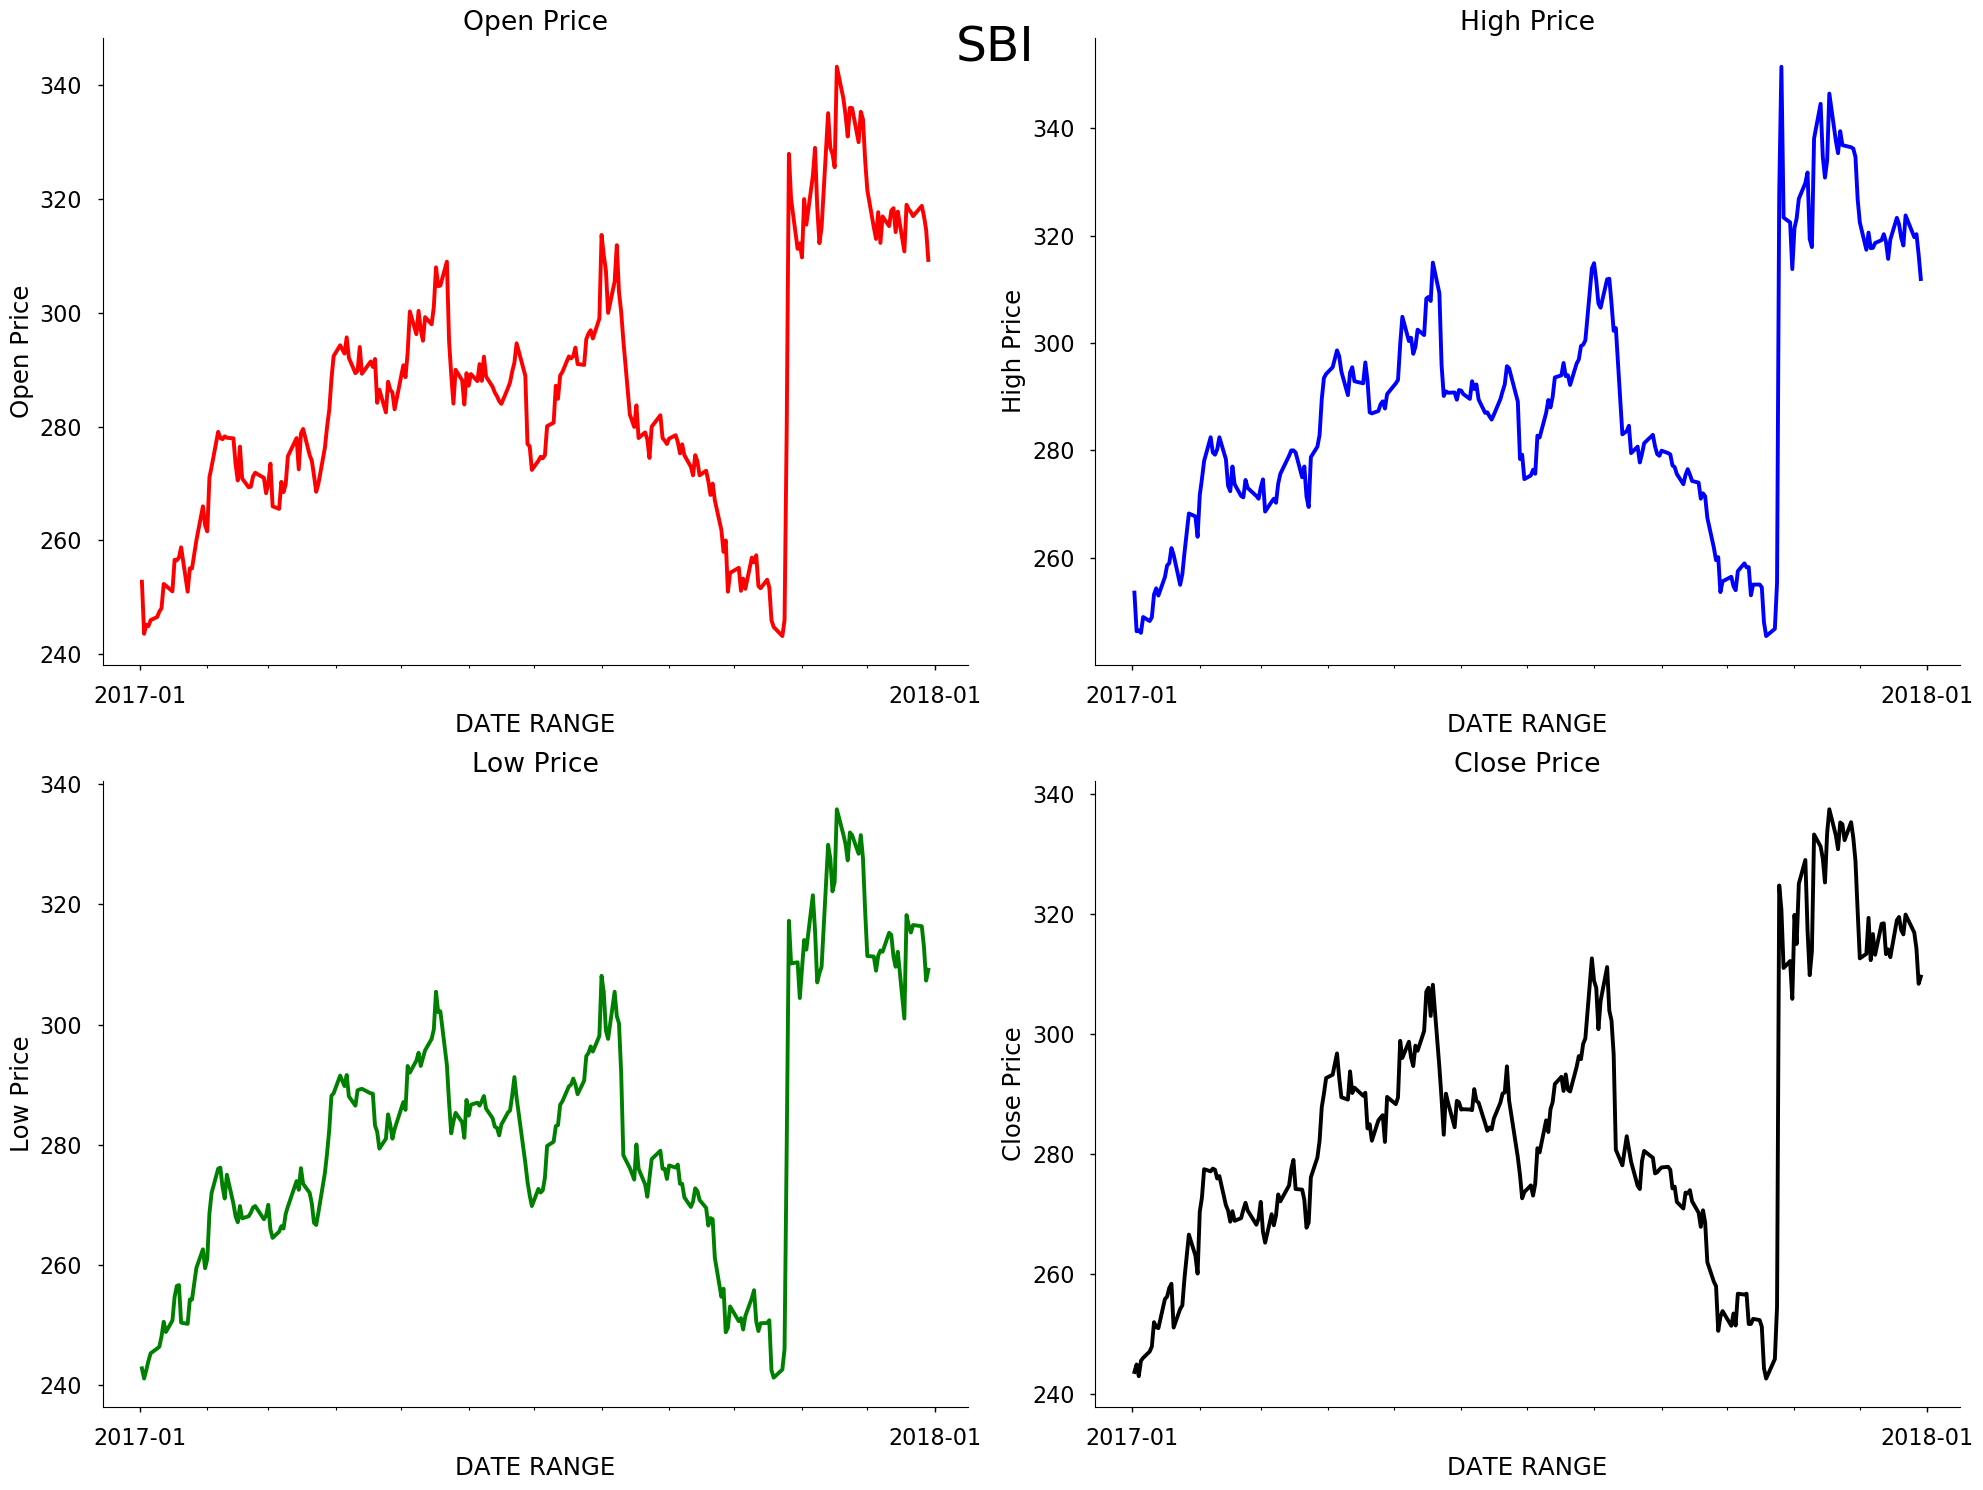
For most of Dataset (companies ) the stock price was showing increasing trend for the period of 2017-2018 (especially for tcs)
`import pandas as pd
import path
import matplotlib.pyplot as plt
import matplotlib.dates as mdates
import argparse
plt.style.use("seaborn-poster")
DATA_DIR=path.Path(r"D:\experiments\data\Capstone_proj")
dataset_lookup={
'sbi':'sbi.csv',
'infosys':'infosys.csv',
'tcs':'tcs.csv',
'usd_inr':'USD INR Historical Data - Investing.com India.csv'
}
four_columns=['Open Price', 'High Price', 'Low Price', 'Close Price']
colors=['r','b','g','black']
def read_data(dataset_name):
dataset_name=dataset_lookup.get(dataset_name)
df=pd.read_csv(DATA_DIR+"\{}".format(dataset_name))
df.set_index(pd.to_datetime(df['Date']),inplace=True)
df.sort_index(inplace=True)
return df
def make_chart(df,name='SBI',sub_name='total_range',plot_type=None):
years = mdates.YearLocator() # every year
months = mdates.MonthLocator() # every month
years_fmt = mdates.DateFormatter('%Y-%m')
#after sorting and set index
fig, ax = plt.subplots(nrows=2, ncols=2, figsize=(20,15))
col_count=0
for i in [0,1]:
    for j in [0,1]:

        #print("col",four_columns[col_count])
        if plot_type=='boxplot':
            ax[i][j].boxplot(df[four_columns[col_count]])
        elif plot_type=='line':
            ax[i][j].plot(df.index,df[four_columns[col_count]],color=colors[col_count])
        elif plot_type=='hist':
            ax[i][j].hist(df[four_columns[col_count]],color=colors[col_count])
        ax[i][j].spines['top'].set_visible(False)
        ax[i][j].spines['right'].set_visible(False)

        ax[i][j].xaxis.set_tick_params(top='off', direction='out', width=1)
        ax[i][j].yaxis.set_tick_params(right='off', direction='out', width=1)

        ax[i][j].set_title(four_columns[col_count])
        ax[i][j].set_xlabel("DATE RANGE")
        ax[i][j].set_ylabel(four_columns[col_count])

        ax[i][j].xaxis.set_major_locator(years)
        ax[i][j].xaxis.set_major_formatter(years_fmt)
        ax[i][j].xaxis.set_minor_locator(months)

        col_count+=1
fig.suptitle('{}-{}'.format(name.upper(),sub_name), fontsize=35)
fig.tight_layout()

fig.savefig('{}_{}.png'.format(name,sub_name), bbox_inches='tight')
def total_range(df,name,plot_type):
make_chart(df,name,"total_range",plot_type)
def monthly(df,name,plot_type):
df2=df.resample('M').sum()
make_chart(df2,name,"montly",plot_type)
def quaterly(df,name,plot_type):
df2=df.resample('Q').sum()
make_chart(df2,name,"Quaterly",plot_type)
def weekly(df,name,plot_type):
df2=df.resample('w').sum()
make_chart(df2,name,'weekly',plot_type)
def custom_dates(df,from_date,to_date,name,plot_type):
df2=df[(df.index>=from_date)&(df.index<to_date)]
make_chart(df2,name,"from {} to {}".format(from_date,to_date),plot_type)
if name=="main":
parser = argparse.ArgumentParser(description='helper functions for capstone project')
parser.add_argument('--DATASET', type=str, help='choose one of the dataset: sbi ,infosys,tcs,usd_inr')
parser.add_argument('--plot_type', type=str, help='choose the plot type : boxpot, line')

parser.add_argument('--fromdate', type=int,
                help="custom start date")
parser.add_argument('--todate', type=int,
            help='custom to date')

args = parser.parse_args()
dataset=args.DATASET
fromdate=args.fromdate
todate=args.todate
plot_type=args.plot_type

df=read_data(dataset)
total_range(df,dataset,plot_type)
weekly(df,dataset,plot_type)
monthly(df,dataset,plot_type)
quaterly(df,dataset,plot_type)
# custom_dates(df,fromdate,todate,dataset)
custom_dates(df,"2018-05","2018-11",dataset,plot_type)
custom_dates(df,"2017-01","2018-01",dataset,plot_type)
`