Last active
August 29, 2019 13:40
-
-
Save rajagurunath/8bb30fd82ea8ef3dc646f48499c48b8b to your computer and use it in GitHub Desktop.
This file contains hidden or bidirectional Unicode text that may be interpreted or compiled differently than what appears below. To review, open the file in an editor that reveals hidden Unicode characters.
Learn more about bidirectional Unicode characters
| import pandas as pd | |
| import path | |
| import matplotlib.pyplot as plt | |
| import matplotlib.dates as mdates | |
| import argparse | |
| plt.style.use("seaborn-poster") | |
| DATA_DIR=path.Path(r"D:\experiments\data\Capstone_proj") | |
| dataset_lookup={ | |
| 'sbi':'sbi.csv', | |
| 'infosys':'infosys.csv', | |
| 'tcs':'tcs.csv', | |
| 'usd_inr':'USD INR Historical Data - Investing.com India.csv' | |
| } | |
| four_columns=['Open Price', 'High Price', 'Low Price', 'Close Price'] | |
| colors=['r','b','g','black'] | |
| def read_data(dataset_name): | |
| dataset_name=dataset_lookup.get(dataset_name) | |
| df=pd.read_csv(DATA_DIR+"\\{}".format(dataset_name)) | |
| df.set_index(pd.to_datetime(df['Date']),inplace=True) | |
| df.sort_index(inplace=True) | |
| return df | |
| def make_chart(df,name='SBI',sub_name='total_range'): | |
| years = mdates.YearLocator() # every year | |
| months = mdates.MonthLocator() # every month | |
| years_fmt = mdates.DateFormatter('%Y-%m') | |
| #after sorting and set index | |
| fig, ax = plt.subplots(nrows=2, ncols=2, figsize=(20,15)) | |
| col_count=0 | |
| for i in [0,1]: | |
| for j in [0,1]: | |
| ax[i][j].plot(df[0].index,df[0][four_columns[col_count]],label='sbi') | |
| ax[i][j].plot(df[1].index,df[1][four_columns[col_count]],label='infosys') | |
| ax[i][j].plot(df[2].index,df[2][four_columns[col_count]],label='tcs') | |
| ax[i][j].legend() | |
| ax[i][j].spines['top'].set_visible(False) | |
| ax[i][j].spines['right'].set_visible(False) | |
| ax[i][j].xaxis.set_tick_params(top='off', direction='out', width=1) | |
| ax[i][j].yaxis.set_tick_params(right='off', direction='out', width=1) | |
| ax[i][j].set_title(four_columns[col_count]) | |
| ax[i][j].set_xlabel("DATE RANGE") | |
| ax[i][j].set_ylabel(four_columns[col_count]) | |
| ax[i][j].xaxis.set_major_locator(years) | |
| ax[i][j].xaxis.set_major_formatter(years_fmt) | |
| ax[i][j].xaxis.set_minor_locator(months) | |
| col_count+=1 | |
| plt.legend() | |
| fig.suptitle('{}-{}'.format(name.upper(),sub_name), fontsize=35) | |
| fig.tight_layout() | |
| fig.savefig('{}_{}.png'.format(name,sub_name), bbox_inches='tight') | |
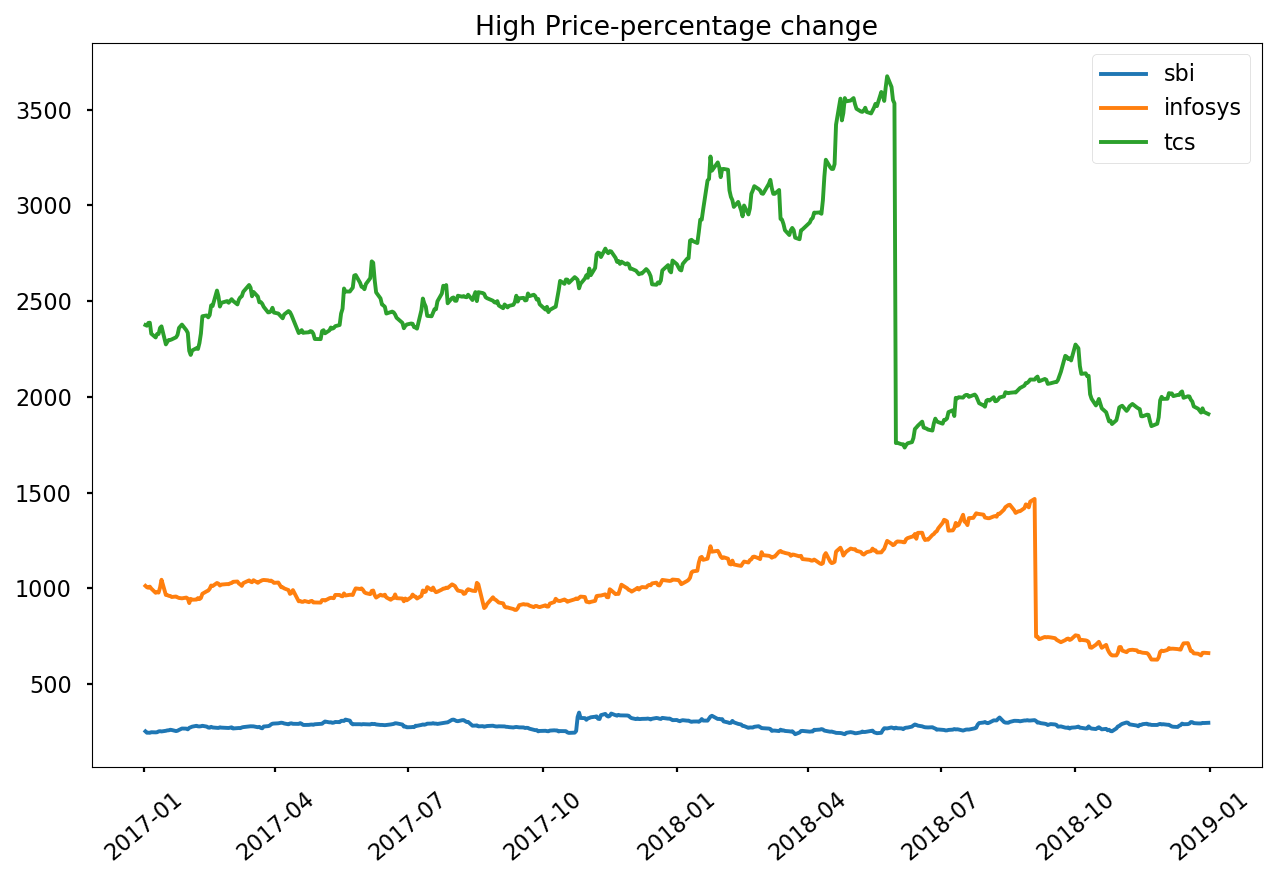
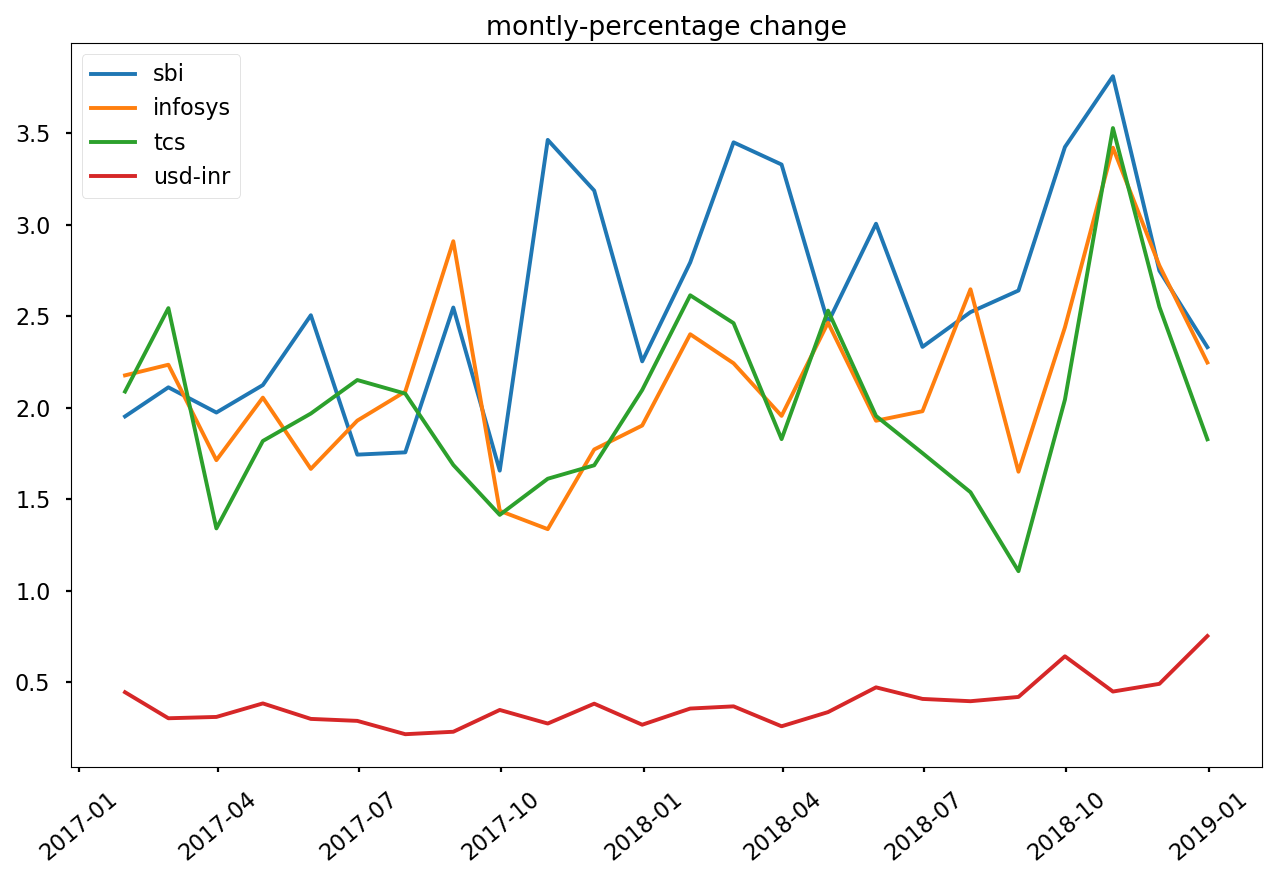
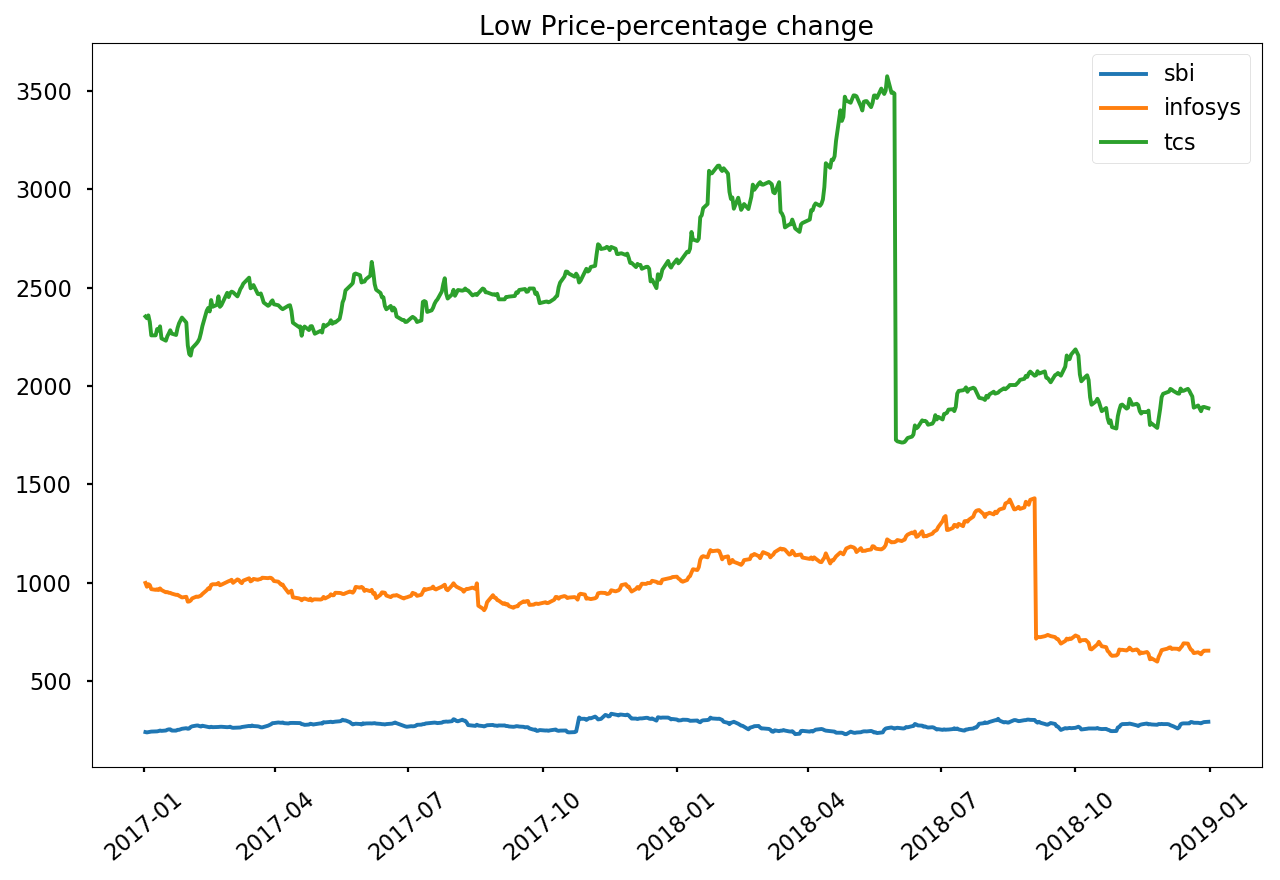
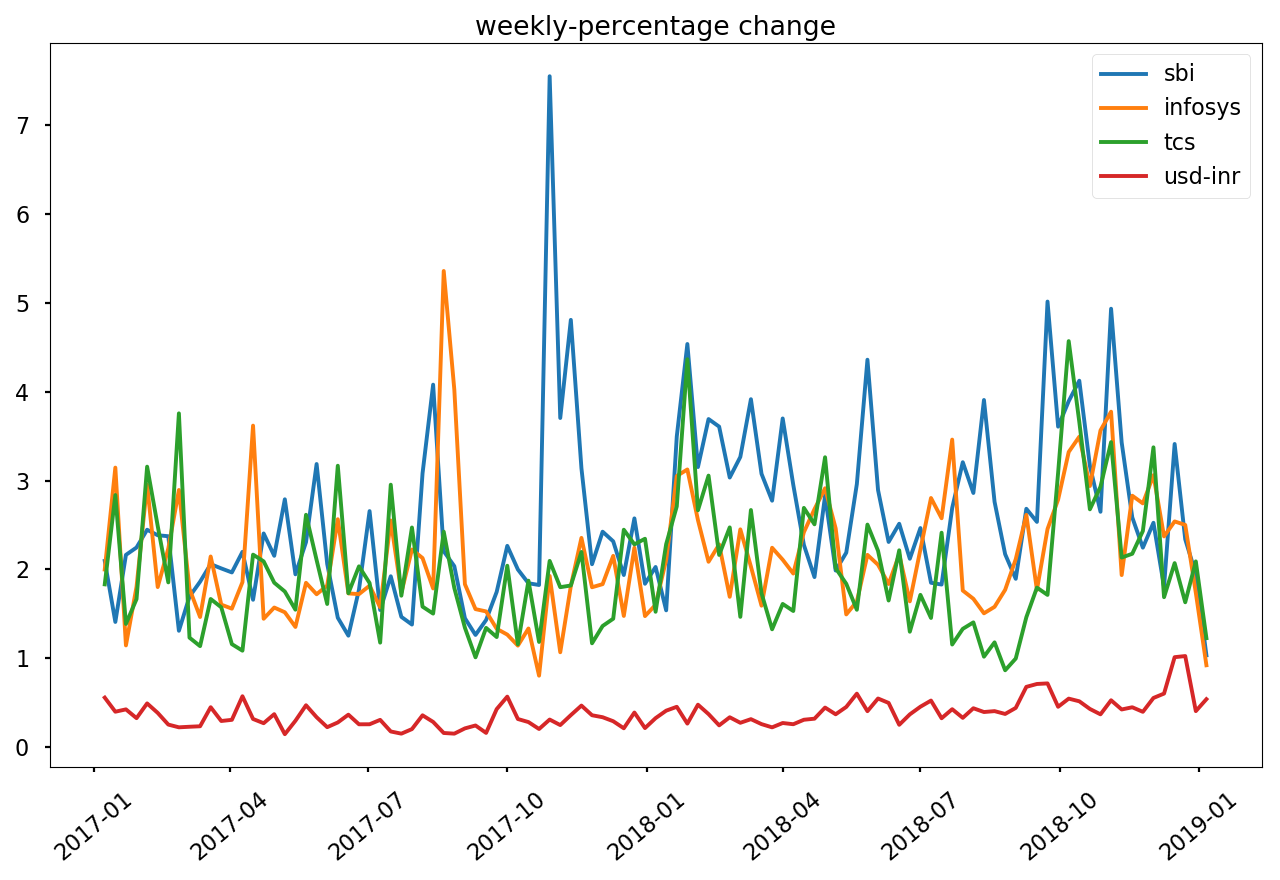
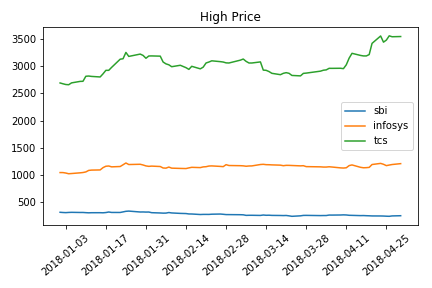
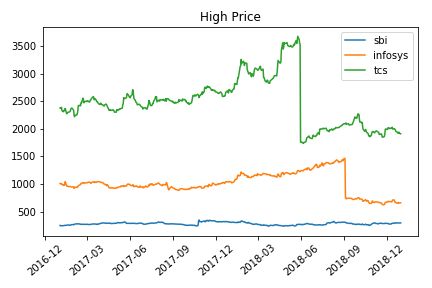
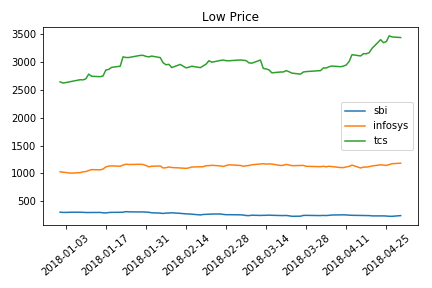
| def plot_3(df1,df2,df3,df4=None,name='None',col_name="Perc_change"): | |
| plt.show() | |
| plt.plot(df1[col_name],label='sbi') | |
| plt.plot(df2[col_name],label='infosys') | |
| plt.plot(df3[col_name],label='tcs') | |
| if col_name=="Perc_change": | |
| plt.plot(df4[col_name],label='usd-inr') | |
| plt.xticks(rotation=40) | |
| plt.legend() | |
| plt.title(name+"-percentage change") | |
| plt.tight_layout() | |
| plt.savefig("{}.png".format(name)) | |
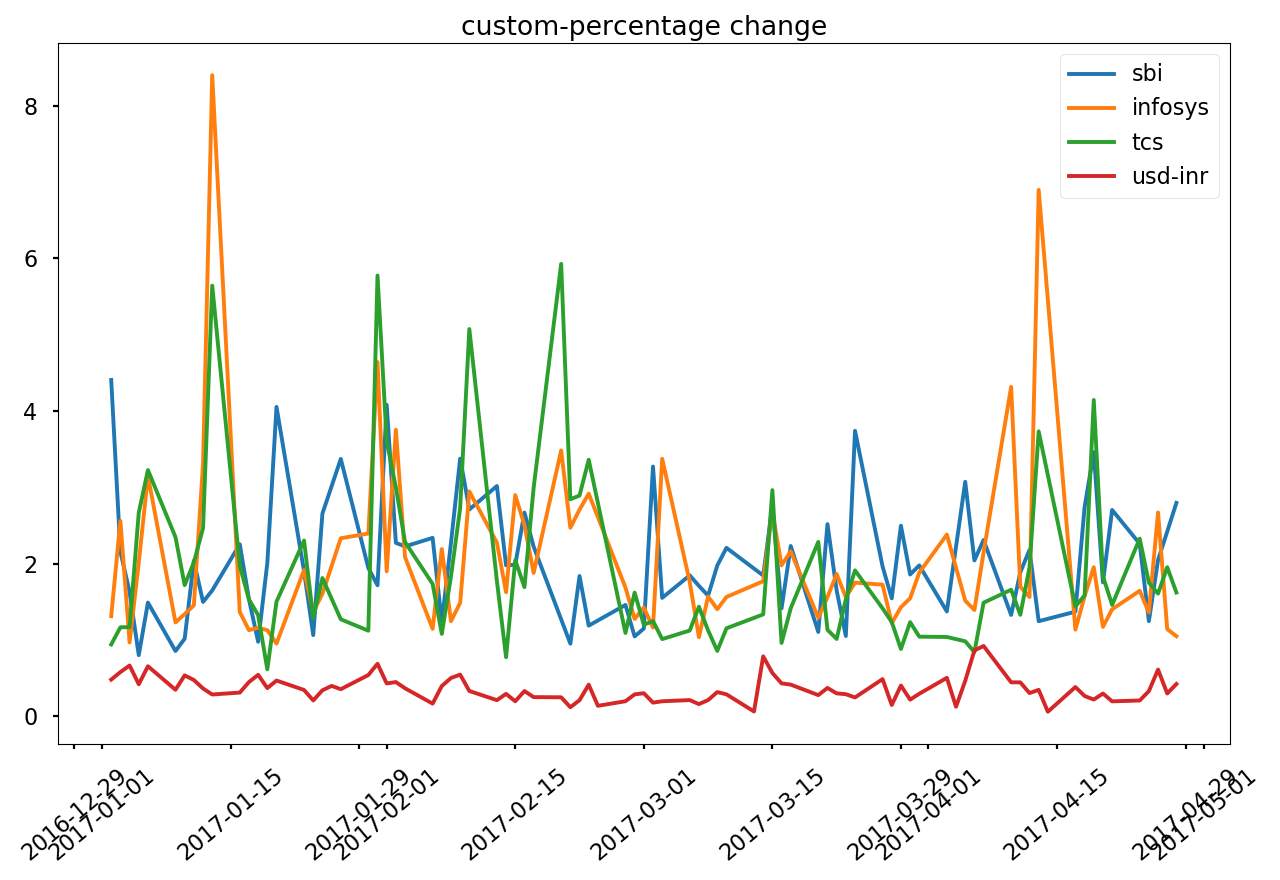
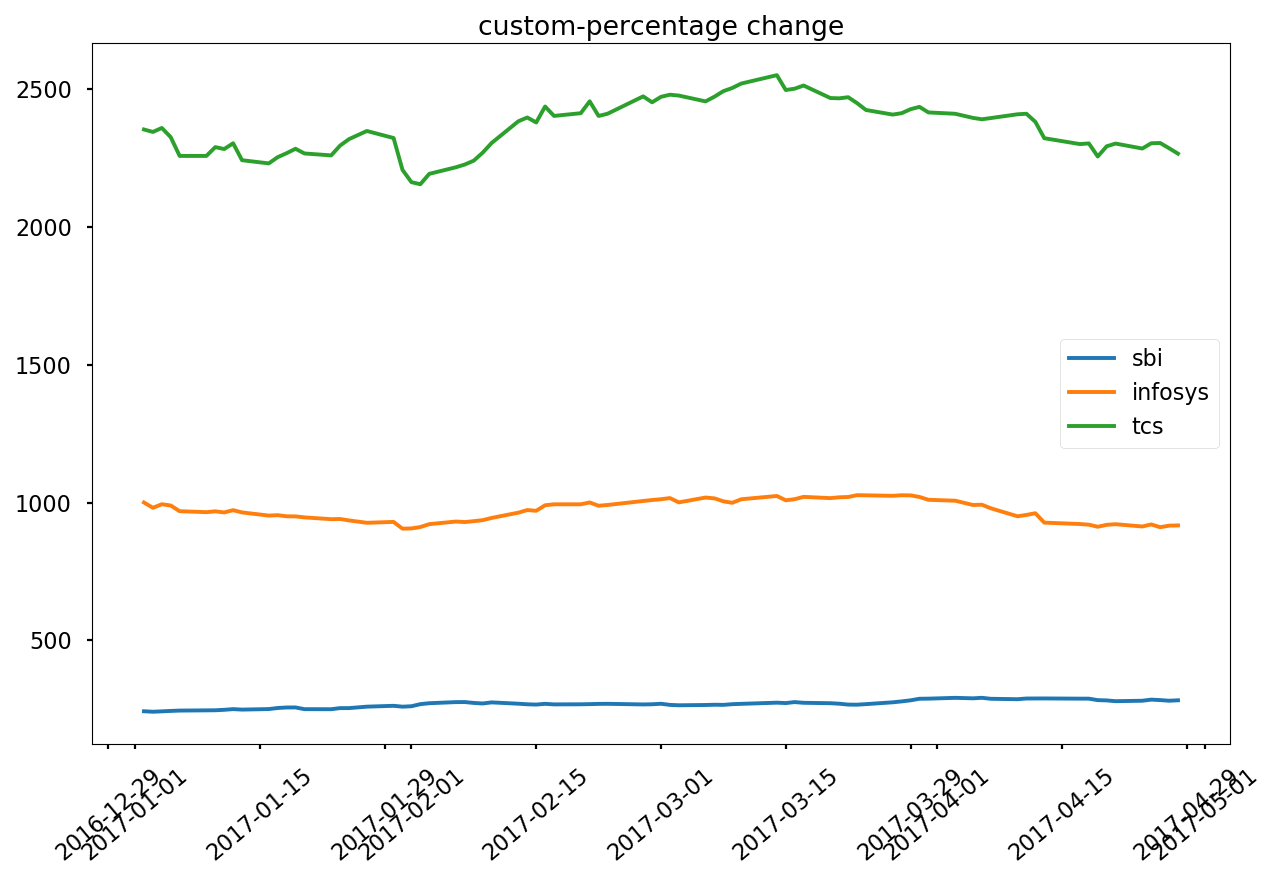
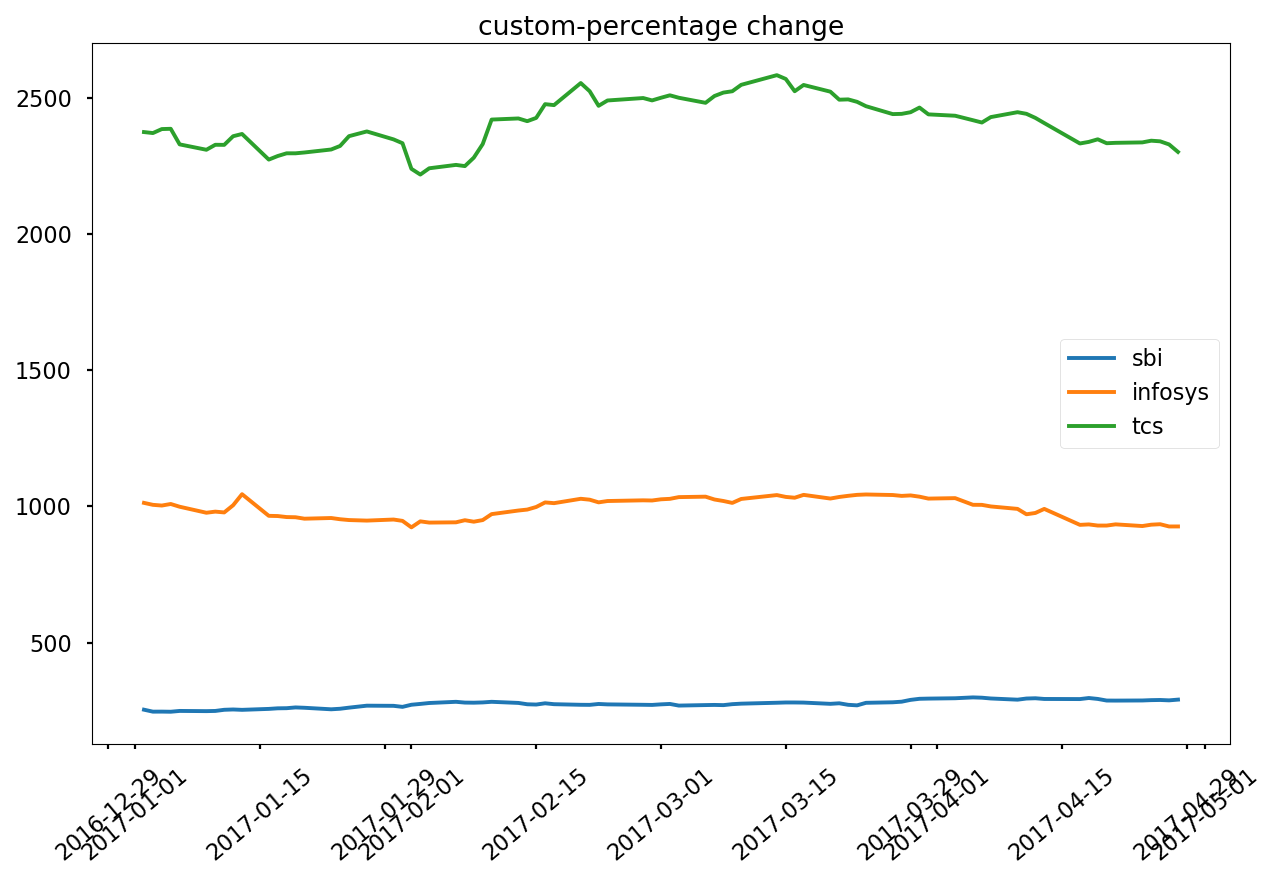
| def custom_dates_v1(df_list,from_date,to_date,name,name2): | |
| df2_list=[] | |
| for df in df_list: | |
| df2_list.append(df[(df.index>=from_date)&(df.index<to_date)]) | |
| plot_3(*df2_list,name,name2) | |
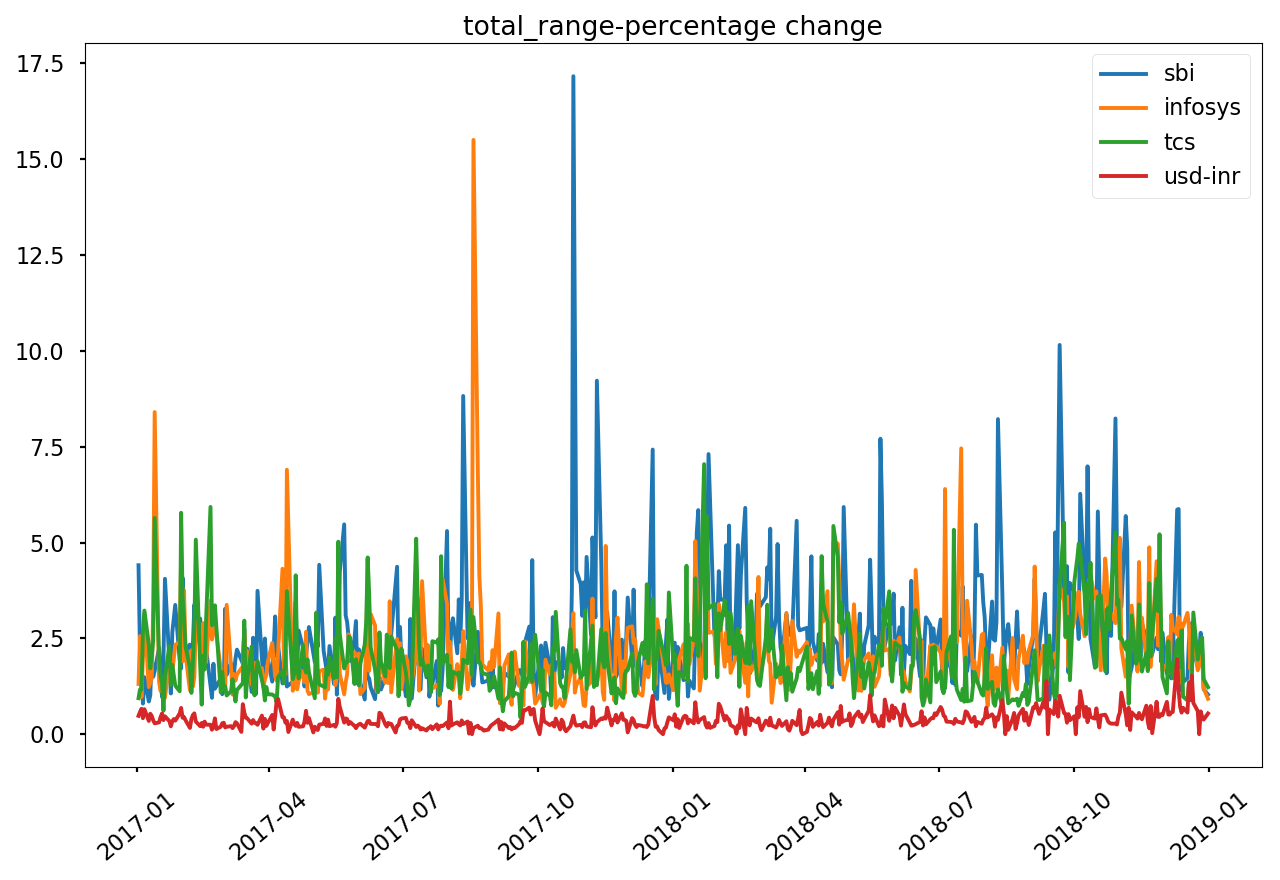
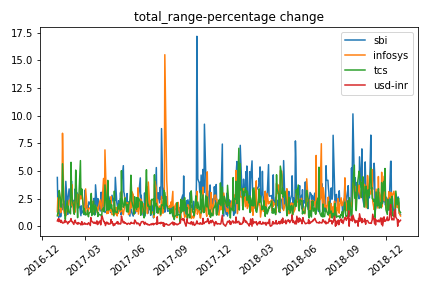
| def total_range(df,name): | |
| plot_3(*df,"total_range") | |
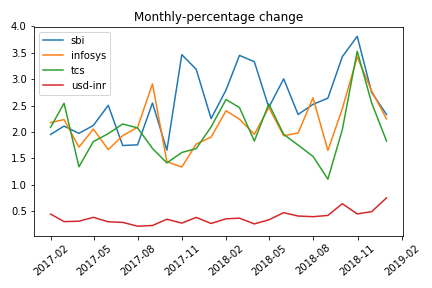
| def monthly(df_list,name): | |
| df2_list=[] | |
| for df in df_list: | |
| df2_list.append(df.resample('M').mean()) | |
| # df2=df.resample('M').mean() | |
| plot_3(*df2_list,"montly") | |
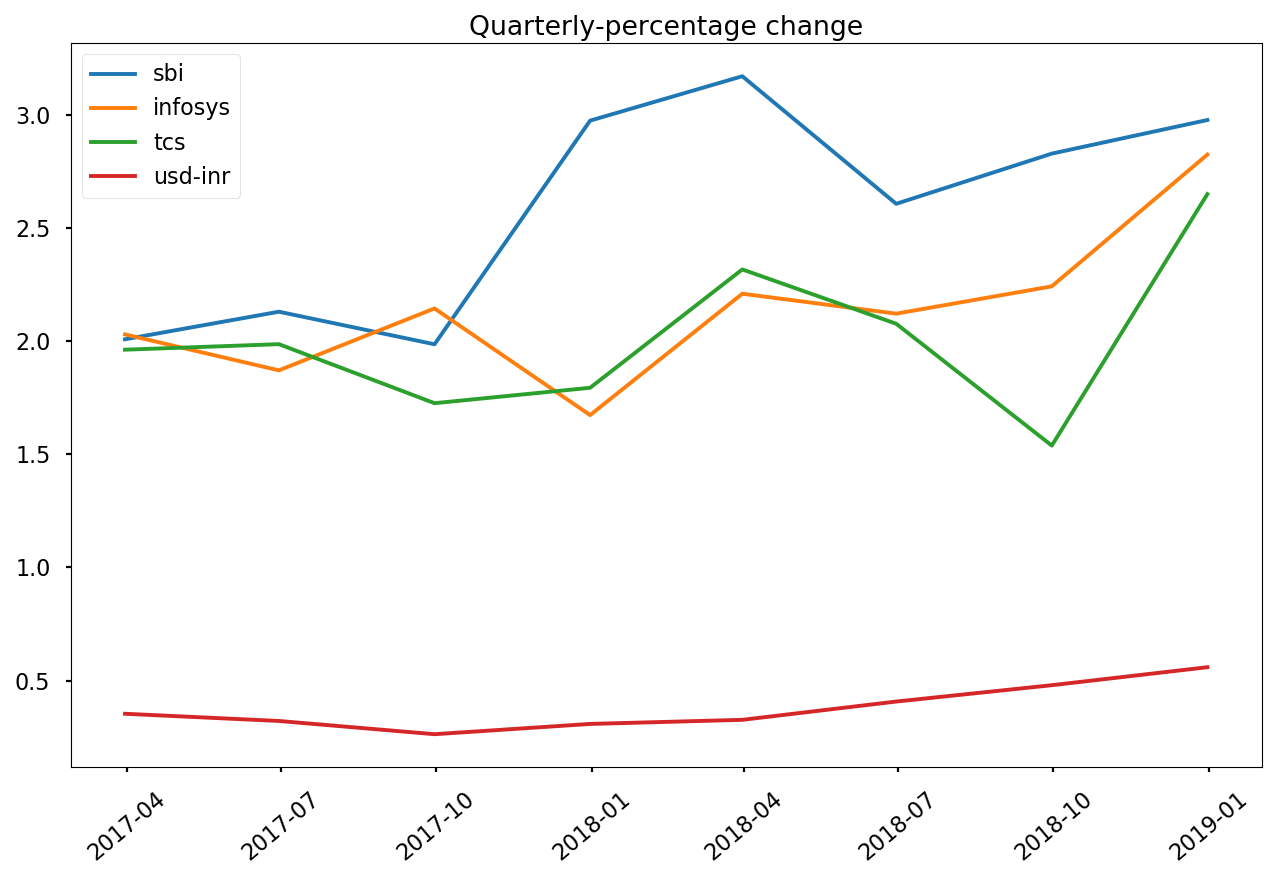
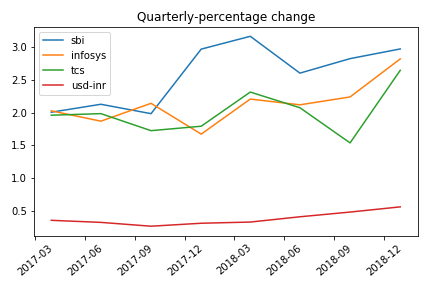
| def quaterly(df_list,name): | |
| df2_list=[] | |
| for df in df_list: | |
| df2_list.append(df.resample('Q').mean()) | |
| plot_3(*df2_list,"Quarterly") | |
| def weekly(df_list,name): | |
| df2_list=[] | |
| for df in df_list: | |
| df2_list.append(df.resample('w').mean()) | |
| plot_3(*df2_list,'weekly') | |
| def custom_dates(df,from_date,to_date,name): | |
| df2=df[(df.index>=from_date)&(df.index<to_date)] | |
| make_chart(df2,name,"from {} to {}".format(from_date,to_date)) | |
| def percentage(x): | |
| diff = x['High Price'] - x['Low Price'] | |
| x['Perc_change'] = (diff/x['Low Price']) * 100 | |
| return x | |
| if __name__=="__main__": | |
| parser = argparse.ArgumentParser(description='helper functions for capstone project') | |
| # parser.add_argument('--DATASET', type=str, help='choose one of the dataset: sbi ,infosys,tcs,usd_inr') | |
| # parser.add_argument('--fromdate', type=str, | |
| # help="custom start date") | |
| # parser.add_argument('--todate', type=str, | |
| # help='custom to date') | |
| # args = parser.parse_args() | |
| # # dataset=args.DATASET | |
| # fromdate=args.fromdate | |
| # todate=args.todate | |
| fromdate="2017-01" | |
| todate="2017-05" | |
| sbi=read_data("sbi") | |
| infos=read_data("infosys") | |
| tcs=read_data("tcs") | |
| usd_inr=read_data("usd_inr") | |
| print(usd_inr.dtypes) | |
| usd_inr["High Price"]=usd_inr["High Price"].astype("float") | |
| usd_inr["Low Price"]=usd_inr["Low Price"].astype("float") | |
| sbi=sbi.apply(percentage,axis=1) | |
| infos=infos.apply(percentage,axis=1) | |
| tcs=tcs.apply(percentage,axis=1) | |
| usd_inr=usd_inr.apply(percentage,axis=1) | |
| df_list=[sbi,infos,tcs,usd_inr] | |
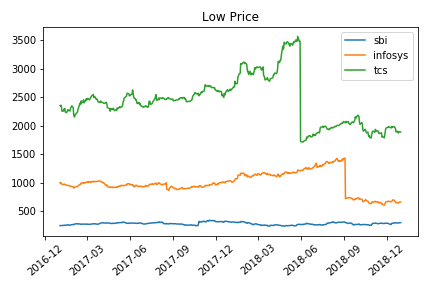
| plot_3(*df_list,"Low Price","Low Price") | |
| plot_3(*df_list,"High Price","High Price") | |
| # plot_3(sbi,infos,tcs) | |
| custom_dates_v1([sbi,infos,tcs,usd_inr],fromdate,todate,"custom","High Price") | |
| custom_dates_v1([sbi,infos,tcs,usd_inr],fromdate,todate,"custom","Low Price") | |
| total_range([sbi,infos,tcs,usd_inr],"days") | |
| dataset=None | |
| weekly(df_list,dataset) | |
| monthly(df_list,dataset) | |
| quaterly(df_list,dataset) | |
| # # custom_dates(df,fromdate,todate,dataset) | |
| # custom_dates(df,"2018-05","2018-11",dataset) | |
| # custom_dates(df,"2017-01","2018-01",dataset) | |
Author
rajagurunath
commented
Aug 29, 2019


Author


Author


Sign up for free
to join this conversation on GitHub.
Already have an account?
Sign in to comment