Created
December 11, 2017 17:48
-
-
Save rentrop/36f07b67cb6c4b82088e2115fee2498f to your computer and use it in GitHub Desktop.
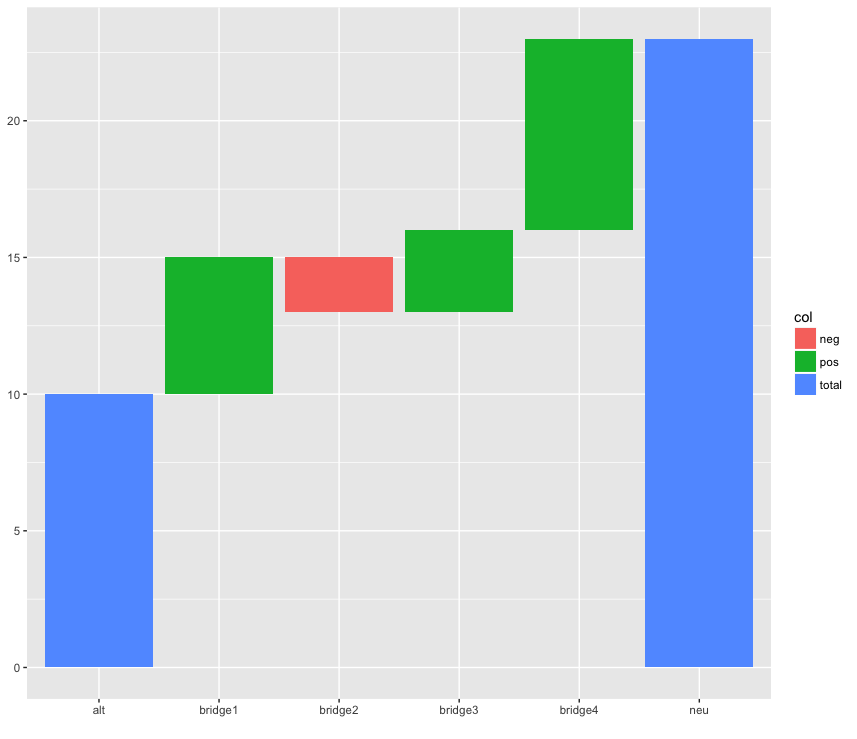
ggplot waterfall chart
This file contains hidden or bidirectional Unicode text that may be interpreted or compiled differently than what appears below. To review, open the file in an editor that reveals hidden Unicode characters.
Learn more about bidirectional Unicode characters
| require(tidyverse) | |
| tibble( | |
| label = c("alt", "bridge1", "bridge2", "bridge3", "bridge4"), | |
| value = c(10, 5, -2, 3, 7) | |
| ) %>% | |
| mutate( | |
| end = cumsum(value), | |
| start = dplyr::lag(end, default = 0), | |
| col = c("neg", "pos", "total")[c(3, (value[-1]>0)+1)], | |
| id = seq(1, n()) | |
| ) %>% | |
| bind_rows(summarise(., label = "neu", start = 0, end = last(end), id = n()+1L, col = "total")) %>% | |
| ggplot(aes(label, fill = col)) + | |
| geom_rect(aes(x = label, xmin = id -0.45, xmax = id + 0.45, ymin = end, ymax =start)) + xlab("") |
Author
Thank you for this. Very elegant and simple.
Sign up for free
to join this conversation on GitHub.
Already have an account?
Sign in to comment
This results in: