Last active
November 29, 2023 07:54
-
-
Save rmaia/5296401 to your computer and use it in GitHub Desktop.
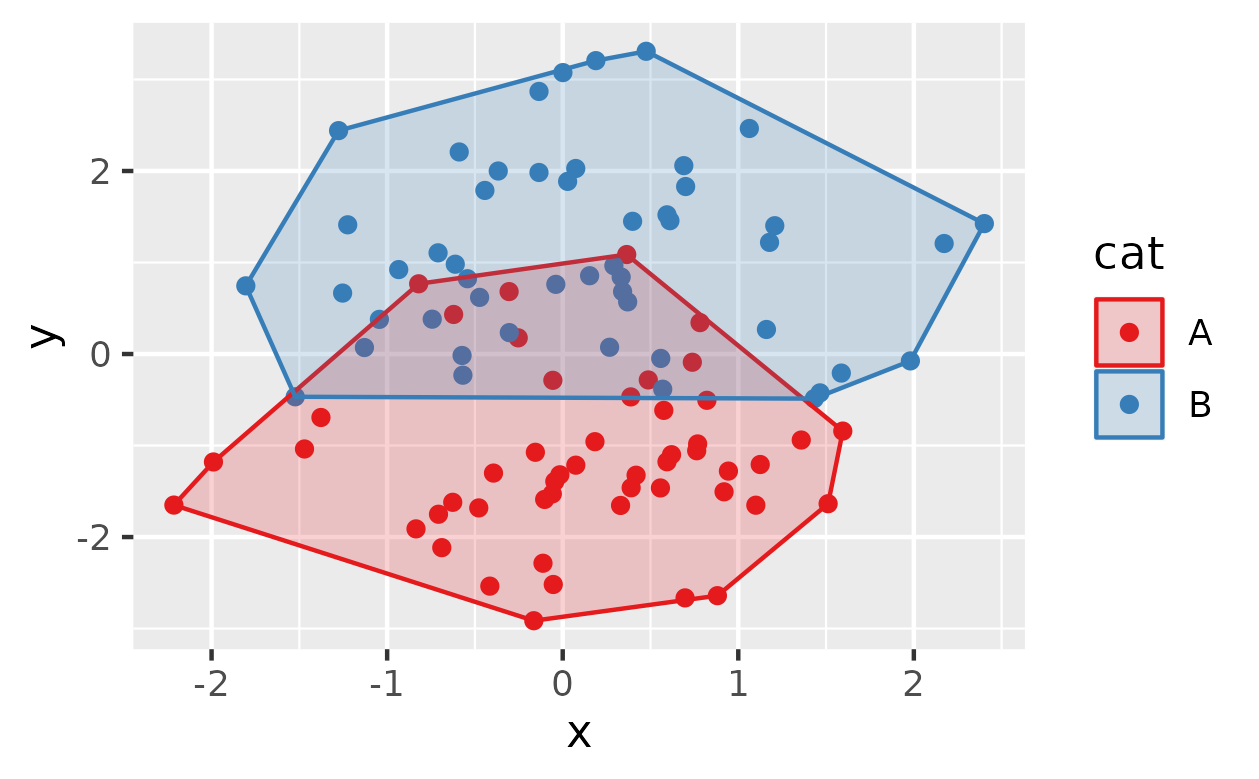
Plot convex hulls according to a factor
This file contains hidden or bidirectional Unicode text that may be interpreted or compiled differently than what appears below. To review, open the file in an editor that reveals hidden Unicode characters.
Learn more about bidirectional Unicode characters
| require(ggplot2) | |
| require(plyr) | |
| # make toy data | |
| set.seed(1) | |
| dataf <- data.frame( | |
| x = rnorm(100), | |
| y = c(rnorm(50,-1), rnorm(50,1)), | |
| cat = rep(c("A","B"), each=50) | |
| ) | |
| ggplot(data=dataf, aes(x=x, y=y, color=cat)) + geom_point() | |
| # get convex hull coordinates | |
| # chull function gives you which points delimit the minimum convex hull | |
| chulls <- ddply(dataf, .(cat), function(df) df[chull(df$x, df$y), ]) | |
| # plot polygons | |
| ggplot(data=dataf, aes(x=x, y=y, color=cat)) + geom_point() + | |
| geom_polygon(data=chulls, aes(x=x, y=y, group=cat), fill=NA) | |
| # if you wanna get fancy with the colors | |
| # (will give annoying warnings if number of groups is smaller than 3, ignore) | |
| ggplot(data=dataf, aes(x=x, y=y, color=cat)) + geom_point() + | |
| geom_polygon(data=chulls, aes(x=x, y=y, fill=cat), alpha=0.2) + | |
| scale_color_brewer(palette='Set1') + | |
| scale_fill_brewer(palette='Set1') |
Sign up for free
to join this conversation on GitHub.
Already have an account?
Sign in to comment
For those coming here for the code, here's the plot produced by the code above