Last active
September 30, 2020 20:44
-
-
Save sergiolucero/59ed64aa4caf5d897b7bbed24540fd64 to your computer and use it in GitHub Desktop.
first use of datachile API
This file contains hidden or bidirectional Unicode text that may be interpreted or compiled differently than what appears below. To review, open the file in an editor that reveals hidden Unicode characters.
Learn more about bidirectional Unicode characters
| import pandas as pd | |
| import matplotlib.pyplot as plt | |
| import squarify # pip install squarify (algorithm for treemap) | |
| from datachile import ChileCube | |
| client = ChileCube() | |
| query = client.get("exports", | |
| {"drilldowns": [ | |
| ["Date", "Year"], | |
| ["Destination Country", "Country", "Country"] | |
| ], | |
| "measures": ["FOB US"], | |
| "cuts": [{"drilldown": ["Date", "Year"],"values": [2016]}], | |
| "parents": True | |
| }) | |
| ############################### | |
| df = pd.DataFrame(query['data']) | |
| df = df[df['FOB US']>df['FOB US'].quantile(.85)] # remove smaller countries | |
| df = df.sort_values('FOB US', ascending=False) | |
| df['perc'] = df['FOB US']/df['FOB US'].sum() | |
| df['cp'] = ['%s (%.2f%%)' %(c,100*p) for c,p in zip(df['Country'],df['perc'])] | |
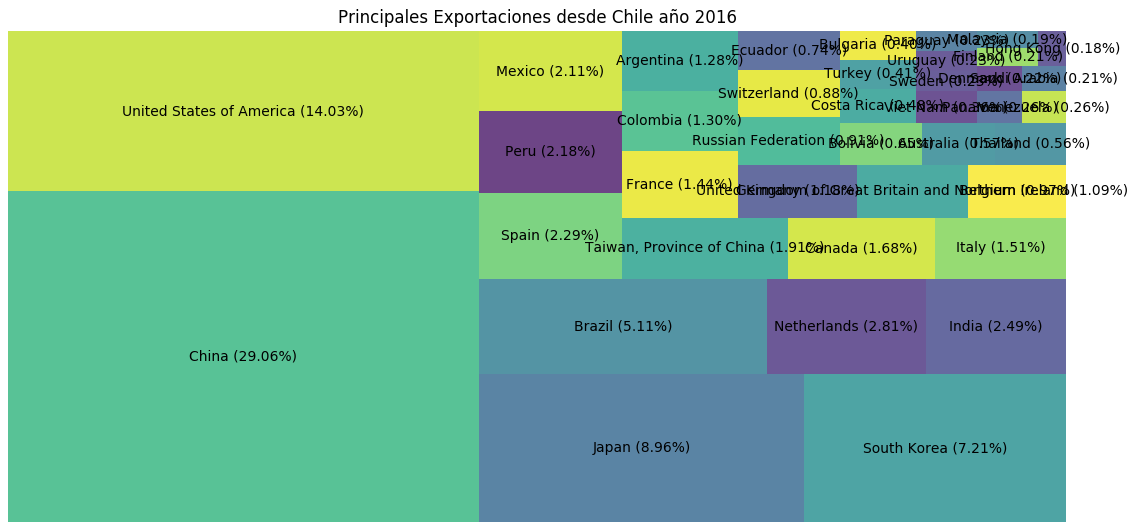
| squarify.plot(sizes=df['FOB US'], label=df['cp'], alpha=.8 ) | |
| plt.axis('off') | |
| plt.title('Principales Exportaciones desde Chile año 2016') | |
| plt.show() |
Sign up for free
to join this conversation on GitHub.
Already have an account?
Sign in to comment
My first example of using the datachile API. It's fugly for sure, but we're getting somewhere. Somehow surprised to see that bokeh, seaborn and dash do not provide treemaps as a standard feature.