Last active
March 24, 2020 04:34
-
-
Save sergiolucero/a01a76d0b798c8e589772c9400a7e94f to your computer and use it in GitHub Desktop.
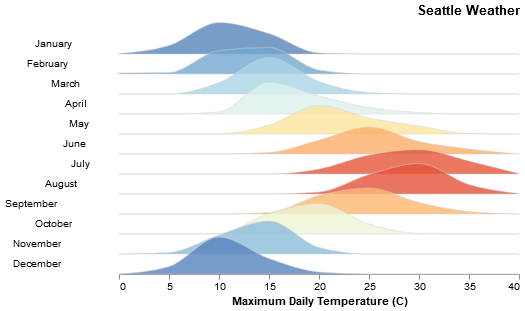
Ridgeline plot
This file contains hidden or bidirectional Unicode text that may be interpreted or compiled differently than what appears below. To review, open the file in an editor that reveals hidden Unicode characters.
Learn more about bidirectional Unicode characters
| import altair as alt | |
| from vega_datasets import data | |
| source = data.seattle_weather.url | |
| step = 20 | |
| overlap = 1 | |
| alt.Chart(source, height=step).transform_timeunit(Month='month(date)' | |
| ).transform_joinaggregate(mean_temp='mean(temp_max)', groupby=['Month'] | |
| ).transform_bin(['bin_max', 'bin_min'], 'temp_max' | |
| ).transform_aggregate(value='count()', groupby=['Month', 'mean_temp', 'bin_min', 'bin_max'] | |
| ).transform_impute(impute='value', groupby=['Month', 'mean_temp'], key='bin_min', value=0 | |
| ).mark_area(interpolate='monotone',fillOpacity=0.8,stroke='lightgray',strokeWidth=0.5 | |
| ).encode(alt.X('bin_min:Q', bin='binned', title='Maximum Daily Temperature (C)'), | |
| alt.Y('value:Q',scale=alt.Scale(range=[step, -step * overlap]),axis=None), | |
| alt.Fill('mean_temp:Q',legend=None,scale=alt.Scale(domain=[30, 5], scheme='redyellowblue')) | |
| ).facet( | |
| row=alt.Row('Month:T',title=None,header=alt.Header(labelAngle=0, labelAlign='right', format='%B')) | |
| ).properties(title='Seattle Weather',bounds='flush' | |
| ).configure_facet(spacing=0).configure_view(stroke=None).configure_title(anchor='end') |
Author
sergiolucero
commented
Mar 24, 2020
Sign up for free
to join this conversation on GitHub.
Already have an account?
Sign in to comment