Created
January 30, 2020 07:37
-
-
Save soh-i/dc5ecf456ddb5ca12c1f95fe1b142cd4 to your computer and use it in GitHub Desktop.
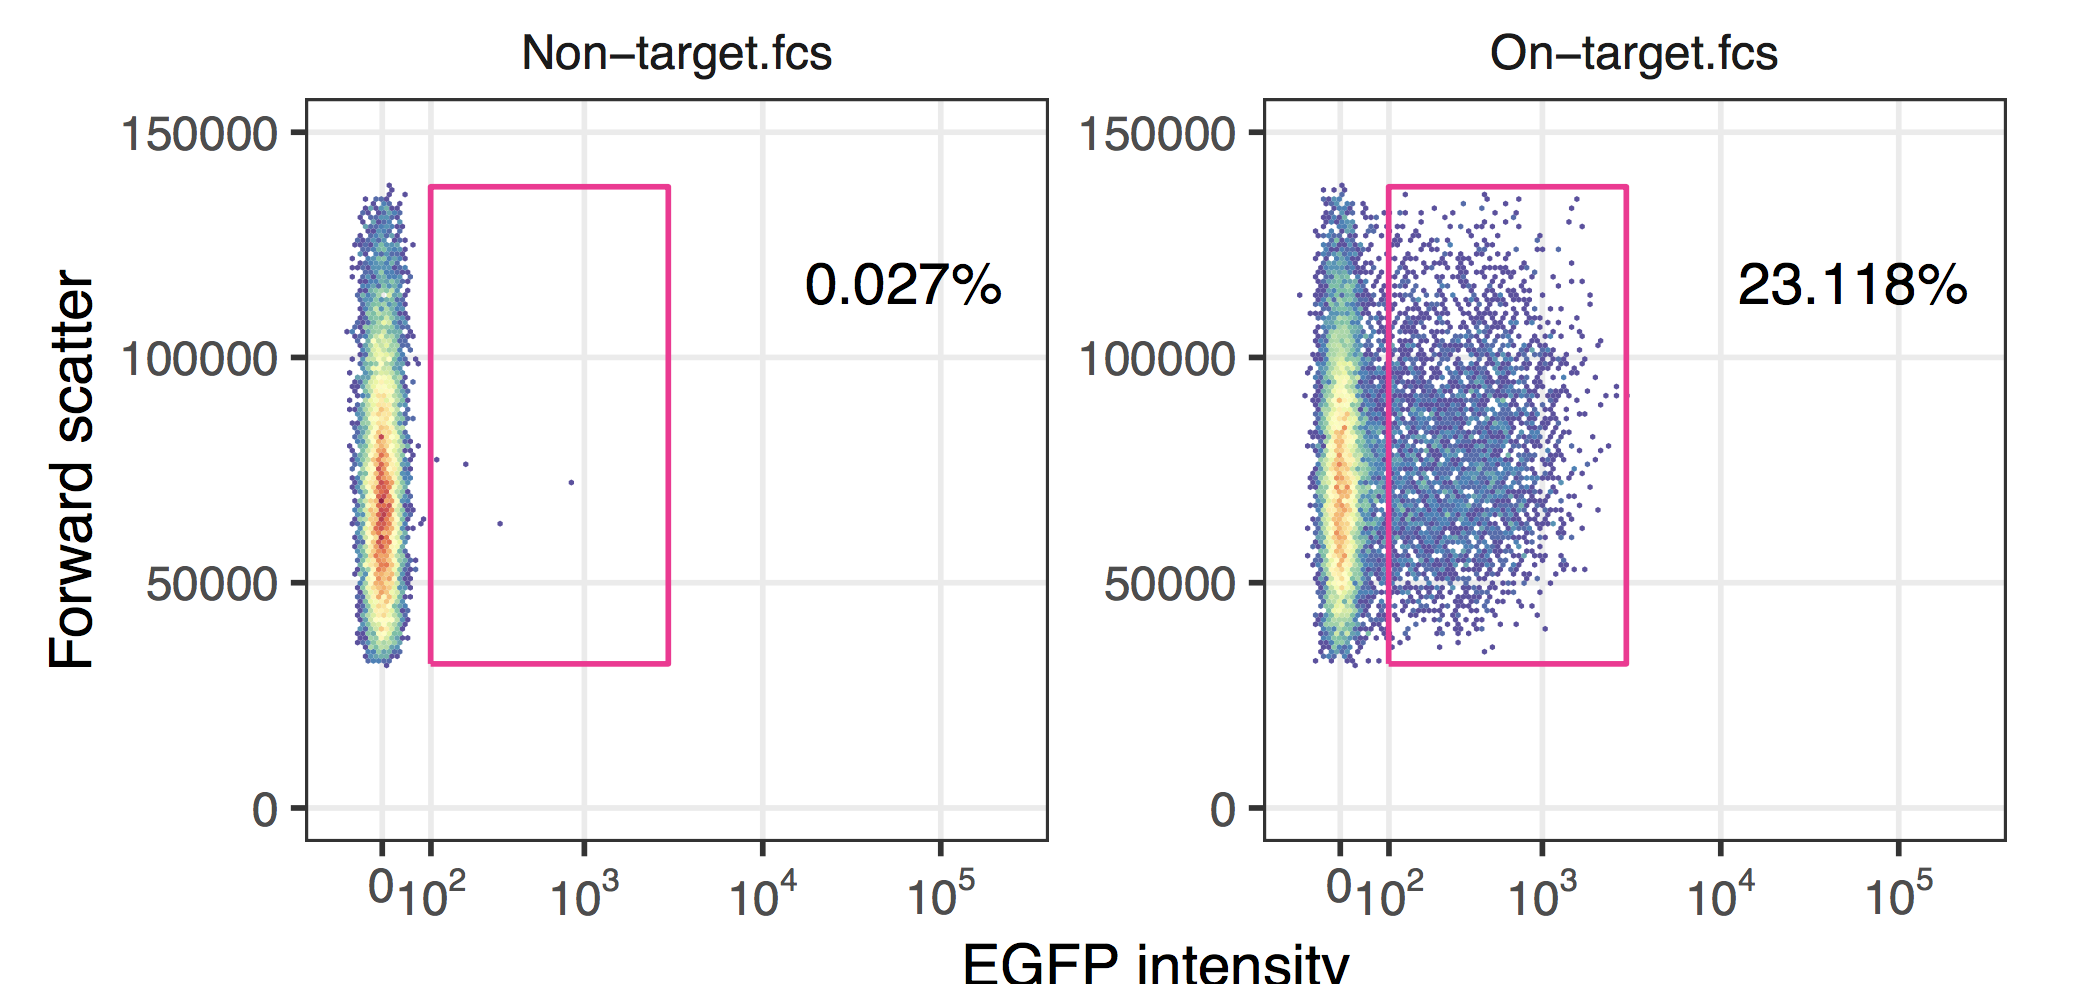
Plot gate and event data from fcs and gating_ml.xml files
This file contains hidden or bidirectional Unicode text that may be interpreted or compiled differently than what appears below. To review, open the file in an editor that reveals hidden Unicode characters.
Learn more about bidirectional Unicode characters
| library(CytoML) | |
| library(flowWorkspace) | |
| library(ggcyto) | |
| fcsFiles <- list.files(pattern='.fcs', path='./FCS/data_path_dir', full.names=TRUE) | |
| xmlfile <- 'Gate.xml' | |
| gs <- cytobank2GatingSet(xmlfile, fcsFiles) | |
| g <- ggcyto(gs, aes(x='FITC-A', y='FSC-A'), subset="P1") + | |
| geom_hex(bins=128) + | |
| geom_gate(c("P2"), colour='deeppink') + | |
| geom_stats(type='percent', digits=2, fill=NA, adjust=0.8) + | |
| axis_x_inverse_trans() + | |
| axis_y_inverse_trans() + | |
| scale_x_logicle(t=100000) + | |
| scale_y_continuous(limits=c(0, 150000)) + | |
| ggcyto_par_set(limits = "instrument") + | |
| labs(x='EGFP intensity', y='Forward scatter') + | |
| theme_bw() + | |
| theme( | |
| strip.background=element_rect(colour=NA, fill=NA), | |
| panel.grid.minor=element_blank(), | |
| aspect.ratio=1) | |
| ggsave(plot=g, filename='FCS_plot.pdf', w=6, h=3) | |
Author
soh-i
commented
Jan 30, 2020
Sign up for free
to join this conversation on GitHub.
Already have an account?
Sign in to comment