Last active
July 12, 2021 22:17
-
-
Save stephanbogner/f2bd9e370a21a8ad21f4e61a9ea6ea1d to your computer and use it in GitHub Desktop.
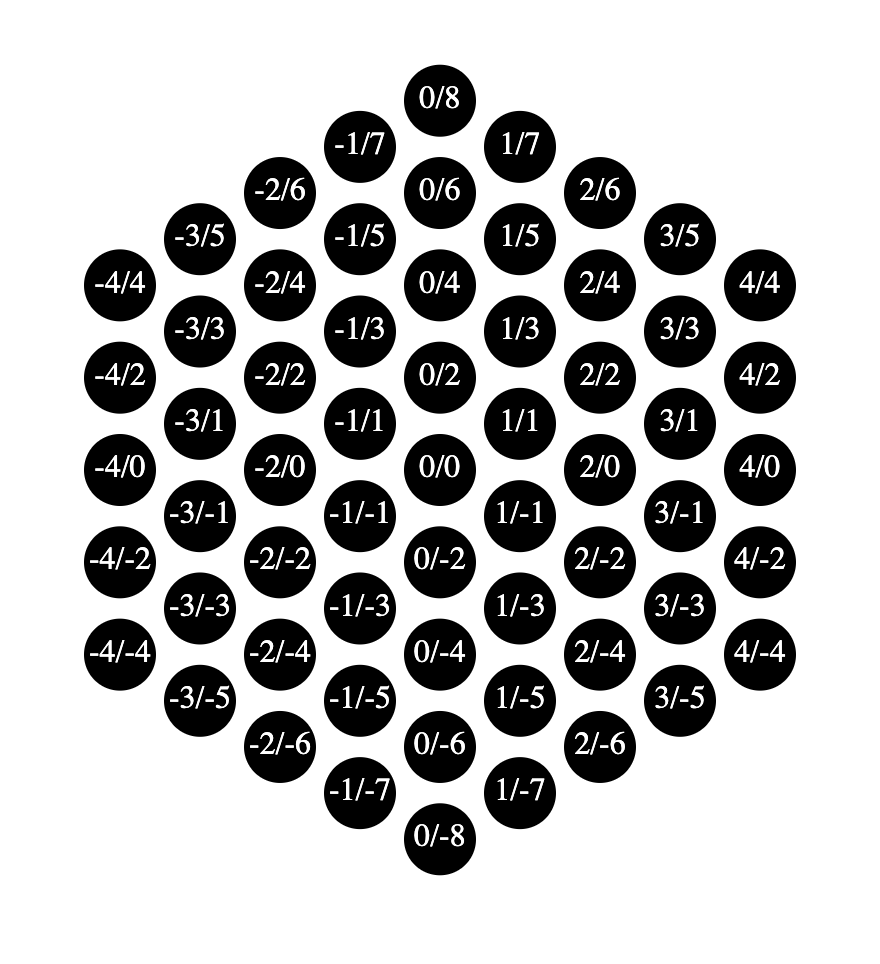
Create hexagon from cube (unusual derivation but clean algorithm) and render with D3
This file contains bidirectional Unicode text that may be interpreted or compiled differently than what appears below. To review, open the file in an editor that reveals hidden Unicode characters.
Learn more about bidirectional Unicode characters
| <!-- Screenshot of how it looks like below --> | |
| <script src="https://cdnjs.cloudflare.com/ajax/libs/d3/7.0.0/d3.min.js" integrity="sha512-0x7/VCkKLLt4wnkFqI8Cgv6no+AaS1TDgmHLOoU3hy/WVtYta2J6gnOIHhYYDJlDxPqEqAYLPS4gzVex4mGJLw==" crossorigin="anonymous" referrerpolicy="no-referrer"></script> | |
| <div id="output"> | |
| </div> | |
| <script type="text/javascript"> | |
| var svgCanvas = d3.select("#output") | |
| .append("svg") | |
| .attr("width", 1000) | |
| .attr("height", 1000); | |
| const center = { | |
| x: 1000 / 2, | |
| y: 1000 / 2 | |
| } | |
| const scale = { | |
| x: 40, | |
| y: 40*0.577 | |
| } | |
| // 57,7% is what it takes to make a line that is 45° normally to be 30° which is what the isometric view is made up of | |
| // Math style proof: | |
| // - normal view: tan(45°) = (opposite side) / (adjacent side) = deltaYnormal / deltaX | |
| // - isometric view: tan(30°) = deltaYiso / deltaX | |
| // For both adjacent side which I called deltaX is the same because we only scale in y direction which gets us: | |
| // - normal view: deltaX = deltaYnormal / tan(45°) | |
| // - isometric view: deltaX = deltaYiso / tan(30°) | |
| // -> deltaYnormal / tan(45°) = deltaYiso / tan(30°) | |
| // With: | |
| // tan(45°) = 1 | |
| // tan(30°) = 0.57735 | |
| // deltaYnormal = deltaYiso / 0.57735 | |
| // -> deltaYnormal * 0.57735 = deltaYiso | |
| const nodes = createNodes(4); | |
| drawPoints(nodes.array) | |
| function createNodes(numberOfRings){ | |
| let nodesLUT = {}; | |
| let nodesArray = []; | |
| const edgeLength = numberOfRings + 1; | |
| for(let cubeX = 0; cubeX < edgeLength; cubeX++){ | |
| for(let cubeY = 0; cubeY < edgeLength; cubeY++){ | |
| for(let cubeZ = 0; cubeZ < edgeLength; cubeZ++){ | |
| // Idea from https://www.redblobgames.com/grids/hexagons/ | |
| if(cubeX === 0 || cubeY === 0 || cubeZ === 0){ | |
| // If any of the coordinates is 0, that means it's a point on one of 3 sides | |
| const projectedX = cubeY - cubeX; | |
| const projectedY = cubeX + cubeY - cubeZ * 2; | |
| let node = { | |
| x: projectedX, | |
| y: projectedY | |
| } | |
| const id = node.x + '/' + node.y; | |
| nodesLUT[id] = node; //Not necessary for drawing, but nice for using later for other purposes | |
| nodesArray.push(node) | |
| } | |
| } | |
| } | |
| } | |
| return { | |
| array: nodesArray, | |
| lut: nodesLUT | |
| }; | |
| } | |
| function drawPoints(nodesArray){ | |
| var selection = svgCanvas.selectAll("g") | |
| .data(nodes.array) | |
| .enter() | |
| .append("g") | |
| .attr("transform", function(d){ return "translate("+(d.x * scale.x+center.x)+","+(-d.y * scale.y+center.y)+")" }) | |
| selection.append("circle") | |
| .attr("r", 18) | |
| .style("fill", "black") | |
| selection.append("text") | |
| .text(function(d){ return d.x + "/" + d.y }) | |
| .attr('text-anchor', 'middle') | |
| .attr('alignment-baseline', 'middle') | |
| .attr('fill', 'white') | |
| } | |
| </script> |
Sign up for free
to join this conversation on GitHub.
Already have an account?
Sign in to comment
Result:
