Twister daily traffic graph (demo)
A D3 visualization of Twister traffic statistics from TwisterIO.
This code was forked from a d3noobs example.
Thanks.
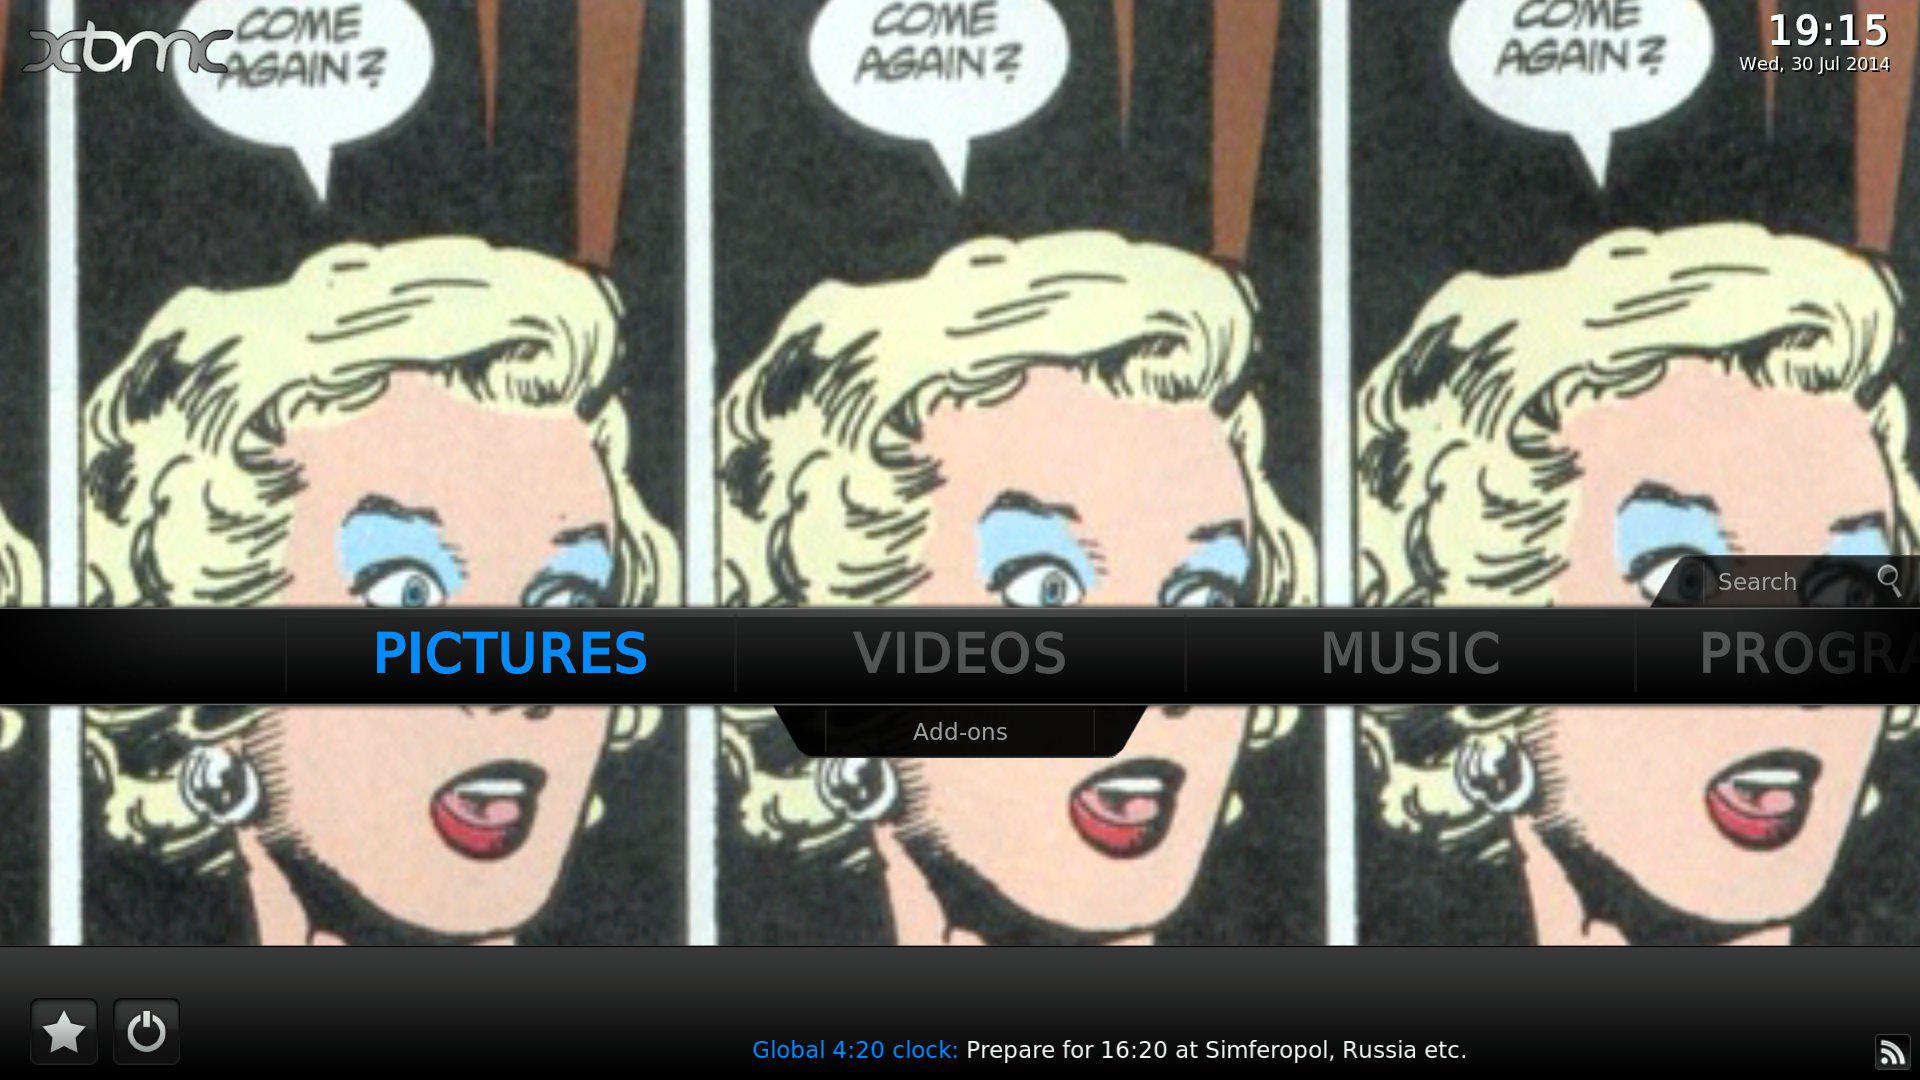
This tweak lets you see a ticker based on the [https://zzzen.com/420](global 4:20pm clock)'s feed, but with shorter phrasing (to minimize the damage of XBMC's merciless title truncation).
/PATH/TO/STATIC/WEB/FOLDER/ (you can even do this on the xbmc machine itself).420.rss as an RSS source. Update every minute (it's a cheap operation).Enjoy
Wallpaper credit: Ann Nocenti and Sean Phillips (Kid Eternity, issue #6, 1993).
Update: This prototype has turned into a bigger project: http://is.gd/CableWeaver
Here's a small gallery of Cable2Graph cable reference culsters (the graphs are named after countries, but they don't "represent" the entire body of cables related to them. It's just a handy naming convention). Each node (circle) represents a cable. Each link (line) represents reference between 2 cables.
https://gist.github.com/4544529 (demo) was my first d3 adventure, where I scraped signatures from a White House petition and showed them as a pie chart.
Here, I show them as a US heat map (based on one of Mike Bostock's map demos). You can click on a state, and see how many signatures came from it.
Darker color means more signatures, but since the numbers range from a few dozens to >4500, the scale is logarithmic.
I don't know yet how to use log() interpolators (I promise to learn), so I just did it quick and dirty with linear() and masking tape.
Example of embedded http://thorrents.com search, and a tribute to Cory Doctorow ;) tnx to @thedod
See it live here.
If you want to embed this (or any other search) in an existing page:
<body/>.query to whatever you want to search (and maybe change limit).