Created
March 21, 2018 02:48
-
-
Save trinker/f83c0752bd3d18a325829eb76449e9e6 to your computer and use it in GitHub Desktop.
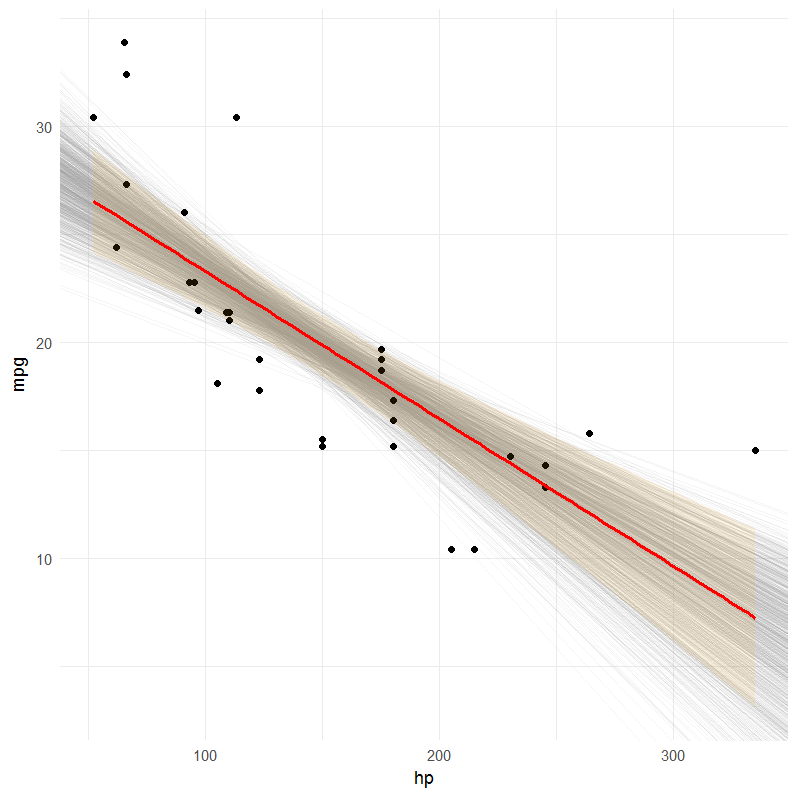
Shape of confidence interval for predicted values in linear regression
This file contains hidden or bidirectional Unicode text that may be interpreted or compiled differently than what appears below. To review, open the file in an editor that reveals hidden Unicode characters.
Learn more about bidirectional Unicode characters
| # based on https://stats.stackexchange.com/q/85560/7482 | |
| if (!require("pacman")) install.packages("pacman") | |
| pacman::p_load(dplyr, ggplot2) | |
| boot_dat <- lapply(1:1000, function(i){ | |
| inds <- sample.int(nrow(mtcars), replace = TRUE) | |
| lm(mpg ~ hp, data = mtcars[inds, c('mpg', 'hp')]) | |
| }) %>% | |
| lapply(function(x) setNames(as.data.frame(t(c(x$coeff))), c('intercept', 'slope'))) %>% | |
| bind_rows() %>% | |
| mutate(id = as.character(seq_len(n()))) %>% | |
| tbl_df() | |
| ggplot(data = mtcars, aes(hp, mpg)) + | |
| geom_abline(data = boot_dat, aes(slope = slope, intercept = intercept, group = id), | |
| color = 'grey60', alpha = .1) + | |
| geom_point() + | |
| geom_smooth(method = 'lm', color = 'red', fill = 'orange', alpha = .1) + | |
| theme_minimal() |
Author
trinker
commented
Mar 21, 2018
Sign up for free
to join this conversation on GitHub.
Already have an account?
Sign in to comment