Last active
September 2, 2021 09:37
-
-
Save ugo-nama-kun/2e1a089a751991728241dd823fb5eaf4 to your computer and use it in GitHub Desktop.
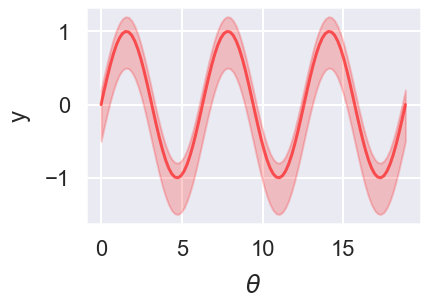
Simplest possible upper & lower bound plot using matplotlib
This file contains hidden or bidirectional Unicode text that may be interpreted or compiled differently than what appears below. To review, open the file in an editor that reveals hidden Unicode characters.
Learn more about bidirectional Unicode characters
| import matplotlib.pyplot as plt | |
| import numpy as np | |
| N = 100 | |
| x = np.linspace(0, 6*np.pi, N) | |
| y = np.sin(x) | |
| upper = y + 0.2 | |
| lower = y - 0.5 | |
| plt.plot(x, y, color = (1, 0, 0, 0.6)) | |
| plt.fill_between(x, upper, lower, color = (1, 0, 0, 0.2)) | |
| plt.xlabel(r'$\theta$', labelpad = 15) | |
| plt.ylabel('y', labelpad = 15) | |
| plt.show() |
Author
ugo-nama-kun
commented
Sep 2, 2021
Sign up for free
to join this conversation on GitHub.
Already have an account?
Sign in to comment