Created
September 13, 2023 18:23
-
-
Save uwezi/1319f0450c3f586be904f75436635eae to your computer and use it in GitHub Desktop.
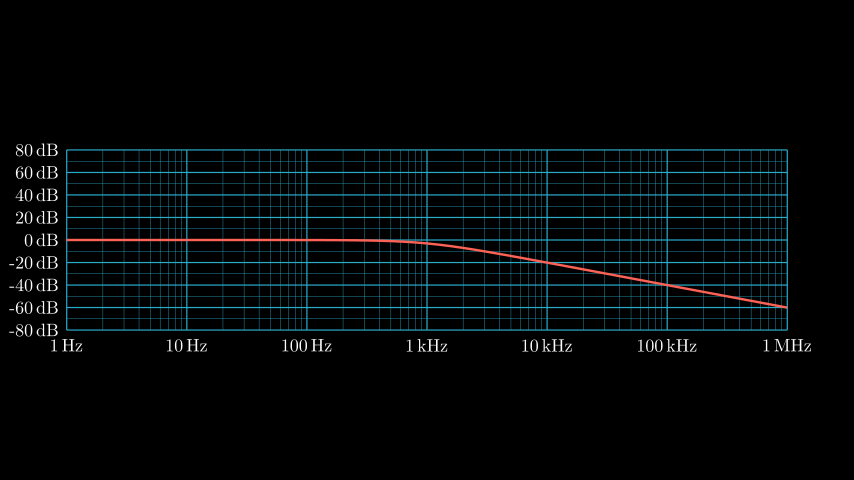
[Bodeplot] preview of code for a new coordinate system #manim #semilog #plot #numberplane
This file contains hidden or bidirectional Unicode text that may be interpreted or compiled differently than what appears below. To review, open the file in an editor that reveals hidden Unicode characters.
Learn more about bidirectional Unicode characters
| from __future__ import annotations | |
| from manim import * | |
| from typing import TYPE_CHECKING, Any, Callable, Iterable, Sequence | |
| class semilogx(NumberPlane): | |
| def SIformat(self, value, decimals=0, digits=None, unit=""): | |
| sign = +1 | |
| if value < 0: | |
| sign = -1 | |
| value = -value | |
| if value >= 1e-24 and value <= 1e24: | |
| prefixes = ['y','z','a','f','p','n','µ','m','','k','M','G','T','P','E','Z','Y'] | |
| pten24 = int((np.log10(value)+24)/3)*3 | |
| prefix = prefixes[pten24//3] | |
| mantissa = value / (10**(pten24-24)) | |
| if digits != None: | |
| mantLen = int(np.log10(mantissa)) + 1 | |
| if digits > mantLen: | |
| decimals = digits-mantLen | |
| else: | |
| decimals=0 | |
| mantissa = (mantissa // 10**(mantLen-digits)) * 10**(mantLen-digits) | |
| return f"{{:.{decimals}f}}\,{{:s}}".format(sign*mantissa,prefix+unit) | |
| elif value == 0: | |
| return f"{{:.{decimals}f}}\,{{:s}}".format(0,unit) | |
| else: | |
| return "{:.2g}".format(value) | |
| def __init__( | |
| self, | |
| x_range: Sequence[float] | |
| | None = ( | |
| -config["frame_x_radius"], | |
| config["frame_x_radius"], | |
| 1, | |
| ), | |
| y_range: Sequence[float] | |
| | None = ( | |
| -config["frame_y_radius"], | |
| config["frame_y_radius"], | |
| 1, | |
| ), | |
| x_length: float | None = None, | |
| y_length: float | None = None, | |
| x_unit="Hz", | |
| y_unit="dB", | |
| background_line_style: dict | None = None, | |
| faded_line_style: dict | None = None, | |
| faded_line_ratio: int = 1, | |
| make_smooth_after_applying_functions: bool = True, | |
| **kwargs, | |
| ): | |
| # init | |
| if x_range[0] <= 0: | |
| raise Exception("wrong lower limit on x_range") | |
| self.x_unit = x_unit | |
| self.y_unit = y_unit | |
| super().__init__( | |
| x_range=[int(np.log10(x_range[0])),int(np.log10(x_range[1])+0.99),1], | |
| y_range=y_range, | |
| x_length=x_length, | |
| y_length=y_length, | |
| axis_config={"stroke_width":3}, | |
| x_axis_config={"scaling": LogBase()}, | |
| y_axis_config={"scaling": LinearBase()}, | |
| tips=False, | |
| **kwargs, | |
| ) | |
| # remove all lines created automatically | |
| self.remove(self.background_lines) | |
| self.remove(self.x_axis[0]) | |
| self.remove(self.y_axis[0]) | |
| self.x_labels = VGroup( | |
| *[Tex(self.SIformat(10**x, digits=1, unit=x_unit)).scale(0.6) | |
| .next_to(self.c2p(10**x,self.y_range[0]), DOWN, buff=0.15) | |
| for x in np.arange(self.x_range[0],self.x_range[1]+1,self.x_range[2])] | |
| ) | |
| self.add(self.x_labels) | |
| self.y_labels = VGroup( | |
| *[Tex(self.SIformat(y, digits=1, unit=y_unit)).scale(0.6) | |
| .next_to(self.c2p(10**self.x_range[0],y), LEFT, buff=0.15) | |
| for y in np.arange(self.y_range[0],self.y_range[1]+1,self.y_range[2])] | |
| ) | |
| self.add(self.y_labels) | |
| background_line_stroke_color = self.background_line_style['stroke_color'] | |
| background_line_stroke_width = self.background_line_style['stroke_width'] | |
| background_line_stroke_opacity = self.background_line_style['stroke_opacity'] | |
| self.x_major_grid = VGroup( | |
| *[ | |
| Line(self.c2p(n*10**x,self.y_range[0]), self.c2p(n*10**x,self.y_range[1]), | |
| stroke_color=background_line_stroke_color, | |
| stroke_width = background_line_stroke_width, | |
| stroke_opacity = background_line_stroke_opacity, | |
| ) | |
| for n in [1] for x in np.arange(self.x_range[0],self.x_range[1]+1,self.x_range[2]) | |
| ] | |
| ) | |
| self.add(self.x_major_grid) | |
| self.y_major_grid = VGroup( | |
| *[ | |
| Line(self.c2p(10**self.x_range[0],y), self.c2p(10**self.x_range[1],y), | |
| stroke_color=background_line_stroke_color, | |
| stroke_width = background_line_stroke_width, | |
| stroke_opacity = background_line_stroke_opacity, | |
| ) | |
| for n in [1] for y in np.arange(self.y_range[0],self.y_range[1]+1,self.y_range[2]) | |
| ] | |
| ) | |
| self.add(self.y_major_grid) | |
| background_line_stroke_width = self.background_line_style['stroke_width']/3 | |
| self.x_minor_grid = VGroup( | |
| *[ | |
| Line(self.c2p(n*10**x,self.y_range[0]), self.c2p(n*10**x,self.y_range[1]), | |
| stroke_color=background_line_stroke_color, | |
| stroke_width = background_line_stroke_width, | |
| stroke_opacity = background_line_stroke_opacity, | |
| ) | |
| for n in [2,3,4,5,6,7,8,9] for x in np.arange(self.x_range[0],self.x_range[1],self.x_range[2]) | |
| ] | |
| ) | |
| self.add(self.x_minor_grid) | |
| self.y_minor_grid = VGroup( | |
| *[ | |
| Line(self.c2p(10**self.x_range[0], n*self.y_range[2]+y), self.c2p(10**self.x_range[1], n*self.y_range[2]+y), | |
| stroke_color=background_line_stroke_color, | |
| stroke_width = background_line_stroke_width, | |
| stroke_opacity = background_line_stroke_opacity, | |
| ) | |
| for n in [.5] for y in np.arange(self.y_range[0],self.y_range[1],self.y_range[2]) | |
| ] | |
| ) | |
| self.add(self.y_minor_grid) | |
| class semilogy(NumberPlane): | |
| def SIformat(self, value, decimals=0, digits=None, unit=""): | |
| sign = +1 | |
| if value < 0: | |
| sign = -1 | |
| value = -value | |
| if value >= 1e-24 and value <= 1e24: | |
| prefixes = ['y','z','a','f','p','n','µ','m','','k','M','G','T','P','E','Z','Y'] | |
| pten24 = int((np.log10(value)+24)/3)*3 | |
| prefix = prefixes[pten24//3] | |
| mantissa = value / (10**(pten24-24)) | |
| if digits != None: | |
| mantLen = int(np.log10(mantissa)) + 1 | |
| if digits > mantLen: | |
| decimals = digits-mantLen | |
| else: | |
| decimals=0 | |
| mantissa = (mantissa // 10**(mantLen-digits)) * 10**(mantLen-digits) | |
| return f"{{:.{decimals}f}}\,{{:s}}".format(sign*mantissa,prefix+unit) | |
| elif value == 0: | |
| return f"{{:.{decimals}f}}\,{{:s}}".format(0,unit) | |
| else: | |
| return "{:.2g}".format(value) | |
| def __init__( | |
| self, | |
| x_range: Sequence[float] | |
| | None = ( | |
| -config["frame_x_radius"], | |
| config["frame_x_radius"], | |
| 1, | |
| ), | |
| y_range: Sequence[float] | |
| | None = ( | |
| -config["frame_y_radius"], | |
| config["frame_y_radius"], | |
| 1, | |
| ), | |
| x_length: float | None = None, | |
| y_length: float | None = None, | |
| x_unit="Hz", | |
| y_unit="dB", | |
| background_line_style: dict | None = None, | |
| faded_line_style: dict | None = None, | |
| faded_line_ratio: int = 1, | |
| make_smooth_after_applying_functions: bool = True, | |
| **kwargs, | |
| ): | |
| # init | |
| if x_range[0] <= 0: | |
| raise Exception("wrong lower limit on x_range") | |
| self.x_unit = x_unit | |
| self.y_unit = y_unit | |
| super().__init__( | |
| x_range=[int(np.log10(x_range[0])),int(np.log10(x_range[1])+0.99),1], | |
| y_range=y_range, | |
| x_length=x_length, | |
| y_length=y_length, | |
| axis_config={"stroke_width":3}, | |
| x_axis_config={"scaling": LogBase()}, | |
| y_axis_config={"scaling": LinearBase()}, | |
| tips=False, | |
| **kwargs, | |
| ) | |
| # remove all lines created automatically | |
| self.remove(self.background_lines) | |
| self.remove(self.x_axis[0]) | |
| self.remove(self.y_axis[0]) | |
| self.x_labels = VGroup( | |
| *[Tex(self.SIformat(10**x, digits=1, unit=x_unit)).scale(0.6) | |
| .next_to(self.c2p(10**x,self.y_range[0]), DOWN, buff=0.15) | |
| for x in np.arange(self.x_range[0],self.x_range[1]+1,self.x_range[2])] | |
| ) | |
| self.add(self.x_labels) | |
| self.y_labels = VGroup( | |
| *[Tex(self.SIformat(y, digits=1, unit=y_unit)).scale(0.6) | |
| .next_to(self.c2p(10**self.x_range[0],y), LEFT, buff=0.15) | |
| for y in np.arange(self.y_range[0],self.y_range[1]+1,self.y_range[2])] | |
| ) | |
| self.add(self.y_labels) | |
| background_line_stroke_color = self.background_line_style['stroke_color'] | |
| background_line_stroke_width = self.background_line_style['stroke_width'] | |
| background_line_stroke_opacity = self.background_line_style['stroke_opacity'] | |
| self.x_major_grid = VGroup( | |
| *[ | |
| Line(self.c2p(n*10**x,self.y_range[0]), self.c2p(n*10**x,self.y_range[1]), | |
| stroke_color=background_line_stroke_color, | |
| stroke_width = background_line_stroke_width, | |
| stroke_opacity = background_line_stroke_opacity, | |
| ) | |
| for n in [1] for x in np.arange(self.x_range[0],self.x_range[1]+1,self.x_range[2]) | |
| ] | |
| ) | |
| self.add(self.x_major_grid) | |
| self.y_major_grid = VGroup( | |
| *[ | |
| Line(self.c2p(10**self.x_range[0],y), self.c2p(10**self.x_range[1],y), | |
| stroke_color=background_line_stroke_color, | |
| stroke_width = background_line_stroke_width, | |
| stroke_opacity = background_line_stroke_opacity, | |
| ) | |
| for n in [1] for y in np.arange(self.y_range[0],self.y_range[1]+1,self.y_range[2]) | |
| ] | |
| ) | |
| self.add(self.y_major_grid) | |
| background_line_stroke_width = self.background_line_style['stroke_width']/3 | |
| self.x_minor_grid = VGroup( | |
| *[ | |
| Line(self.c2p(n*10**x,self.y_range[0]), self.c2p(n*10**x,self.y_range[1]), | |
| stroke_color=background_line_stroke_color, | |
| stroke_width = background_line_stroke_width, | |
| stroke_opacity = background_line_stroke_opacity, | |
| ) | |
| for n in [2,3,4,5,6,7,8,9] for x in np.arange(self.x_range[0],self.x_range[1],self.x_range[2]) | |
| ] | |
| ) | |
| self.add(self.x_minor_grid) | |
| self.y_minor_grid = VGroup( | |
| *[ | |
| Line(self.c2p(10**self.x_range[0], n*self.y_range[2]+y), self.c2p(10**self.x_range[1], n*self.y_range[2]+y), | |
| stroke_color=background_line_stroke_color, | |
| stroke_width = background_line_stroke_width, | |
| stroke_opacity = background_line_stroke_opacity, | |
| ) | |
| for n in [.5] for y in np.arange(self.y_range[0],self.y_range[1],self.y_range[2]) | |
| ] | |
| ) | |
| self.add(self.y_minor_grid) | |
| class test_semilogx(Scene): | |
| def construct(self): | |
| ax = semilogx( | |
| x_range=[1,1e6], # powers of ten! | |
| x_length=12, | |
| y_range=[-80,80,20], | |
| y_length=3, | |
| ) | |
| self.add(ax) | |
| def lp(f): | |
| return 1.0/(1.0 + 1j*2*PI*f*1600*100e-9) | |
| ampliplot = ax.plot(lambda x: 20*np.log10( np.abs(lp(x)))).set_color(RED) | |
| self.add(ampliplot) | |
Sign up for free
to join this conversation on GitHub.
Already have an account?
Sign in to comment