https://discord.com/channels/581738731934056449/1025728276343296031/1025765609667047454
| # https://discord.com/channels/581738731934056449/1025728276343296031/1025765609667047454 | |
| from manim import * | |
| class myAnimation(Scene): | |
| CONFIG = { | |
| "x_length": 10, | |
| "y_length": 4, | |
| #"n_ticks": 4, | |
| #"tick_width": 0.2, | |
| #"label_y_axis": False, | |
| #"y_axis_label_height": 0.25, | |
| "y_range": [0, 100, 10], | |
| "bar_colors": [BLUE, YELLOW], | |
| "bar_fill_opacity": 0.8, | |
| "bar_stroke_width": 0, | |
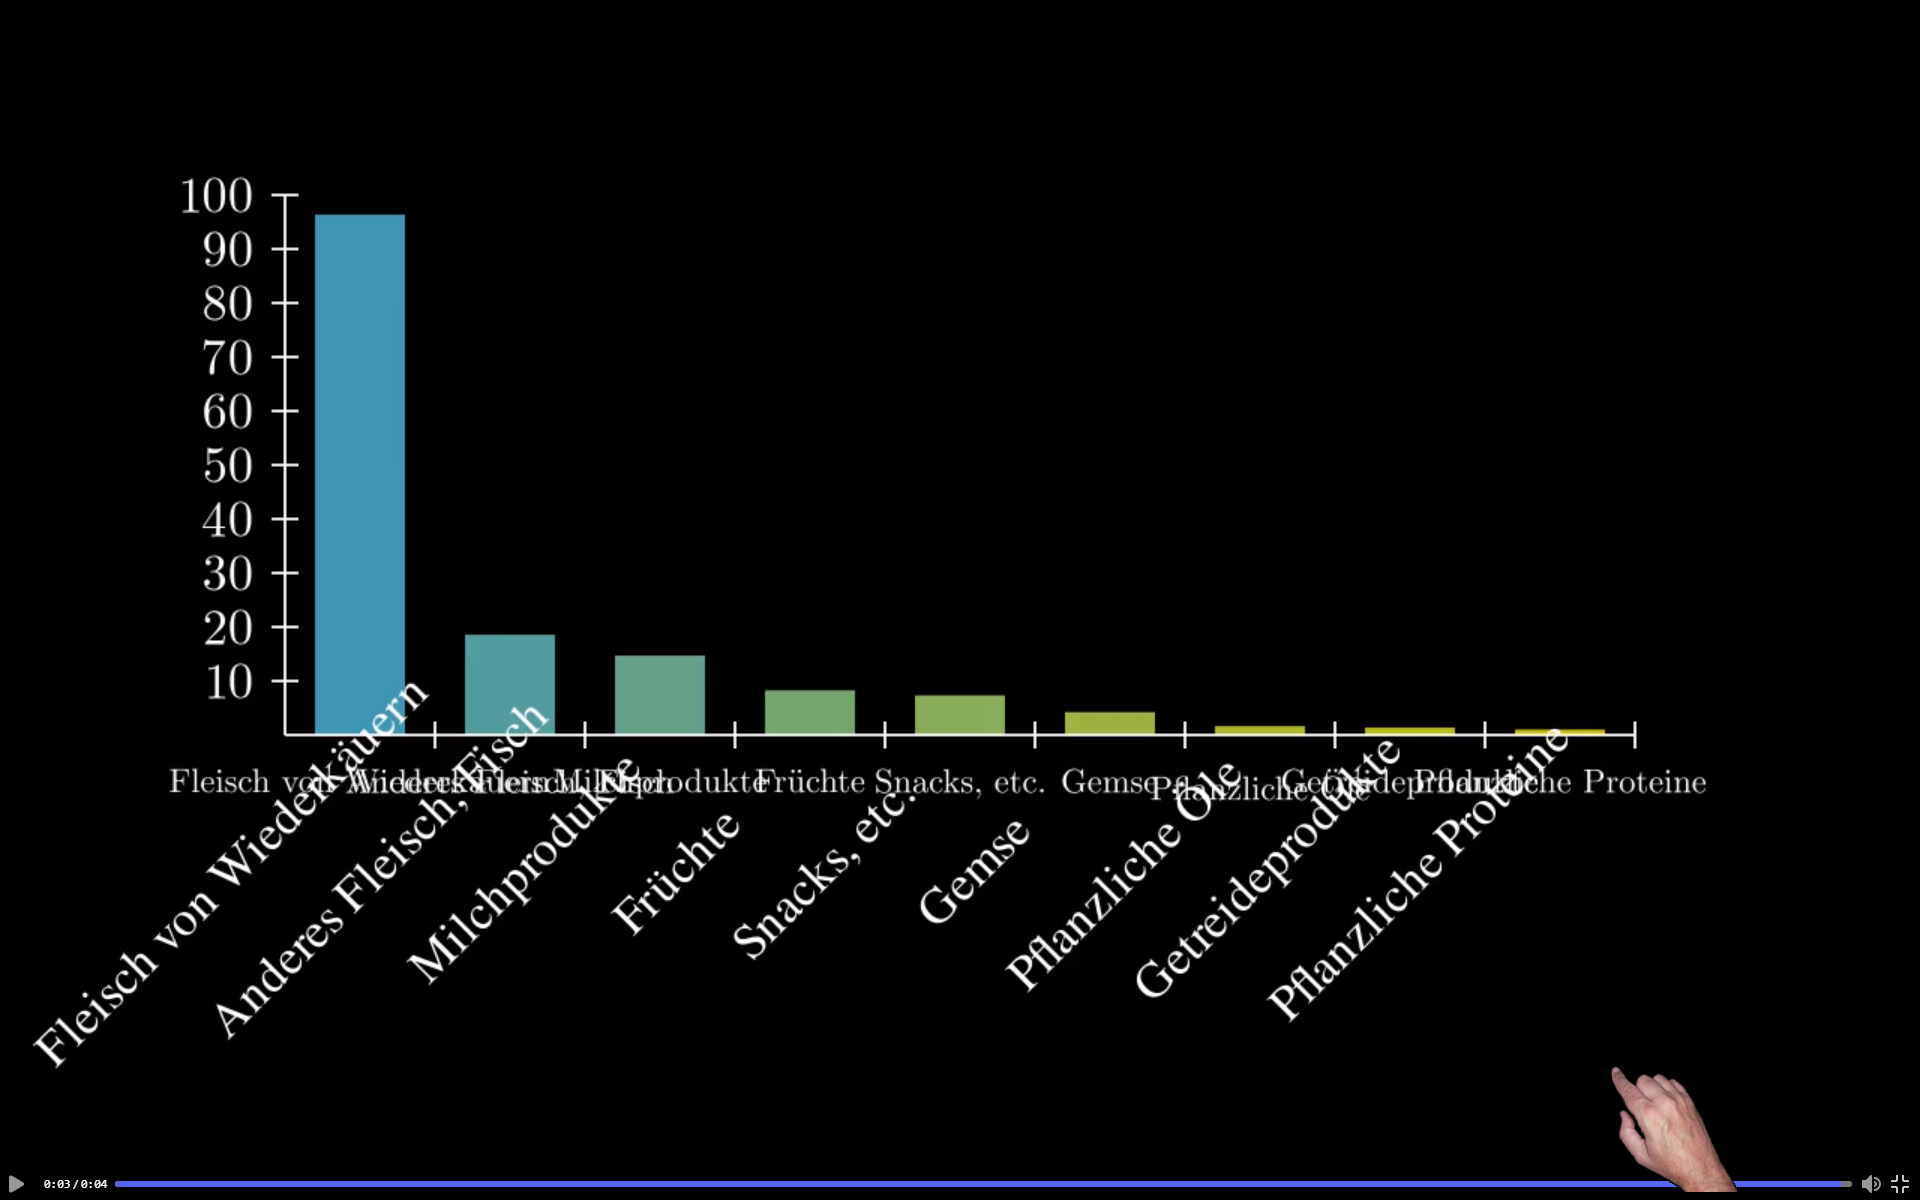
| "bar_names": ["Fleisch von Wiederkäuern","Anderes Fleisch, Fisch","Milchprodukte","Früchte", "Snacks, etc.","Gemse","Pflanzliche Öle","Getreideprodukte", "Pflanzliche Proteine"], | |
| #"bar_label_scale_val": 0 | |
| } | |
| def construct(self): | |
| bar_names=["Fleisch von Wiederkäuern","Anderes Fleisch, Fisch","Milchprodukte","Früchte", "Snacks, etc.","Gemse","Pflanzliche Öle","Getreideprodukte", "Pflanzliche Proteine"] | |
| Lsize=0.55 | |
| Lseparation=1.1 | |
| Lpositionx=-5.4 | |
| Lpositiony=2 | |
| bar_labels = VGroup() | |
| for i in range(len(bar_names)): | |
| label = Text(bar_names[i]) | |
| label.scale(Lsize) | |
| label.move_to(DOWN*Lpositiony+(i*Lseparation+Lpositionx)*RIGHT) | |
| label.rotate(np.pi*(1.5/6)) | |
| bar_labels.add(label) | |
| composition = [96.350861, 18.5706488, 14.7071608, 8.25588773, 7.33856028, 4.24083463, 1.65574964, 1.36437485, 1] | |
| chart = BarChart(values=composition, **self.CONFIG) | |
| chart.shift(UP) | |
| self.play(Write(chart),Write(bar_labels), run_time=2) | |
| self.wait(2) |