-
-
Save vantruong1094/9d9283b837cb78732310439c029eb170 to your computer and use it in GitHub Desktop.
This file contains hidden or bidirectional Unicode text that may be interpreted or compiled differently than what appears below. To review, open the file in an editor that reveals hidden Unicode characters.
Learn more about bidirectional Unicode characters
| // | |
| // PieChart.swift | |
| // NokiaGame | |
| // | |
| // Created by Prafulla Singh on 13/9/20. | |
| // Copyright © 2020 Prafulla Singh. All rights reserved. | |
| // | |
| import SwiftUI | |
| struct PieChartCell: Shape { | |
| let startAngle: Angle | |
| let endAngle: Angle | |
| func path(in rect: CGRect) -> Path { | |
| let center = CGPoint.init(x: (rect.origin.x + rect.width)/2, y: (rect.origin.y + rect.height)/2) | |
| let radii = min(center.x, center.y) | |
| let path = Path { p in | |
| p.addArc(center: center, | |
| radius: radii, | |
| startAngle: startAngle, | |
| endAngle: endAngle, | |
| clockwise: true) | |
| p.addLine(to: center) | |
| } | |
| return path | |
| } | |
| } | |
| struct InnerCircle: Shape { | |
| let ratio: CGFloat | |
| func path(in rect: CGRect) -> Path { | |
| let center = CGPoint.init(x: (rect.origin.x + rect.width)/2, y: (rect.origin.y + rect.height)/2) | |
| let radii = min(center.x, center.y) * ratio | |
| let path = Path { p in | |
| p.addArc(center: center, | |
| radius: radii, | |
| startAngle: Angle(degrees: 0), | |
| endAngle: Angle(degrees: 360), | |
| clockwise: true) | |
| p.addLine(to: center) | |
| } | |
| return path | |
| } | |
| } | |
| struct DonutChart: View { | |
| @State private var selectedCell: UUID = UUID() | |
| let dataModel: ChartDataModel | |
| let onTap: (ChartCellModel?) -> () | |
| var body: some View { | |
| ZStack { | |
| PieChart(dataModel: dataModel, onTap: onTap) | |
| InnerCircle(ratio: 1/3).foregroundColor(.white) | |
| } | |
| } | |
| } | |
| struct PieChart: View { | |
| @State private var selectedCell: UUID = UUID() | |
| let dataModel: ChartDataModel | |
| let onTap: (ChartCellModel?) -> () | |
| var body: some View { | |
| ZStack { | |
| ForEach(dataModel.chartCellModel) { dataSet in | |
| PieChartCell(startAngle: self.dataModel.angle(for: dataSet.value), endAngle: self.dataModel.startingAngle) | |
| .foregroundColor(dataSet.color) | |
| .onTapGesture { | |
| withAnimation { | |
| if self.selectedCell == dataSet.id { | |
| self.onTap(nil) | |
| self.selectedCell = UUID() | |
| } else { | |
| self.selectedCell = dataSet.id | |
| self.onTap(dataSet) | |
| } | |
| } | |
| }.scaleEffect((self.selectedCell == dataSet.id) ? 1.05 : 1.0) | |
| } | |
| } | |
| } | |
| } | |
| struct ContentView: View { | |
| @State var selectedPie: String = "" | |
| @State var selectedDonut: String = "" | |
| var body: some View { | |
| ScrollView { | |
| VStack { | |
| HStack(spacing: 20) { | |
| PieChart(dataModel: ChartDataModel.init(dataModel: sample), onTap: { | |
| dataModel in | |
| if let dataModel = dataModel { | |
| self.selectedPie = "Subject: \(dataModel.name)\nPointes: \(dataModel.value)" | |
| } else { | |
| self.selectedPie = "" | |
| } | |
| }) | |
| .frame(width: 150, height: 150, alignment: .center) | |
| .padding() | |
| Text(selectedPie) | |
| .font(.footnote) | |
| .multilineTextAlignment(.leading) | |
| Spacer() | |
| } | |
| HStack(spacing: 20) { | |
| DonutChart(dataModel: ChartDataModel.init(dataModel: sample), onTap: { | |
| dataModel in | |
| if let dataModel = dataModel { | |
| self.selectedDonut = "Subject: \(dataModel.name)\nPointes: \(dataModel.value)" | |
| } else { | |
| self.selectedDonut = "" | |
| } | |
| }) | |
| .frame(width: 150, height: 150, alignment: .center) | |
| .padding() | |
| Text(selectedDonut) | |
| .font(.footnote) | |
| .multilineTextAlignment(.leading) | |
| Spacer() | |
| } | |
| Spacer() | |
| HStack { | |
| ForEach(sample) { dataSet in | |
| VStack { | |
| Circle().foregroundColor(dataSet.color) | |
| Text(dataSet.name).font(.footnote) | |
| } | |
| } | |
| } | |
| } | |
| } | |
| } | |
| } | |
| struct PieChart_Previews: PreviewProvider { | |
| static var previews: some View { | |
| ContentView() | |
| } | |
| } | |
| struct ChartCellModel: Identifiable { | |
| let id = UUID() | |
| let color: Color | |
| let value: CGFloat | |
| let name: String | |
| } | |
| final class ChartDataModel: ObservableObject { | |
| var chartCellModel: [ChartCellModel] | |
| var startingAngle = Angle(degrees: 0) | |
| private var lastBarEndAngle = Angle(degrees: 0) | |
| init(dataModel: [ChartCellModel]) { | |
| chartCellModel = dataModel | |
| } | |
| var totalValue: CGFloat { | |
| chartCellModel.reduce(CGFloat(0)) { (result, data) -> CGFloat in | |
| result + data.value | |
| } | |
| } | |
| func angle(for value: CGFloat) -> Angle { | |
| if startingAngle != lastBarEndAngle { | |
| startingAngle = lastBarEndAngle | |
| } | |
| lastBarEndAngle += Angle(degrees: Double(value / totalValue) * 360 ) | |
| print(lastBarEndAngle.degrees) | |
| return lastBarEndAngle | |
| } | |
| } | |
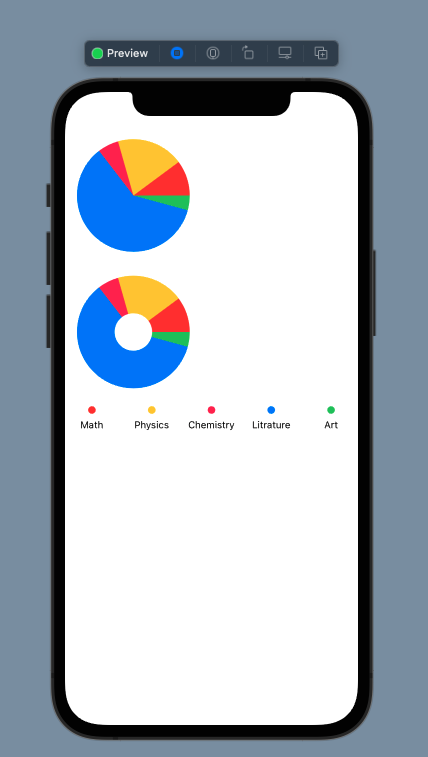
| let sample = [ ChartCellModel(color: Color.red, value: 123, name: "Math"), | |
| ChartCellModel(color: Color.yellow, value: 233, name: "Physics"), | |
| ChartCellModel(color: Color.pink, value: 73, name: "Chemistry"), | |
| ChartCellModel(color: Color.blue, value: 731, name: "Litrature"), | |
| ChartCellModel(color: Color.green, value: 51, name: "Art")] |
Author
vantruong1094
commented
Nov 1, 2022
Sign up for free
to join this conversation on GitHub.
Already have an account?
Sign in to comment