Created
August 28, 2017 17:23
-
-
Save vsimko/79b5a7b48d5d4fcf66e5478feae39372 to your computer and use it in GitHub Desktop.
This file contains hidden or bidirectional Unicode text that may be interpreted or compiled differently than what appears below. To review, open the file in an editor that reveals hidden Unicode characters.
Learn more about bidirectional Unicode characters
| myscatter_lower <- function(data, | |
| point_color = "white", | |
| border_color = NA, | |
| point_size = 3) { | |
| drawcell <- function(fx, fy, datax, datay) { | |
| oldpar <- par(mar = c(0,0,0,0), bg = "white") | |
| on.exit(par(oldpar), add = TRUE) | |
| norm01 <- function(x) { | |
| xmin <- min(x) | |
| xmax <- max(x) | |
| (x - xmin) / (xmax - xmin) | |
| } | |
| # scatterplot | |
| points(fx + norm01(datax) * .8 + .1 - .5, | |
| fy + norm01(datay) * .8 + .1 - .5, | |
| pch = ".", col = point_color, cex = point_size) | |
| # border of the cell | |
| symbols(fx, fy, rectangles = matrix(1, 1, 2), | |
| add = TRUE, inches = FALSE, fg = border_color, bg = NA) | |
| } | |
| for (x in 1:ncol(data)) { | |
| for (y in x:ncol(data)) { | |
| if (x != y) { | |
| drawcell(x, ncol(data) - y + 1, data[,x], data[,y]) | |
| } | |
| } | |
| } | |
| } | |
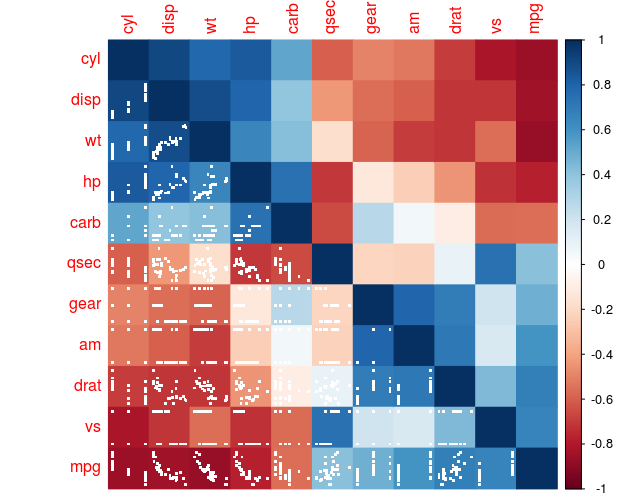
| order <- corrMatOrder(cor(mtcars), order = "FPC") | |
| corrplot(cor(mtcars), method = "color", order = "FPC") | |
| myscatter_lower(mtcars[,order]) |
Author
Sign up for free
to join this conversation on GitHub.
Already have an account?
Sign in to comment
produced output