-
-
Save wch/5436415 to your computer and use it in GitHub Desktop.
| max_plots <- 5 | |
| ui <- fluidPage( | |
| headerPanel("Dynamic number of plots"), | |
| sidebarPanel( | |
| sliderInput("n", "Number of plots", value=1, min=1, max=5) | |
| ), | |
| mainPanel( | |
| # This is the dynamic UI for the plots | |
| uiOutput("plots") | |
| ) | |
| ) | |
| server <- function(input, output) { | |
| # Insert the right number of plot output objects into the web page | |
| output$plots <- renderUI({ | |
| plot_output_list <- lapply(1:input$n, function(i) { | |
| plotname <- paste("plot", i, sep="") | |
| plotOutput(plotname, height = 280, width = 250) | |
| }) | |
| # Convert the list to a tagList - this is necessary for the list of items | |
| # to display properly. | |
| do.call(tagList, plot_output_list) | |
| }) | |
| # Call renderPlot for each one. Plots are only actually generated when they | |
| # are visible on the web page. | |
| for (i in 1:max_plots) { | |
| # Need local so that each item gets its own number. Without it, the value | |
| # of i in the renderPlot() will be the same across all instances, because | |
| # of when the expression is evaluated. | |
| local({ | |
| my_i <- i | |
| plotname <- paste("plot", my_i, sep="") | |
| output[[plotname]] <- renderPlot({ | |
| plot(1:my_i, 1:my_i, | |
| xlim = c(1, max_plots), | |
| ylim = c(1, max_plots), | |
| main = paste("1:", my_i, ". n is ", input$n, sep = "") | |
| ) | |
| }) | |
| }) | |
| } | |
| } | |
| shinyApp(ui, server) |
michmic76, one option is to use plotly. If you make your plotly chart (using native plotly charts, or ggplot2, with the ggplotly call around it), and then replace the renderPlot with renderPlotly and the plotOutput with plotlyOutput, it should work fine. I just tried it on my app and its a breeze.
rghertner, thanks - I did your suggestion, but still didnt work :(
Thanks @saun4app. Your version of script is really useful. Also working on dynamic number of plots in Shiny.
@saun4app I was looking at your script and trying to add the click functionality in the plotOutput call. When doing so, I noticed that you called plotOutput and renderOutput right after each other and even clobbered the data from the plotOutput call. Is the plotOutput doing something here, or is that a typo?
@saun4app How can I get 2 plots in a row.
Thank you! Before reading this and adding the assignment of the local i, my code was working but returning identical plots. Now I know why.
Anyone got this to work inside a module? I have tried everything I could think of with no luck.
With the original code by Chang I get the error for having reactives and with the first example from saun4app my plots never appear. It is as if the code is never called. So I am assuming the namespacing is wrong and hence it never sees the need to execute the code that refers to an incorrect ID.
If it helps my unsuccessful attempt in a rather complex app is here:
https://github.com/stanstrup/QC4Metabolomics/blob/master/Modules/Productivity/shiny_server_heatmap.R#L260
https://github.com/stanstrup/QC4Metabolomics/blob/master/Modules/Productivity/shiny_ui_heatmap.R
EDIT: solved.
Hi, thanks very much for your codes, i need to ggplot 8 graphs in one page , so I chage to this :
max_plots <- 8
But these eight graphs are the same (the last graphics I want), my data from ggplot 1-8 is the 1st to 8th column in a dataframe.
Is there any problem in my code as follows ,
`
max_plots <- 8
mycolor <- c("darkorange","blue","green","darkyellow","lightblue","orange","darkblue","darkgreen")
shinyServer(function(input, output) {
output$plots <- renderUI({
plot_output_list <- lapply(1:max_plots, function(i) {
plotname <- paste("plot", i, sep="")
plotOutput(plotname, height = 280, width = 800)
})
do.call(tagList, plot_output_list)
})
for (i in 1:max_plots) {
# Need local so that each item gets its own number. Without it, the value
# of i in the renderPlot() will be the same across all instances, because
# of when the expression is evaluated.
local({
my_i <- i
plotname <- paste("plot", my_i, sep="")
output[[plotname]] <- renderPlot({
fc <- as.vector((fcap$FC))
ds <- read.csv("mydata.csv",header = T)
dsn <- ds[,1]
ds1 <- as.data.frame(apply(ds[,2:9],2,as.numeric));rownames(ds1) <- dsn
dataset <- ds1
ggplot(dataset,aes(x=as.Date(rownames(dataset)),y=dataset[,i]))+geom_line(color=mycolor[i])+geom_point(size=2,shape = 15,colour = mycolor[i])+geom_hline(aes(yintercept=as.integer(as.character(fcap[which(fcap$FC==colnames(dataset)[i]),2]))),linetype=5)+ggtitle(colnames(dataset)[i])+xlab("Kitting_Date")+ylab("Sum of Pieces")+scale_x_date(breaks = as.Date(rownames(dataset)))+theme(axis.text.x=element_text(angle=45,size=5))
})
})
}
})
`
Right now the below code give the output in the single column. What should I do so that the output plots in row-wise. If a row is occupied completely then the output should be plotted in next row. Ex: if max_plot <- 5 then I want the output in such a fashion that first 2 plots in first row, next two in another row and last plot in third row.
`get_plot_output_list` <- function(max_plots, input_n) {
# Insert plot output objects the list
      plot_output_list <- lapply(1:input_n, function(i) {
            plotname <- paste("plot", i, sep="")
            plot_output_object <- plotOutput(plotname, height = 280, width = 250)
            plot_output_object <- renderPlot({
                  plot(1:i, 1:i, xlim = c(1, max_plots), ylim = c(1, max_plots),
                          main = paste("1:", i, ".  n is ", input_n, sep = ""))
            })
      })
      do.call(tagList, plot_output_list) # needed to display properly.
      return(plot_output_list)
}

shinyServer(function(input, output) {
      observe({
             output$plots <- renderUI({ get_plot_output_list(max_plots, input$n) })
      })
 })
Thanks for this code - this saved me a lot of time.
@lokesh005: to display inline add in plotOutput the argument 'inline=TRUE' and provide in renderPlot arguments for width and height. The Shiny Documentation on plotOutput and renderPlot is very helpful.
Any clues on how to use a reactive() to set you max_plots? For my attempt the user can select a gene and then for each gene I want to plot each probe, not all genes have the same probe. Basically large df is reduced to a df with rough 1-4 rows and I want to be able to plot either 1 plot if only 1 row is returned or 4 if there are four plots.
My attempt which doesn't work is below. Thanks for your code which almost got me there...
library(shiny)
library(hgu133plus2.db)
data = read.delim("nagel_wIDs", row.names =1)
pam50 = read.csv("pam50classification.csv")
sym = as.list(hgu133plus2SYMBOL)
sym = sym[match(rownames(data), names(sym))]

ui <- fluidPage("Expression Variable of breast tumours",
                # *Input() functions,
                textInput(inputId = "GoI", label = "Select gene of interest", value ="FSIP1"),
                selectInput(inputId = "subOrgen", label = "Comparison", choices = c("BRCA1 vs BRCAx", "BRCA1/2 vs BRCAx",
                                                                                    "BRCA2 vs BRCAx")),
                sidebarPanel(sliderInput("n", "Number of plots", value=1, min=1, max=5)
                ),
                # *Output() functions,
                plotOutput("boxplot"),
                uiOutput("plots")
)

server <- function(input, output){
  g = ifelse(pam50$pam50.classification.subtype == "Basal", "Basal", "Non-basal")
  #output$boxplot = renderPlot({boxplot(as.numeric(data[sym == input$GoI,])~g)})
  GoI <- reactive({length(sym[sym == input$GoI])})

  output$plots <- renderUI({
    plot_output_list <- lapply(1:isolate(GoI()), function(i) {
      plotname <- paste("plot", i, sep="")
      plotOutput(plotname, height = 280, width = 250)
    })

    # Convert the list to a tagList - this is necessary for the list of items
    # to display properly.
    do.call(tagList, plot_output_list)
  })
  max_plots <- GoI()
  # Call renderPlot for each one. Plots are only actually generated when they
  # are visible on the web page.
  for (i in 1:max_plots) {
    # Need local so that each item gets its own number. Without it, the value
    # of i in the renderPlot() will be the same across all instances, because
    # of when the expression is evaluated.
    local({
      my_i <- i
      plotname <- paste("plot", my_i, sep="")
      dataGoI <- reactive({a=data[sym == input$GoI,]
        b = a[my_i,]
        return(b)})

      output[[plotname]] <- renderPlot({
        boxplot(as.numeric(dataGoI())~g,
             main = paste("1:", my_i, ".  n is ", input$n, sep = "")
        )
      })
    })
  }
}

shinyApp(ui = ui, server = server)
Hi, thanks for the codes! One problem I can't seem to figure out. I create a list of plots that needs to be dynamically displayed. They are colored by patient (each patient has a distinct color), and each plot (referred to as "plate") can have different number of patients.
I had to sort the plots by the number of patients (#) first, since if I get the one with the smallest # first, the code will break (i assume something to do with the colors). However, it still doesn't print all plots correctly, a lot of time colors are switched. Have you ever seen something like this?
Here are some parts of the code. Sorry I can't make it reproducible, since it's quite long.
Thank you!
# 7. Dynamic display of plots ------
# Insert the right number of plot output objects into the web page
output$plots <- renderUI({
  if (is.null(Y())) { return(NULL)
  } else {
    plot_output_list <- lapply(1:n.plates(), function(k) {
      plotname <- paste("plot", k, sep="")
      plotOutput(plotname, height = 600, width = 800)
    })
    # Convert the list to a tagList - this is necessary for the list of items
    # to display properly.
    do.call(tagList, plot_output_list)
  }
})

# can not print ggplots from a list if the plot with less colors is followed by more colors
# will sort plots by number of subjects
order.p <- reactive ({
  n.all <- c()
  for (i in 1:length(plates())) {
    z <- as.vector(plates()[[i]])
    z <- z[-grep("None|IPC|QC|SC|Buffer",z)]
    z.u <- length(unique(sapply(strsplit(as.character(z), ".", fixed=T), "[", 1)))
    n.all <- append(n.all,z.u)
  }
  order.p1 <- as.data.frame(n.all)
  order.p1 <- plyr::mutate(order.p1, plate=as.numeric(rownames(order.p1))) %>%
    plyr::arrange(n.all)
  order.p1
})

# 9. List of plots ------
plot.list <- reactive({
  plot.listR <- list()

  for (i in order.p()$plate) {

    image.db <- image.db.list()[[i]]
    extra.colorsA<-image.db$extra.colorsA
    names(extra.colorsA)<-as.character(image.db$Patient)

    p <- ggplot(image.db, aes(x = Number,y = LETTER)) +
      geom_tile(aes(fill = Patient),colour = "black") +
      scale_fill_manual(values = extra.colorsA, guide = guide_legend(nrow=5)) +
      labs(title = paste0("Plate # ",i,". N subjects = ", length(pat.ord)))

    plot.listR[[i]] <- p
  }
  plot.listR
})

# 6. Plot output ------
# Call renderPlot for each one. Plots are only actually generated when they
# are visible on the web page.
for (i in 1:max_plots) {
  local({
    my_i <- i
    plotname <- paste("plot", my_i, sep="")
    output[[plotname]] <- renderPlot({
      plot.list()[[my_i]]
    })
  })
}
I suspect the problem is with this part, since plots will have different attributes, and I get "Warning: attributes are not identical across measure variables; they will be dropped":
do.call(tagList, plot_output_list)
I wonder if there is a way for tagList() to handle that.
I was wondering if there is a way to add selectedInput for each plot dynamically added. I know the first code works for multiple plots. I found a code to add buttons dynamically but when I try to combine both these codes, i don't see the plot. I want inputs for each plot so that i can make changes to the plot.
I am hoping to find an approach that only computes the plots as needed, and does not recompute those already computed. Has anyone come across such? You can demonstrate that the displayed plots are recomputed on each change to n but adding the date() to the plot header.
Any updates on why this won't work with dygraphs. The space where the plots are supposed to be is blank.
Thanks so much for this, excellent. If you are still trying to get it to work with dygraphs, you need dygraphOutput() instead of PlotOutput() on line 9, line 27 renderDygraph() instead of renderPlot(), and the actual dygraph() plot from line 28.
Thank you so much!! I have been looking for efficient solution and this is it! 👍
@wch, Thank you for the code, it helped me a lot. I used this code for a dynamic number of images.
Does anyone know how can to add tooltip or popup for each image?
Thanks a lot! This is just amazing.
I notice many people seem to be executing code successfully within the chunk of the server function. Whenever I have any code here that isn't wrapped by reactive({}) or another type of reactive function I get the error saying "Operation not allowed without an active reactive context. (You tried to do something that can only be done from inside a reactive expression or observer.)".
In particular the for-loop used to call renderPlot({}) is apparently super useful, but how do you call the loop without wrapping it in a reactive function?
CAn output$plots <- renderUI({ part be inside observeEvent()?
@Georgewiggins here's a solution.
max_plot being a global variable is ok in the nice small proof-of-concept by master @wch, but would likely cause havoc in a bigger application. Simply referring to reactive variables in the for-local-loop is not allowed. However it seems the for-local-loop can be wrapped in an observe.
Example below has max_plot as a reactiveVal and an extra slider to set max_plot
library(shiny)

ui <- pageWithSidebar(

  headerPanel("Dynamic number of plots"),

  sidebarPanel(
    sliderInput("n", "Number of plots", value=1, min=1, max=5),
    sliderInput("max", "Max number of plots", value=5, min=1, max=25,step=1)
  ),

  mainPanel(
    # This is the dynamic UI for the plots
    uiOutput("plots")
  )
)


server = function(input, output,session) {


  # Insert the right number of plot output objects into the web page
  output$plots <- renderUI({
    plot_output_list <- lapply(1:input$n, function(i) {
      plotname <- paste("plot", i, sep="")
      plotOutput(plotname, height = 280, width = 250)
    })

    # Convert the list to a tagList - this is necessary for the list of items
    # to display properly.
    do.call(tagList, plot_output_list)
  })

  # Call renderPlot for each one. Plots are only actually generated when they
  # are visible on the web page.

  #making max_plot variable reactiveVal instead of global, input$max would also do, but that would be too easy...
  max_plots = reactiveVal(5)
  observe({
    max_plots(input$max)
    updateSliderInput(session,"n",min=1, max=input$max)
  })

  ##wrapping the, for me strange(but nice) for-local-loop, seems to restore normal shiny reactive behavior
  observeEvent({c(input$max,input$n)},{
    mp= max_plots()

    for (i in 1:mp) {
      # Need local so that each item gets its own number. Without it, the value
      # of i in the renderPlot() will be the same across all instances, because
      # of when the expression is evaluated.
      local({
        my_i <- i
        plotname <- paste("plot", my_i, sep="")

        output[[plotname]] <- renderPlot({
          plot(1:my_i, 1:my_i,
               xlim = c(1, mp),
               ylim = c(1, mp),
               main = paste("1:", my_i, ".  n is ", input$n, sep = "")
          )
        })
      })
    }

  })

}

shinyApp(ui, server)
Need local so that each item gets its own number. Without it, the value
# of i in the renderPlot() will be the same across all instances, because
# of when the expression is evaluated.
Is there a way to force immediate evaluation? Or at least a way to track the order?
hi, this is really helpful forum. been looking for this particular solution.
i applied the same function within the observeEvent to renderUI with textInput.
Trying to figure out now how I can monitor the user input from those dynamic textInput rendered.
Need also to use the inputs to update the plots rendered also from the same for loop within the observeEvent.
Appreciate your further help...
@wch Thank you for this code - it has been a lifesaver!
@ajnewcomb - Any data that depends on user input will need to be wrapped in a reactive() function, but your renderPlot() itself should not need to be.
Here is my code as an example:
for (num in 1:9)
{
  #without local, the filter and call to renderPlot will all get number 1
  local({
    local_num <- num

    #filter the data just to one week - needs to be reactive
    this_week <- reactive({
      filter(country_counts(), start_date == (unique(country_counts()$start_date)[local_num]))

    })

    this_plot <- paste("country_plot", local_num, sep = "")

    #plot each pie chart - NOT reactive
    output[[this_plot]] <- renderPlot({
      ggplot(this_week(), aes(x = "", y = unique_count, fill = aer_country)) +
      geom_bar(width = 0.5, stat= "identity" ) + coord_polar("y", start = 0)
    })
  })

}
In this case, my dataset 'this_week' is in a reactive function because it depends indirectly on the user's input in the dashboard. However, renderPlot is NOT in a reactive function because the call to it does not vary.
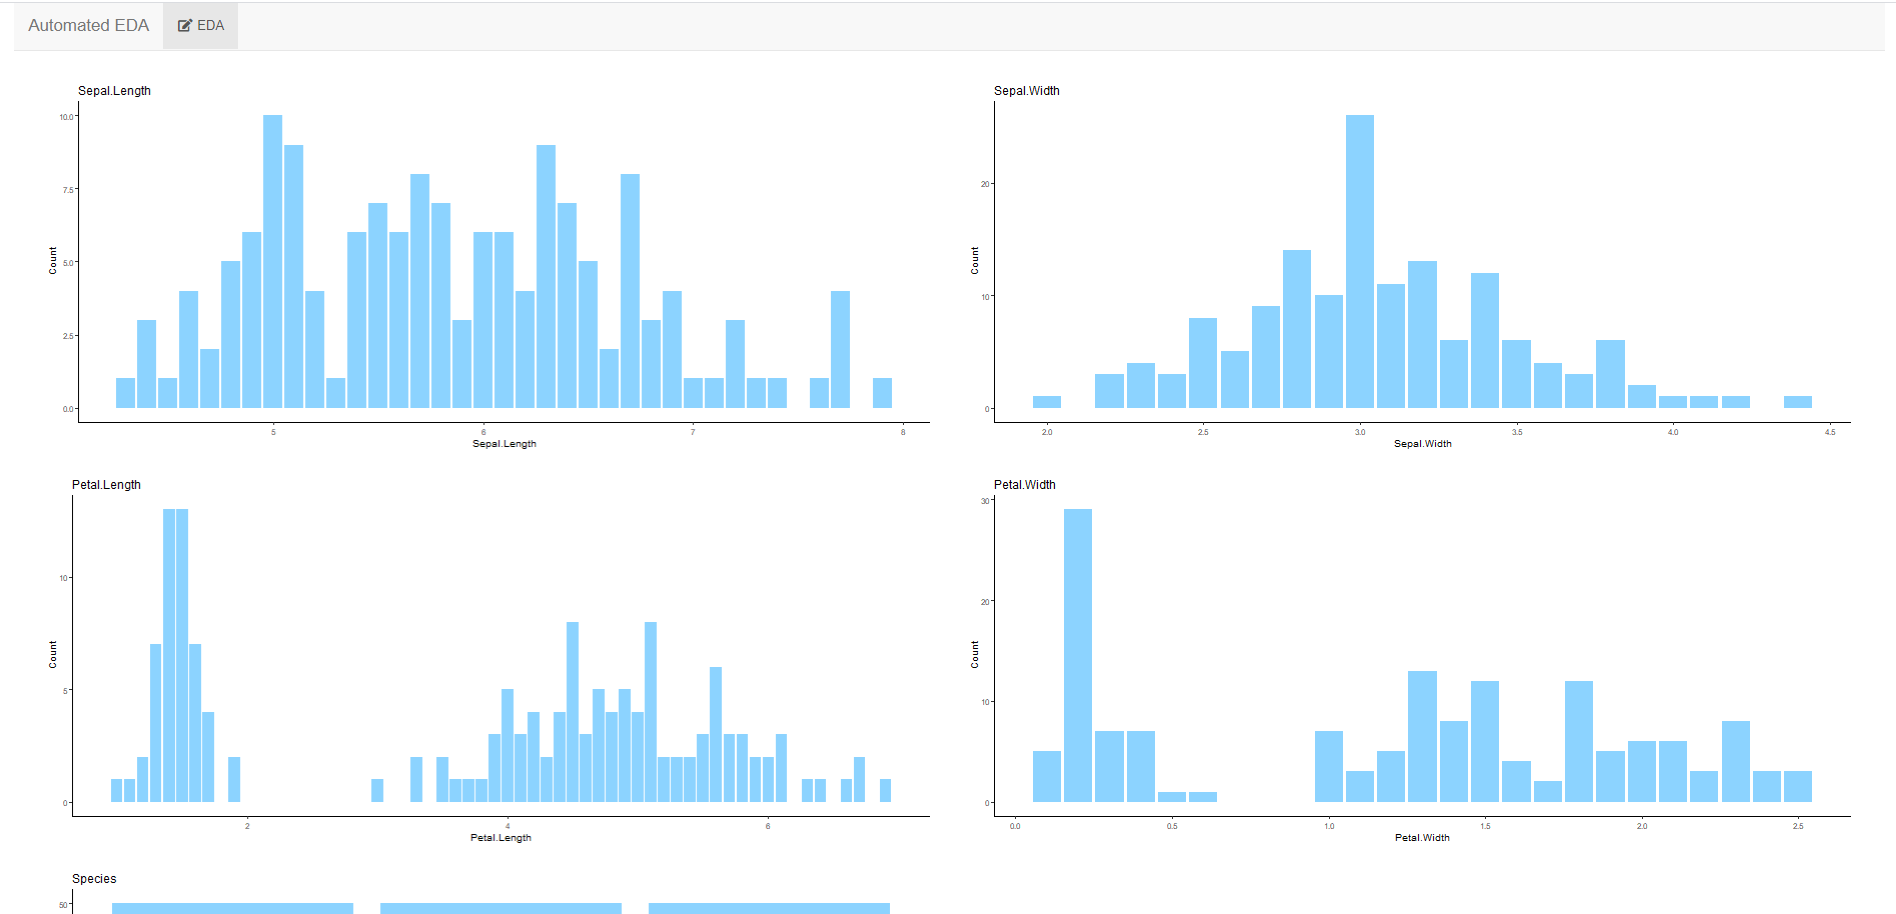
Not sure, who is still looking for a solution, but here is a snippet that I use.
Refer full code snippet at -
https://gist.github.com/mayank7jan/0e89c1d6f48379881da607140f45b2ac
  observeEvent(rv$data_filtered, {

    uniPlot <- lapply(names(rv$data_filtered), function(col_i){
      ggplot(rv$data_filtered, aes_string(x=col_i)) + geom_bar(fill = "#8cd3ff") + theme_classic() + labs(title = col_i) + xlab(col_i) + ylab("Count")
    })

    output$univariate_plots <- renderUI({

      plot_output_list <- lapply(seq_along(1:length(uniPlot)),function(plot_i){
        column(width = 6,
               tags$div(style = "margin-top: 10px; margin-bottom: 10px;",
                        plotOutput(outputId = paste0("uni_", plot_i))
               ))
      })

      # Convert the list to a tagList - this is necessary for the list of items to display properly.
      do.call(tagList, plot_output_list)

      ## either works
      # plot_output_list

    })

    rv$uniPlot <- uniPlot
  })

  observeEvent(rv$uniPlot,{

    lapply(seq_along(1:length(rv$uniPlot)), function(plot_i) {
      output[[paste0("uni_", plot_i)]] <- renderPlot({
        rv$uniPlot[[plot_i]]
      })
    })

  }, ignoreInit = FALSE)
Output Preview :
Thanks for these great solutions. I have two questions please: How to ensure that the plots have the same legend to compare for example. The second thing is how to save all generated plots with one button click. Thanks
Hi @INTELLIGENTICA ,
-
The app then needs to then set to behave in a specific way only and lose some of its dynamicity. Or, Have tabs/select drop down for each of the columns in the uploaded data.frame to group/color by and thereby show the legend for.
-
To download all the generated plots with one click, there are multiple ways to do it -
- Knit all plots in a report with either or all formats - HTML, pdf or excel
- Have a download button for each plot
- Save all the dynamically generated plots to local memory and then zip the whole directory for download.
Each of these is doable since the dynamic plots produced are available as individual list items in plot_output_list
I wanted to add another use case to this excellent gist. In my case I wanted to generate a dynamic number of graphs based on the factor levels of a column from a user input file. See also https://stackoverflow.com/questions/75250661/generate-dynamic-number-of-plots-based-on-factor-levels-of-user-input-file/75251212#75251212
library(shiny)
library(data.table)
library(ggplot2)
library(dplyr)

ui <- fluidPage(

  headerPanel("Dynamic number of plots"),

  sidebarPanel(
    fileInput("fileIn",
              "Load input file",
              multiple = F)
  ),

  mainPanel(
    uiOutput("plot1")
  )
)

server <- function(input, output) {

  getData <- reactive({
    req(input$fileIn)
    dataIn <- as.data.frame(fread(input$fileIn$datapath))
    dataIn$plotGroup <- make.names(dataIn$plotGroup)
    return(dataIn)
  })

  output$plot1 <- renderUI({
    plotOutputList <- lapply(unique(getData()$plotGroup),
                             function(i){
                               plotname <- paste("plot", i, sep = "_")
                               plotOutput(plotname)
                             })
    do.call(tagList, plotOutputList)
  })

  observe({
  for(i in unique(getData()$plotGroup)){
    local({
      iCurrent <- i
      plotname <- paste("plot", iCurrent, sep = "_")

      output[[plotname]] <- renderPlot({
        getData() %>%
          filter(plotGroup == iCurrent) %>%
        ggplot(aes(x = xGroup, y = yVar)) +
          geom_point()
      })
    })
  }})
}

shinyApp(ui, server)
Thanks a lot for this code. It helped me a lot.
I'm trying to do the same with interactive plots (with dygraph), and it doesn't work :(
The graphs doesn't show, do you happen to know how to do it with interactive plots?
Many Thanks,
Michal