-
-
Save wdecoster/bbd446ff59991e34684226d757f847f8 to your computer and use it in GitHub Desktop.
| from nanomath import aveQual | |
| from nanoplotter import scatter | |
| from Bio import SeqIO | |
| import numpy as np | |
| import pandas as pd | |
| import sys | |
| import gzip | |
| from scipy import stats | |
| import csv | |
| def main(): | |
| datadict = getFQInput(gzip.open(sys.argv[1], 'rt')) | |
| with open(sys.argv[2], 'r') as summaryf: | |
| summary = csv.reader(summaryf, delimiter='\t') | |
| next(summary, None) | |
| for row in summary: | |
| if not row[11] == '0': | |
| datadict[row[1]].append(float(row[13])) | |
| scatter( | |
| x=pd.Series([entry[0] for entry in datadict.values()]), | |
| y=pd.Series([entry[1] for entry in datadict.values()]), | |
| names=["Calculated average read quality score", "Albacore summary derived quality score"], | |
| path="AveQualvsSummary", | |
| color="#4CB391", | |
| figformat="png", | |
| plots={"hex": 0, "kde": 1, "dot": 0, "pauvre": 0}, | |
| stat=stats.pearsonr, | |
| plot_settings={}) | |
| def getFQInput(fq): | |
| ''' | |
| Get all quality scores in the dataset returned as a list of lists | |
| ''' | |
| return {rec.id : [aveQual(rec.letter_annotations["phred_quality"])] for rec in SeqIO.parse(fq, "fastq")} | |
| if __name__ == '__main__': | |
| main() |
Is your summary file gzip compressed?
yes it is!
That explains the error I believe. The easiest is to decompress it, but I think you can also change the code to use gzip.open (line 13).
This gist is 2 years old, so I'm not 100% sure the scatter() function will still work. But let me know if you encounter an issue and I'll help you fix it.
File "average-fq-qual-vs-albacore-summary.py3", line 39, in
main()
File "average-fq-qual-vs-albacore-summary.py3", line 28, in main
stat=stats.pearsonr)
File "/home/user/py3-venv/lib/python3.7/site-packages/nanoplotter/nanoplotter_main.py", line 90, in scatter
sns.set(style="ticks", **plot_settings)
TypeError: set() argument after ** must be a mapping, not NoneType
There we have it :) as expected.
Could you try adding plot_settings={} in the scatter() function as below:
    scatter(
        x=np.array([entry[0] for entry in datadict.values()]),
        y=np.array([entry[1] for entry in datadict.values()]),
        names=["Calculated average read quality score", "Albacore summary derived quality score"],
        path="AveQualvsSummary",
        color="#4CB391",
        format="png",
        plots={"hex": 0, "kde": 1, "dot": 0},
        stat=stats.pearsonr,
        plot_settings={})
Getting the following error now:
File "average-fq-qual-vs-albacore-summary.py3", line 49, in <module>
   main()
 File "average-fq-qual-vs-albacore-summary.py3", line 39, in main
   plot_settings={})
TypeError: scatter() got an unexpected keyword argument 'format'
Thanks for sticking around - the function has changed a bit the past two years. NanoPlot itself stays compatible of course, but this snippet is outdated.
You can change the 'format' to 'figformat' and then this error should be solved. As soon as we get this working I'll update the gist...
Well, thank YOU for the help!
New error:
  File "average-fq-qual-vs-albacore-summary.py3", line 49, in <module>
    main()
  File "average-fq-qual-vs-albacore-summary.py3", line 39, in main
    plot_settings={})
  File "/home/user/py3-venv/lib/python3.7/site-packages/nanoplotter/nanoplotter_main.py", line 153, in scatter
    idx = np.random.choice(x.index, min(2000, len(x)), replace=False)
AttributeError: 'numpy.ndarray' object has no attribute 'index'
Hmmm I changed more in two years than I thought :-)
Try this:
import pandas as pd

scatter(
        x=pd.Series([entry[0] for entry in datadict.values()]),
        y=pd.Series([entry[1] for entry in datadict.values()]),
        names=["Calculated average read quality score", "Albacore summary derived quality score"],
        path="AveQualvsSummary",
        color="#4CB391",
        format="png",
        plots={"hex": 0, "kde": 1, "dot": 0},
        stat=stats.pearsonr,
        plot_settings={})
You probably meant ‘figformat’ ;)
It is working now, however, the pearsonr is very low (0.26). Any idea why?
Oh yeah, heh, definitely figformat :-p
Could you show me the plot? Where is the data from?
The data was obtained by sequencing (as a beginner) a bacterial isolate.
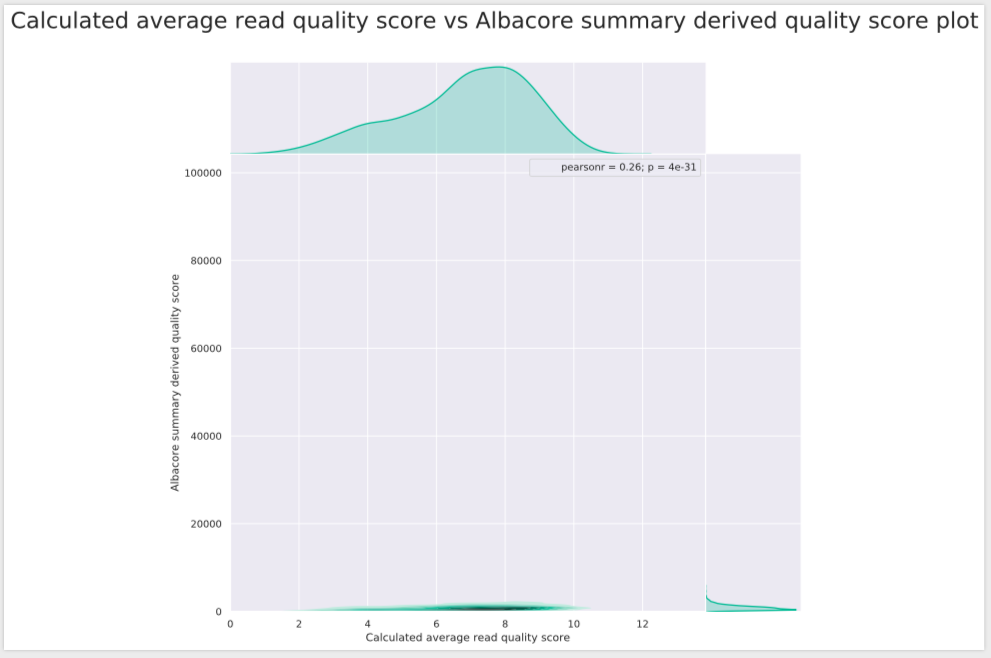
Uh ow, I think I know what went wrong here. The ONT sequencing_summary.txt file format changed between my code and your file, and you are not plotting the right column here. The quality scores from the summary (y-axis) go to unrealistic numbers.
All of these changes are taken into account for NanoPlot (which might give you more relevant plots, too), but not for an old snippet like this.
In line 18 I take the thirteenth value of the summary file (index 12 in Python):
datadict[row[1]].append(float(row[12]))
You'll have to correct that number.
This is my summary file:
filename	read_id	run_id	channel	start_time	duration	num_events	passes_filtering	template_start	num_events_template	template_duration	num_called_template	sequence_length_template	mean_qscore_template	strand_score_template	calibration_strand_genome_template	calibration_strand_identity_template	calibration_strand_accuracy_template	calibration_strand_speed_bps_template
PCW_VVVV_9_20180831_FAH89570_MN17058_sequencing_run_string.fast5	1b261311-a333-4af9-8f03-fefee722938b	1d2f069b4156b0bfdc46e8cd5825a3419de1a39d	248	112.06525	1.37275	957	False	0.17625	957	1.1965	957	229	5.177	-0.0008	filtered_out	-1.0	-1.0	0.0
So it should be index 13 in python.
However, that gives me the following error:
ng is deprecated; use `arr[tuple(seq)]` instead of `arr[seq]`. In the future this will be interpreted as an array index, `arr[np.array(seq)]`, which will result either in an error or a different result.
  return np.add.reduce(sorted[indexer] * weights, axis=axis) / sumval
/home/user/py3-venv/lib/python3.7/site-packages/seaborn/axisgrid.py:1847: UserWarning: JointGrid annotation is deprecated and will be removed in a future release.
  warnings.warn(UserWarning(msg))
Traceback (most recent call last):
  File "average-fq-qual-vs-albacore-summary.py3", line 40, in <module>
    main()
  File "average-fq-qual-vs-albacore-summary.py3", line 30, in main
    plot_settings={})
  File "/home/user/py3-venv/lib/python3.7/site-packages/nanoplotter/nanoplotter_main.py", line 182, in scatter
    if plots["pauvre"] and names == ['Read lengths', 'Average read quality'] and log is False:
KeyError: 'pauvre'
That's progress!
Change plots={"hex": 0, "kde": 1, "dot": 0} to plots={"hex": 0, "kde": 1, "dot": 0, "pauvre": 0}.
I hope, after all these changes, you'll be happy with the results, but I expect you'll just get a boring pretty good correlation.
That's it! Thanks a lot for your time!
Good to hear! Based on your findings I have updated the gist. Thanks!
I there,
I'd like to reproduce the figure you produced, but I am getting the following error: