
Created
June 24, 2018 23:37
-
-
Save JackHowa/57ccead2fd6f7d2f40a49cf1990c4b2b to your computer and use it in GitHub Desktop.
this is notes about the d3 portion of the fcc code camp
This file contains hidden or bidirectional Unicode text that may be interpreted or compiled differently than what appears below. To review, open the file in an editor that reveals hidden Unicode characters.
Learn more about bidirectional Unicode characters
| d3 on fcc won't let be me |

Author
Author
- can get in-line styles via method
.style('color', 'red) - sets style for all elements in the selection

<body>
  <script>
    const dataset = [12, 31, 22, 17, 25, 18, 29, 14, 9];

    d3.select("body").selectAll("h2")
      .data(dataset)
      .enter()
      .append("h2")
      .text(d => d + " USD")
      .style('font-family', 'verdana');
  </script>
</body>
Author
- woah this is cool
selection.style("color", (d) => {
  /* Logic that returns the color based on a condition */
});
- used ternary here for readability with in-line
<body>
  <script>
    const dataset = [12, 31, 22, 17, 25, 18, 29, 14, 9];

    d3.select("body").selectAll("h2")
      .data(dataset)
      .enter()
      .append("h2")
      .text((d) => (d + " USD"))
      .style('color', d => d < 20 ? 'red' : 'green' );
    </script>
</body>
Author
https://learn.freecodecamp.org/data-visualization/data-visualization-with-d3/add-classes-with-d3
.attr()is similar to.style()because it can take in a callback function as an arg and it uses key-value pairs- d3 has
.attr()to add any attribute to an element - adds class of 'container' :
selection.attr("class", "container"); - can assign multiple classnames to that target selection via space separated (stack)
<style>
  .bar {
    width: 25px;
    height: 100px;
    display: inline-block;
    background-color: blue;
  }
</style>
<body>
  <script>
    const dataset = [12, 31, 22, 17, 25, 18, 29, 14, 9];

    d3.select("body").selectAll("div")
      .data(dataset)
      .enter()
      .append("div")
      .attr('class', 'bar');
  </script>
</body>
Author
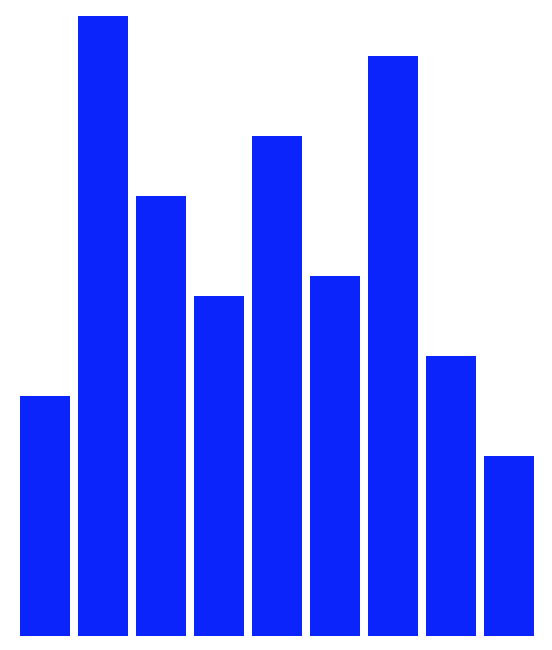
- can create pretty slick graph fairily easily ...
- dynamic height use

Author
- alright add margin between the elements
- can multiple the height in-line, which is nice
after:
Author
https://learn.freecodecamp.org/data-visualization/data-visualization-with-d3/learn-about-svg-in-d3
- scalable in scalable vector graphic means that it won't be pixelated on any screen
added svg, still need to style ->-> not sure
<style>
  svg {
    background-color: pink;
  }
</style>
<body>
  <script>
    const dataset = [12, 31, 22, 17, 25, 18, 29, 14, 9];

    const w = 500;
    const h = 100;

    const svg = d3.select("body")
                  // Add your code below this line
                  .append('svg')
                  .style('height', h)
                  .style('width', (d) => w + 'px')

                  // Add your code above this line
  </script>
</body>
Author
- interestingly, width and height attributes don't have any units
-> it'll be 5:1 anywhere, cool - before was making the istake of adding a px at the end

<style>
  svg {
    background-color: pink;
  }
</style>
<body>
  <script>
    const dataset = [12, 31, 22, 17, 25, 18, 29, 14, 9];

    const w = 500;
    const h = 100;

    // attr feels a lot like jquery here
    const svg = d3.select("body")
                  .append('svg')
                  .attr('height', h)
                  .attr('width', w);
  </script>
</body>
Author
https://learn.freecodecamp.org/data-visualization/data-visualization-with-d3/display-shapes-with-svg
- coordinates are done just via attributes as well
<body>
  <script>
    const dataset = [12, 31, 22, 17, 25, 18, 29, 14, 9];

    const w = 500;
    const h = 100;

    const svg = d3.select("body")
                  .append("svg")
                  .attr("width", w)
                  .attr("height", h)
                  .append("rect")
                  .attr("width", 25)
                  .attr("height", 100)
                  .attr("x", 0)
                  .attr("y", 0)
  </script>
</body>
Author
rectsmust be appended to an svg element before appended to the body
<body>
  <script>
    const dataset = [12, 31, 22, 17, 25, 18, 29, 14, 9];

    const w = 500;
    const h = 100;

    const svg = d3.select("body")
                  .append("svg")
                  .attr("width", w)
                  .attr("height", h);

    svg.selectAll("rect")
       .data(dataset)
       .enter()
       .append('svg') /* need to first append svg before rect */
       .append('rect')
       .attr("x", 0)
       .attr("y", 0)
       .attr("width", 25)
       .attr("height", 100);
  </script>
</body>
Author
- loop through using a callback
- don't need to write a for-loop because enter() already go through the data
<body>
  <script>
    const dataset = [12, 31, 22, 17, 25, 18, 29, 14, 9];

    const w = 500;
    const h = 100;

    const svg = d3.select("body")
                  .append("svg")
                  .attr("width", w)
                  .attr("height", h);

    svg.selectAll("rect")
       .data(dataset)
       .enter()
       .append("rect")
       .attr("x", (d, i) => i * 30) /* es6 implicit return */
       .attr("y", 0)
       .attr("width", 25)
       .attr("height", 100);
  </script>
</body>
Author
- can also return data value in the callback

<body>
  <script>
    const dataset = [12, 31, 22, 17, 25, 18, 29, 14, 9];

    const w = 500;
    const h = 100;

    const svg = d3.select("body")
                  .append("svg")
                  .attr("width", w)
                  .attr("height", h);

    svg.selectAll("rect")
       .data(dataset)
       .enter()
       .append("rect")
       .attr("x", (d, i) => i * 30)
       .attr("y", 0)
       .attr("width", 25)
       .attr("height", (d, i) => d * 3);
  </script>
</body>
Author
https://learn.freecodecamp.org/data-visualization/data-visualization-with-d3/invert-svg-elements
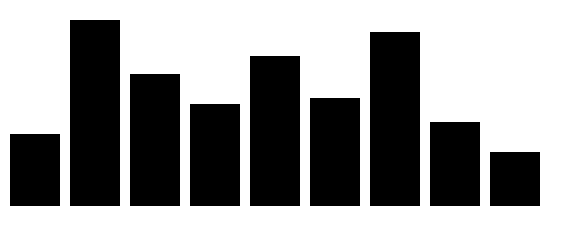
mis typically the multiplier for the data relationship to the actual ratio-
In general, the relationship is y = h - m * d, where m is the constant that scales the data points.
- wanted to make the multiplication more explicit with parens
- have to accomodate how d3 scales things with the top upper being 0,0 by subtracting from height
<body>
  <script>
    const dataset = [12, 31, 22, 17, 25, 18, 29, 14, 9];

    const w = 500;
    const h = 100;

    const svg = d3.select("body")
                  .append("svg")
                  .attr("width", w)
                  .attr("height", h);

    svg.selectAll("rect")
       .data(dataset)
       .enter()
       .append("rect")
       .attr("x", (d, i) => i * 30)
       .attr("y", (d, i) => h - (3 * d))
       .attr("width", 25)
       .attr("height", (d, i) => 3 * d);
  </script>
</body>
Author
fillattribute is what makes up the elements
<body>
  <script>
    const dataset = [12, 31, 22, 17, 25, 18, 29, 14, 9];

    const w = 500;
    const h = 100;

    const svg = d3.select("body")
                  .append("svg")
                  .attr("width", w)
                  .attr("height", h);

    svg.selectAll("rect")
       .data(dataset)
       .enter()
       .append("rect")
       .attr("x", (d, i) => i * 30)
       .attr("y", (d, i) => h - 3 * d)
       .attr("width", 25)
       .attr("height", (d, i) => 3 * d)
       .attr('fill', 'navy')
  </script>
</body>
Author
- Not sure why
dreturns itself but ok, guess it could be anything - Weird have to subtract to go HIGHER

<body>
  <script>
    const dataset = [12, 31, 22, 17, 25, 18, 29, 14, 9];

    const w = 500;
    const h = 100;

    const svg = d3.select("body")
                  .append("svg")
                  .attr("width", w)
                  .attr("height", h);

    svg.selectAll("rect")
       .data(dataset)
       .enter()
       .append("rect")
       .attr("x", (d, i) => i * 30)
       .attr("y", (d, i) => h - 3 * d)
       .attr("width", 25)
       .attr("height", (d, i) => 3 * d)
       .attr("fill", "navy");

    svg.selectAll("text")
       .data(dataset)
       .enter()
       .append('text')
       .attr('x', (d, i) => i * 30)
       /* three units higher is subtraction */
       .attr('y', (d, i) => h - (3 * d) - 3)
       .text(d => d) /* returns d data value */
  </script>
<body>
Author
https://learn.freecodecamp.org/data-visualization/data-visualization-with-d3/style-d3-labels
- even text has a
fillcolor property

<body>
  <script>
    const dataset = [12, 31, 22, 17, 25, 18, 29, 14, 9];

    const w = 500;
    const h = 100;

    const svg = d3.select("body")
                  .append("svg")
                  .attr("width", w)
                  .attr("height", h);

    svg.selectAll("rect")
       .data(dataset)
       .enter()
       .append("rect")
       .attr("x", (d, i) => i * 30)
       .attr("y", (d, i) => h - 3 * d)
       .attr("width", 25)
       .attr("height", (d, i) => d * 3)
       .attr("fill", "navy");

    svg.selectAll("text")
       .data(dataset)
       .enter()
       .append("text")
       .text((d) => d)
       .attr("x", (d, i) => i * 30)
       .attr("y", (d, i) => h - (3 * d) - 3)
       .style('font-size', '25px')
       .style('fill', 'red')
  </script>
</body>
Author
- add a class via attr

<style>
  .bar:hover {
    fill: brown;
  }
</style>
<body>
  <script>
    const dataset = [12, 31, 22, 17, 25, 18, 29, 14, 9];

    const w = 500;
    const h = 100;

    const svg = d3.select("body")
                  .append("svg")
                  .attr("width", w)
                  .attr("height", h);

    svg.selectAll("rect")
       .data(dataset)
       .enter()
       .append("rect")
       .attr("x", (d, i) => i * 30)
       .attr("y", (d, i) => h - 3 * d)
       .attr("width", 25)
       .attr("height", (d, i) => 3 * d)
       .attr("fill", "navy")
       .attr('class', 'bar')

    svg.selectAll("text")
       .data(dataset)
       .enter()
       .append("text")
       .text((d) => d)
       .attr("x", (d, i) => i * 30)
       .attr("y", (d, i) => h - (3 * d) - 3);

  </script>
</body>
Sign up for free
to join this conversation on GitHub.
Already have an account?
Sign in to comment
https://learn.freecodecamp.org/data-visualization/data-visualization-with-d3/work-with-dynamic-data-in-d3
din callback function as argument refers to the data pointselection.text((d) => d)