Many folks are familiar with the Fed Balance Sheet 'Total Assets' chart:
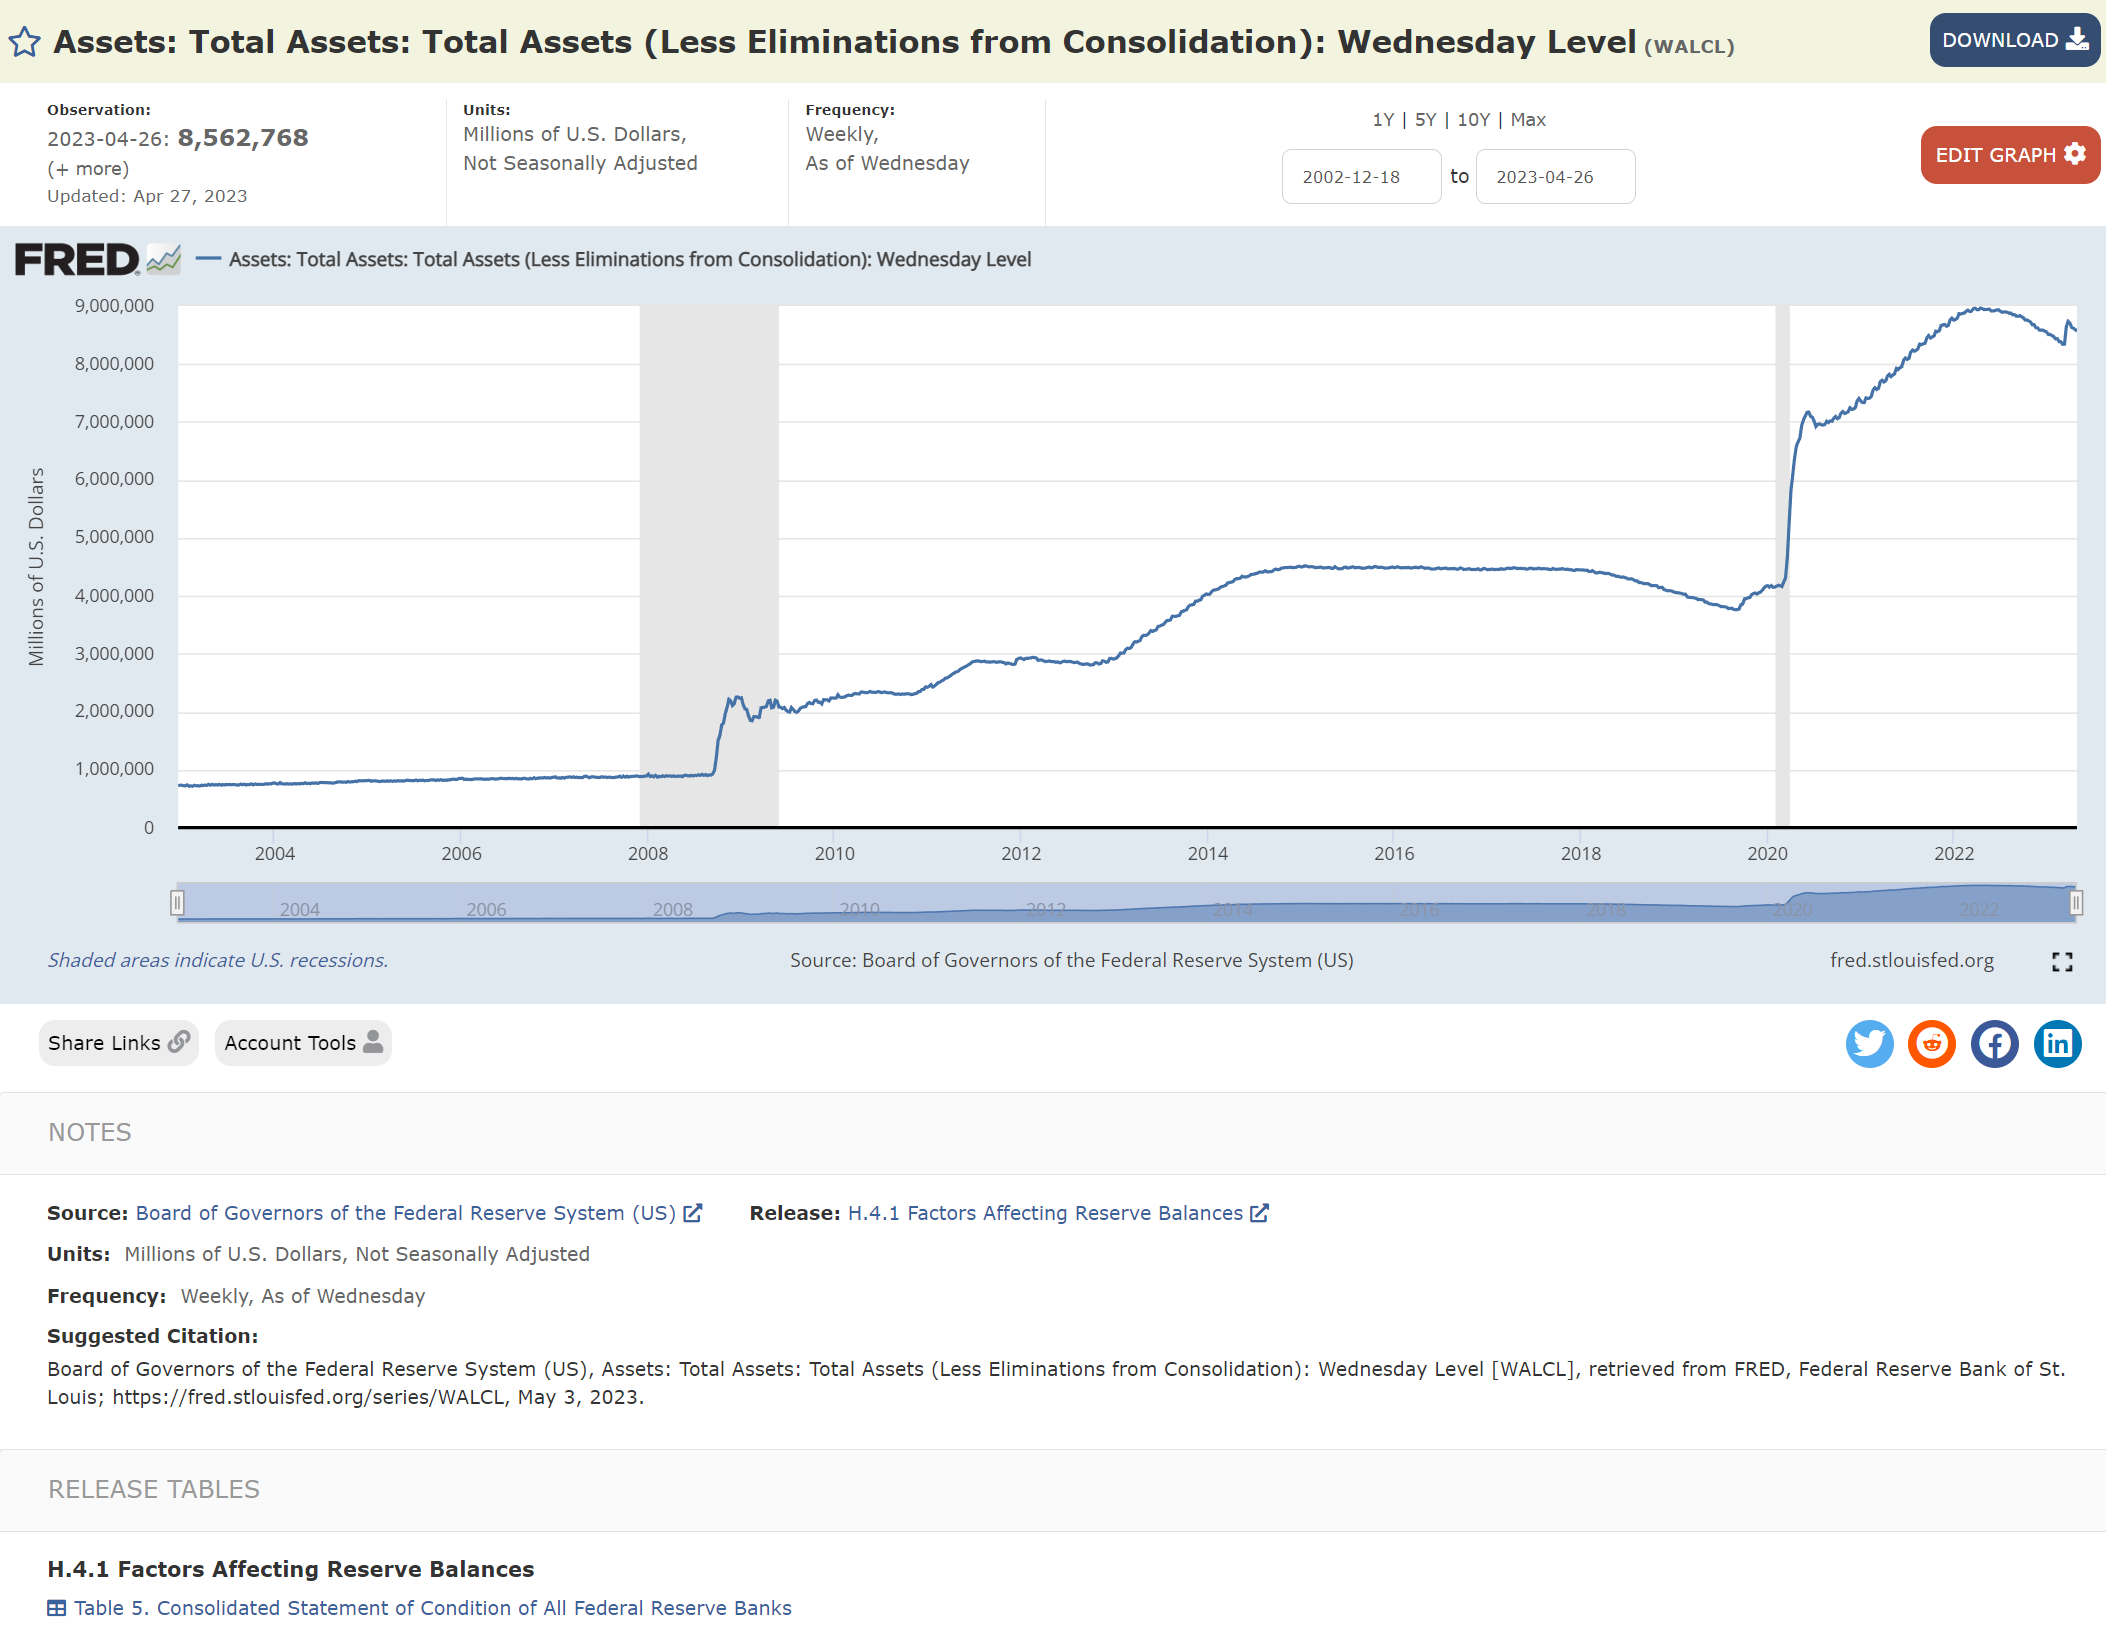
https://fred.stlouisfed.org/series/WALCL
Towards the bottom of that page is a link to the following 'release table':
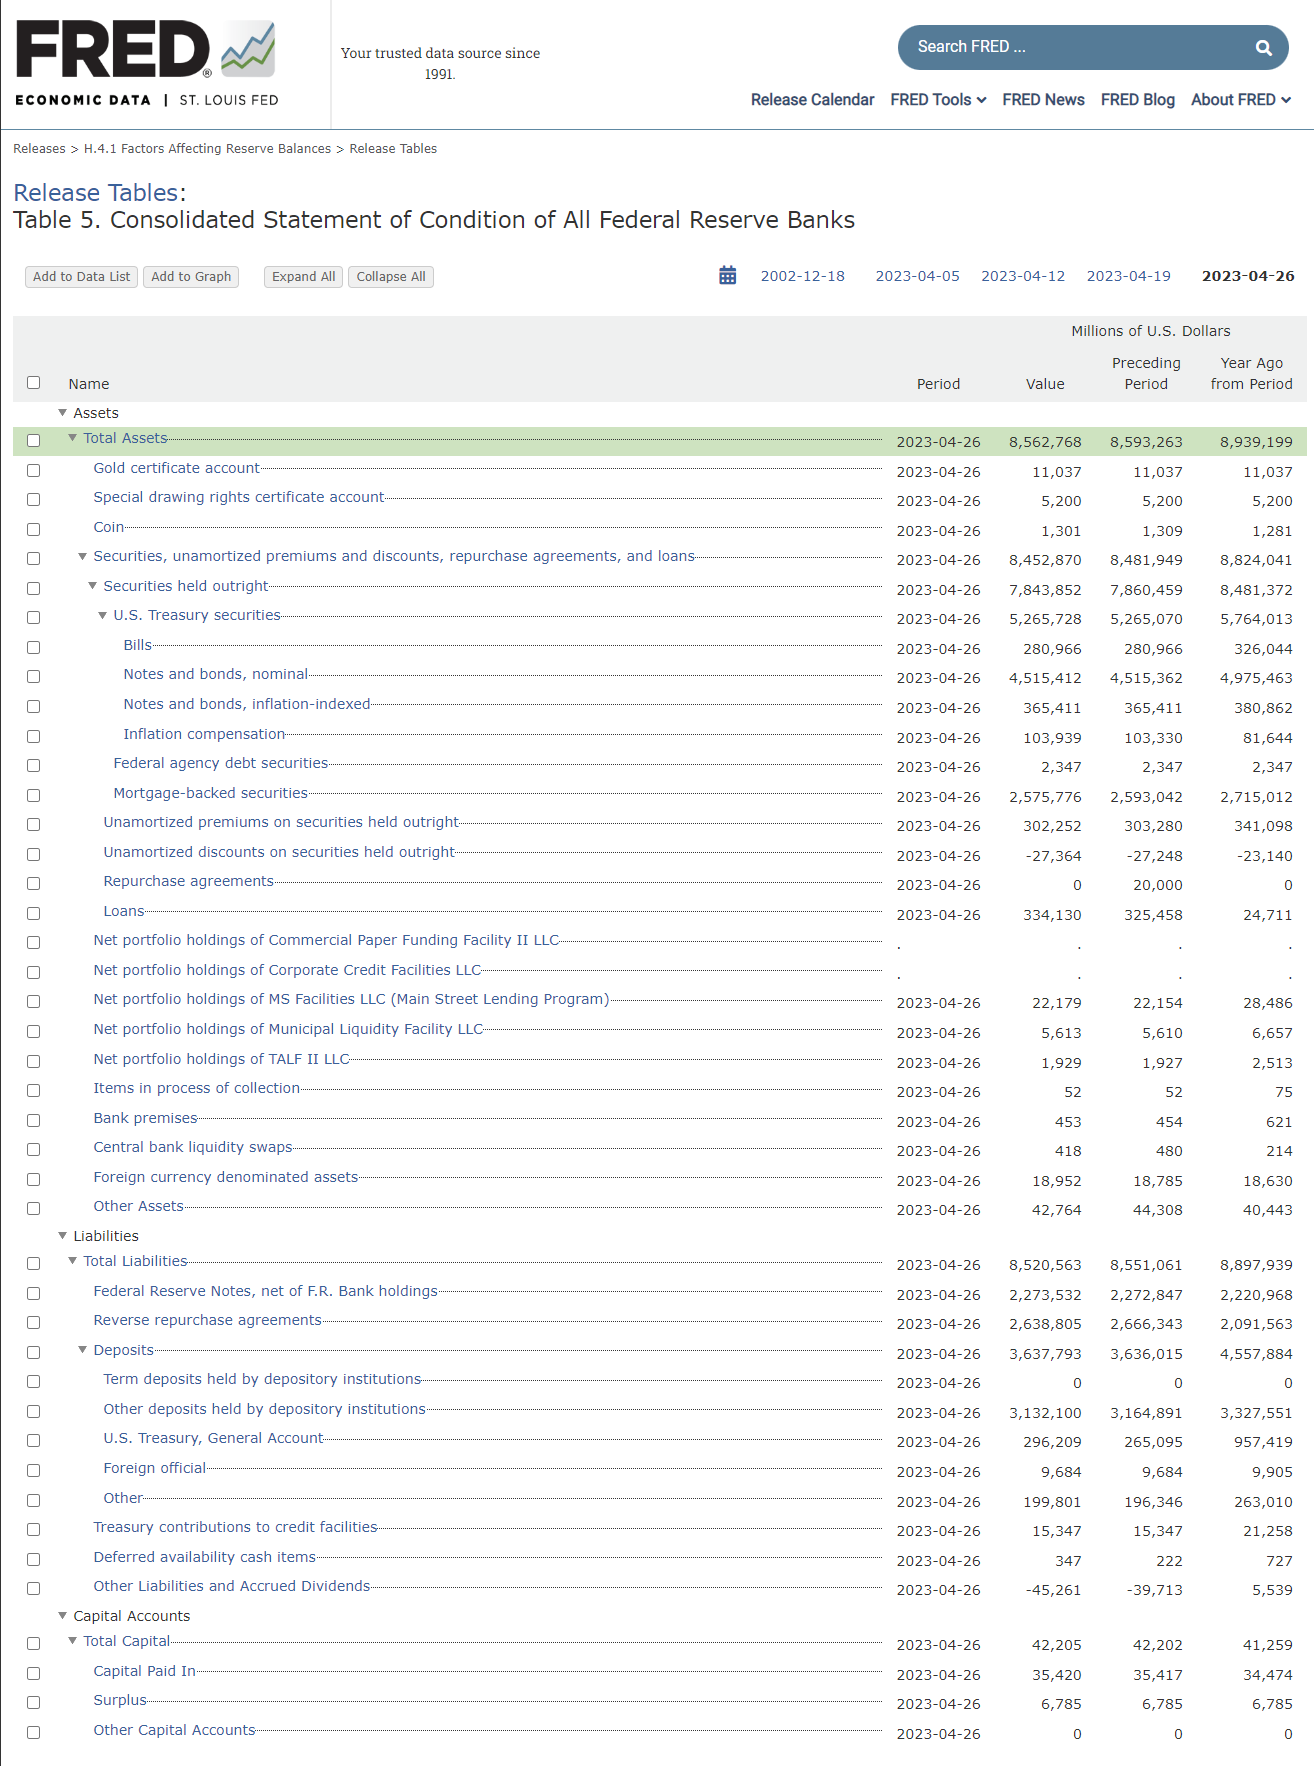
https://fred.stlouisfed.org/release/tables?rid=20&eid=1194154#snid=1194156
This is a great page. It shows each component of the balance sheet, the current value, and a link to the chart.
The basic equation of balance sheets which you'll find in economics and finance textbooks is:
assets = liabilities + capital (1)
So for the Fed balance sheet we have:
WALCL = WLTLECL + WCTCL (2)
The popular Net Liquidity formula is:
NL = WALCL - RRP - TGA (3)
This is saying:
NL = assets - RRP - TGA
So, if we substitute (2) into (3) we get:
NL = WLTLECL + WCTCL - RRP - TGA
In other words:
NL = liabilities + capital - RRP - TGA
Let's visualize this.
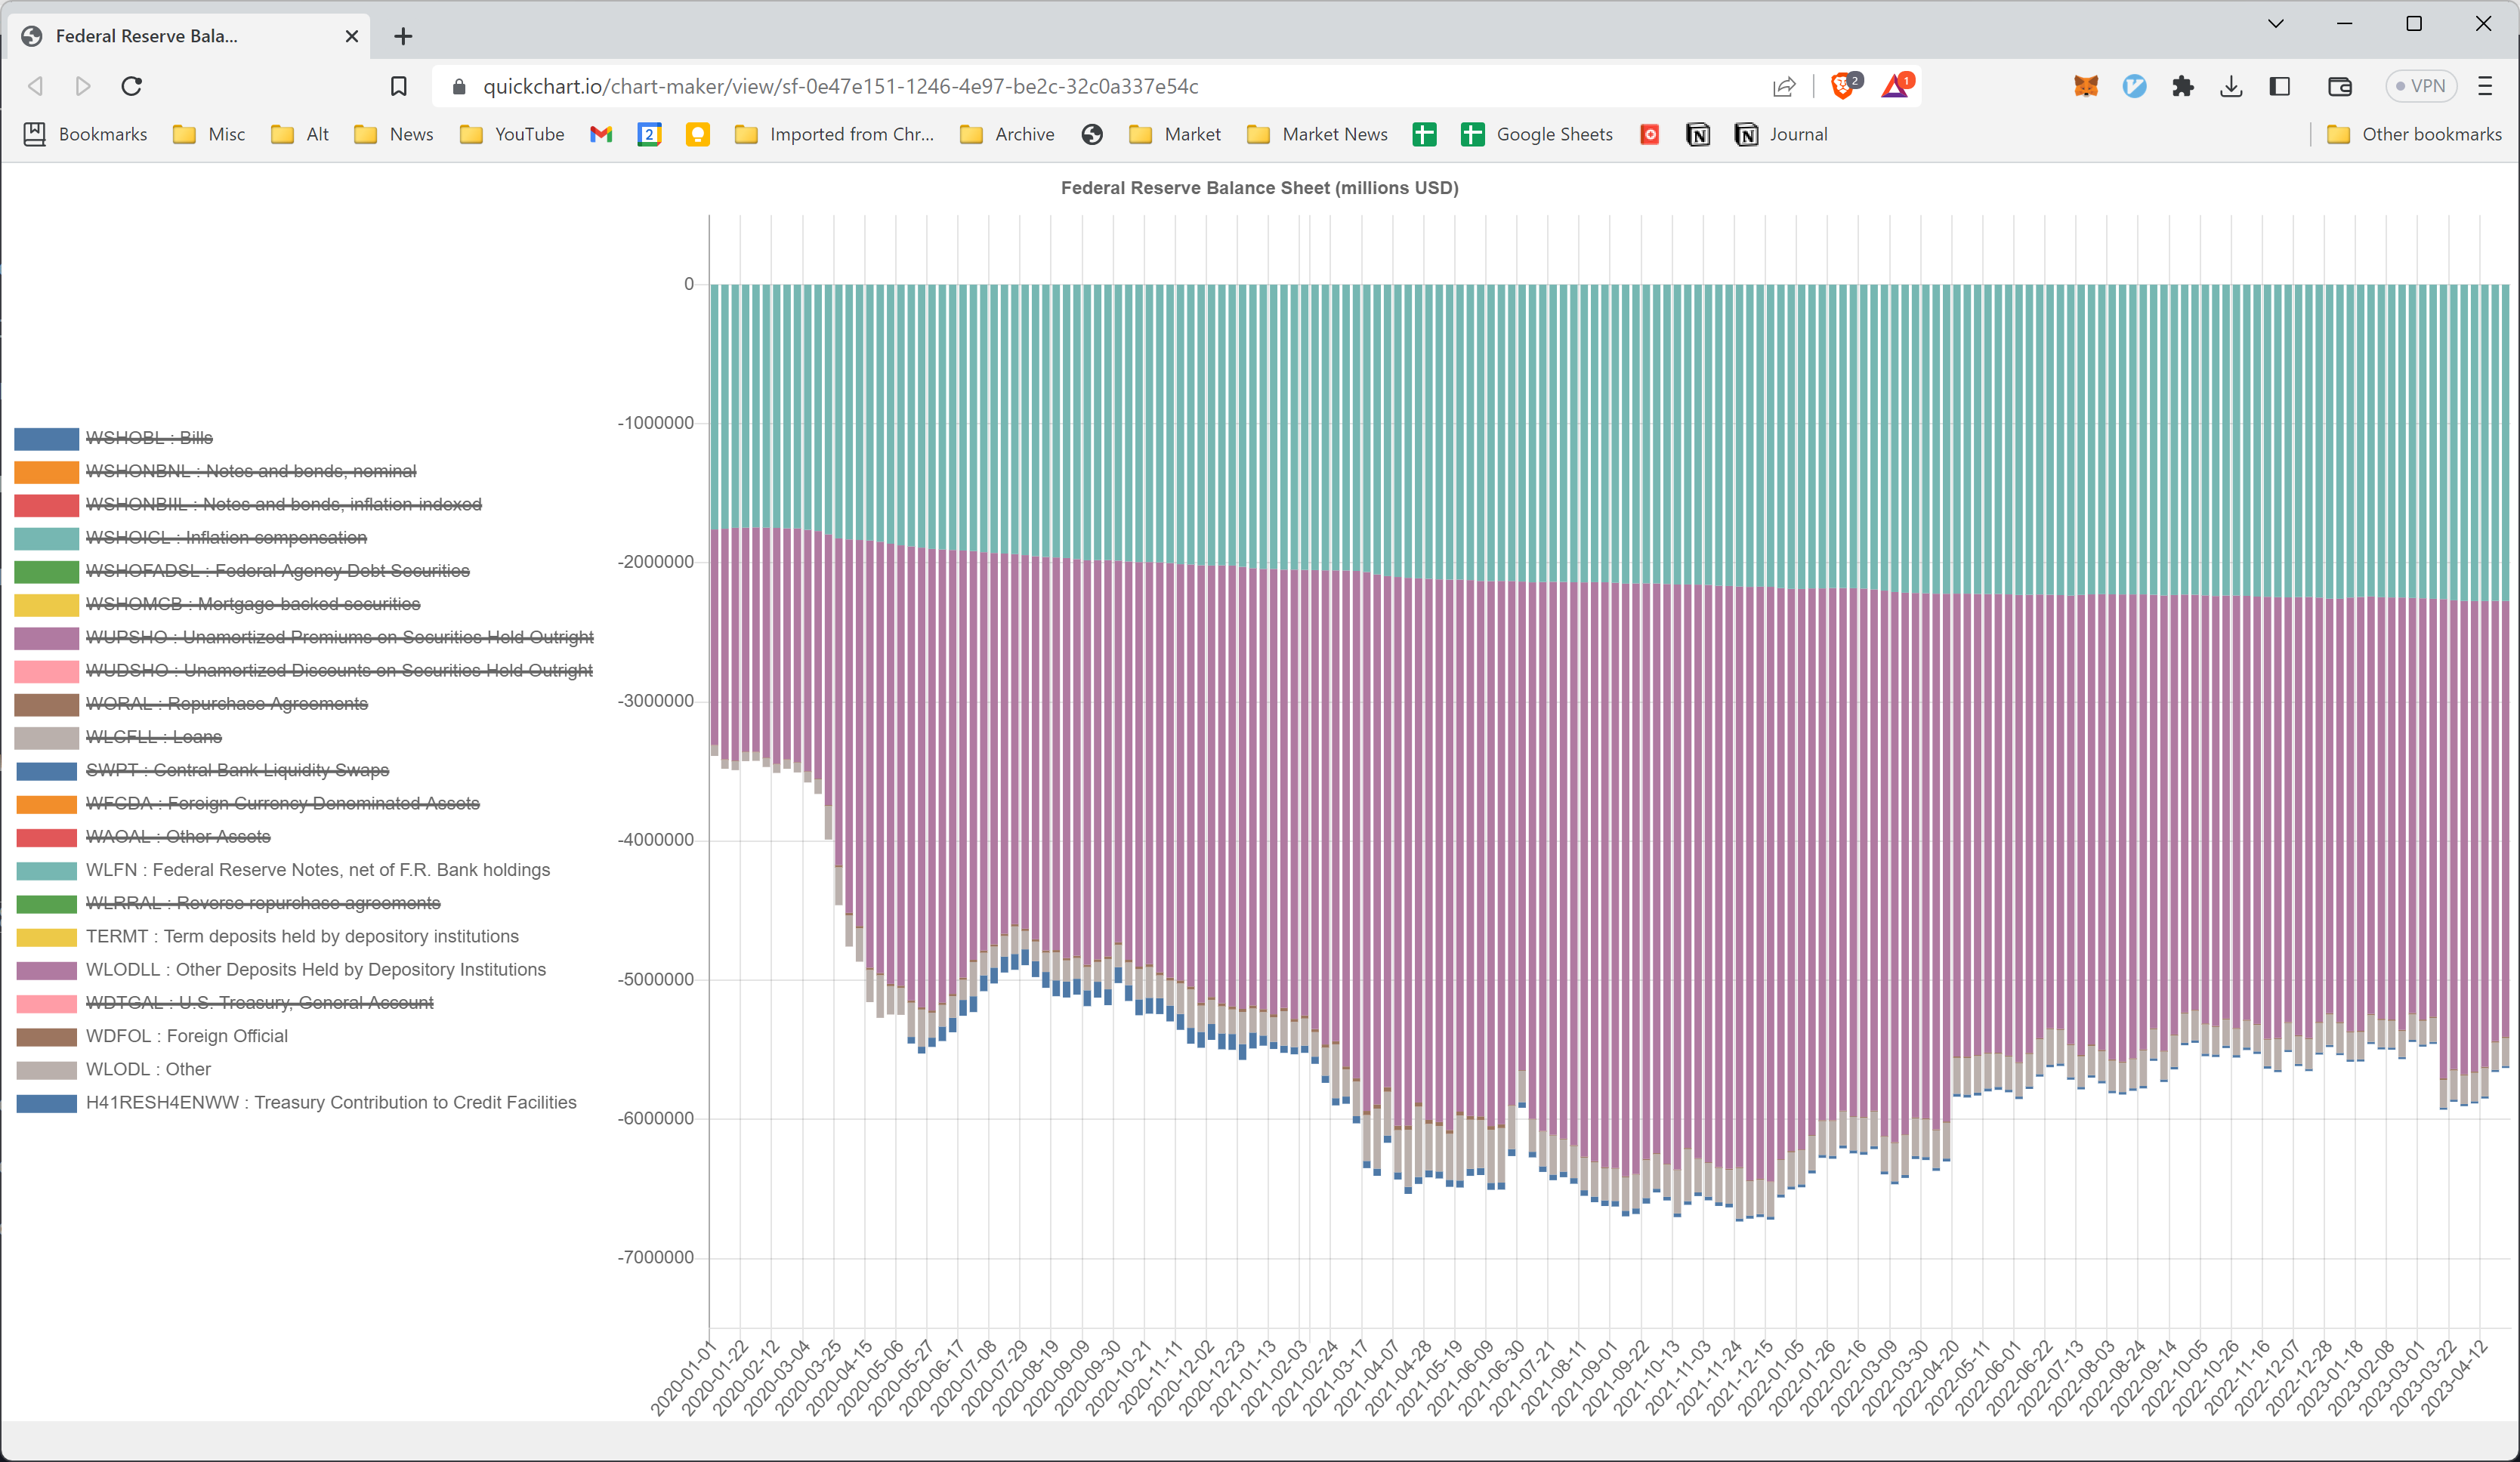
Here's a chart of the balance sheet components. Assets are above zero. Liabilities and Capital are below zero.
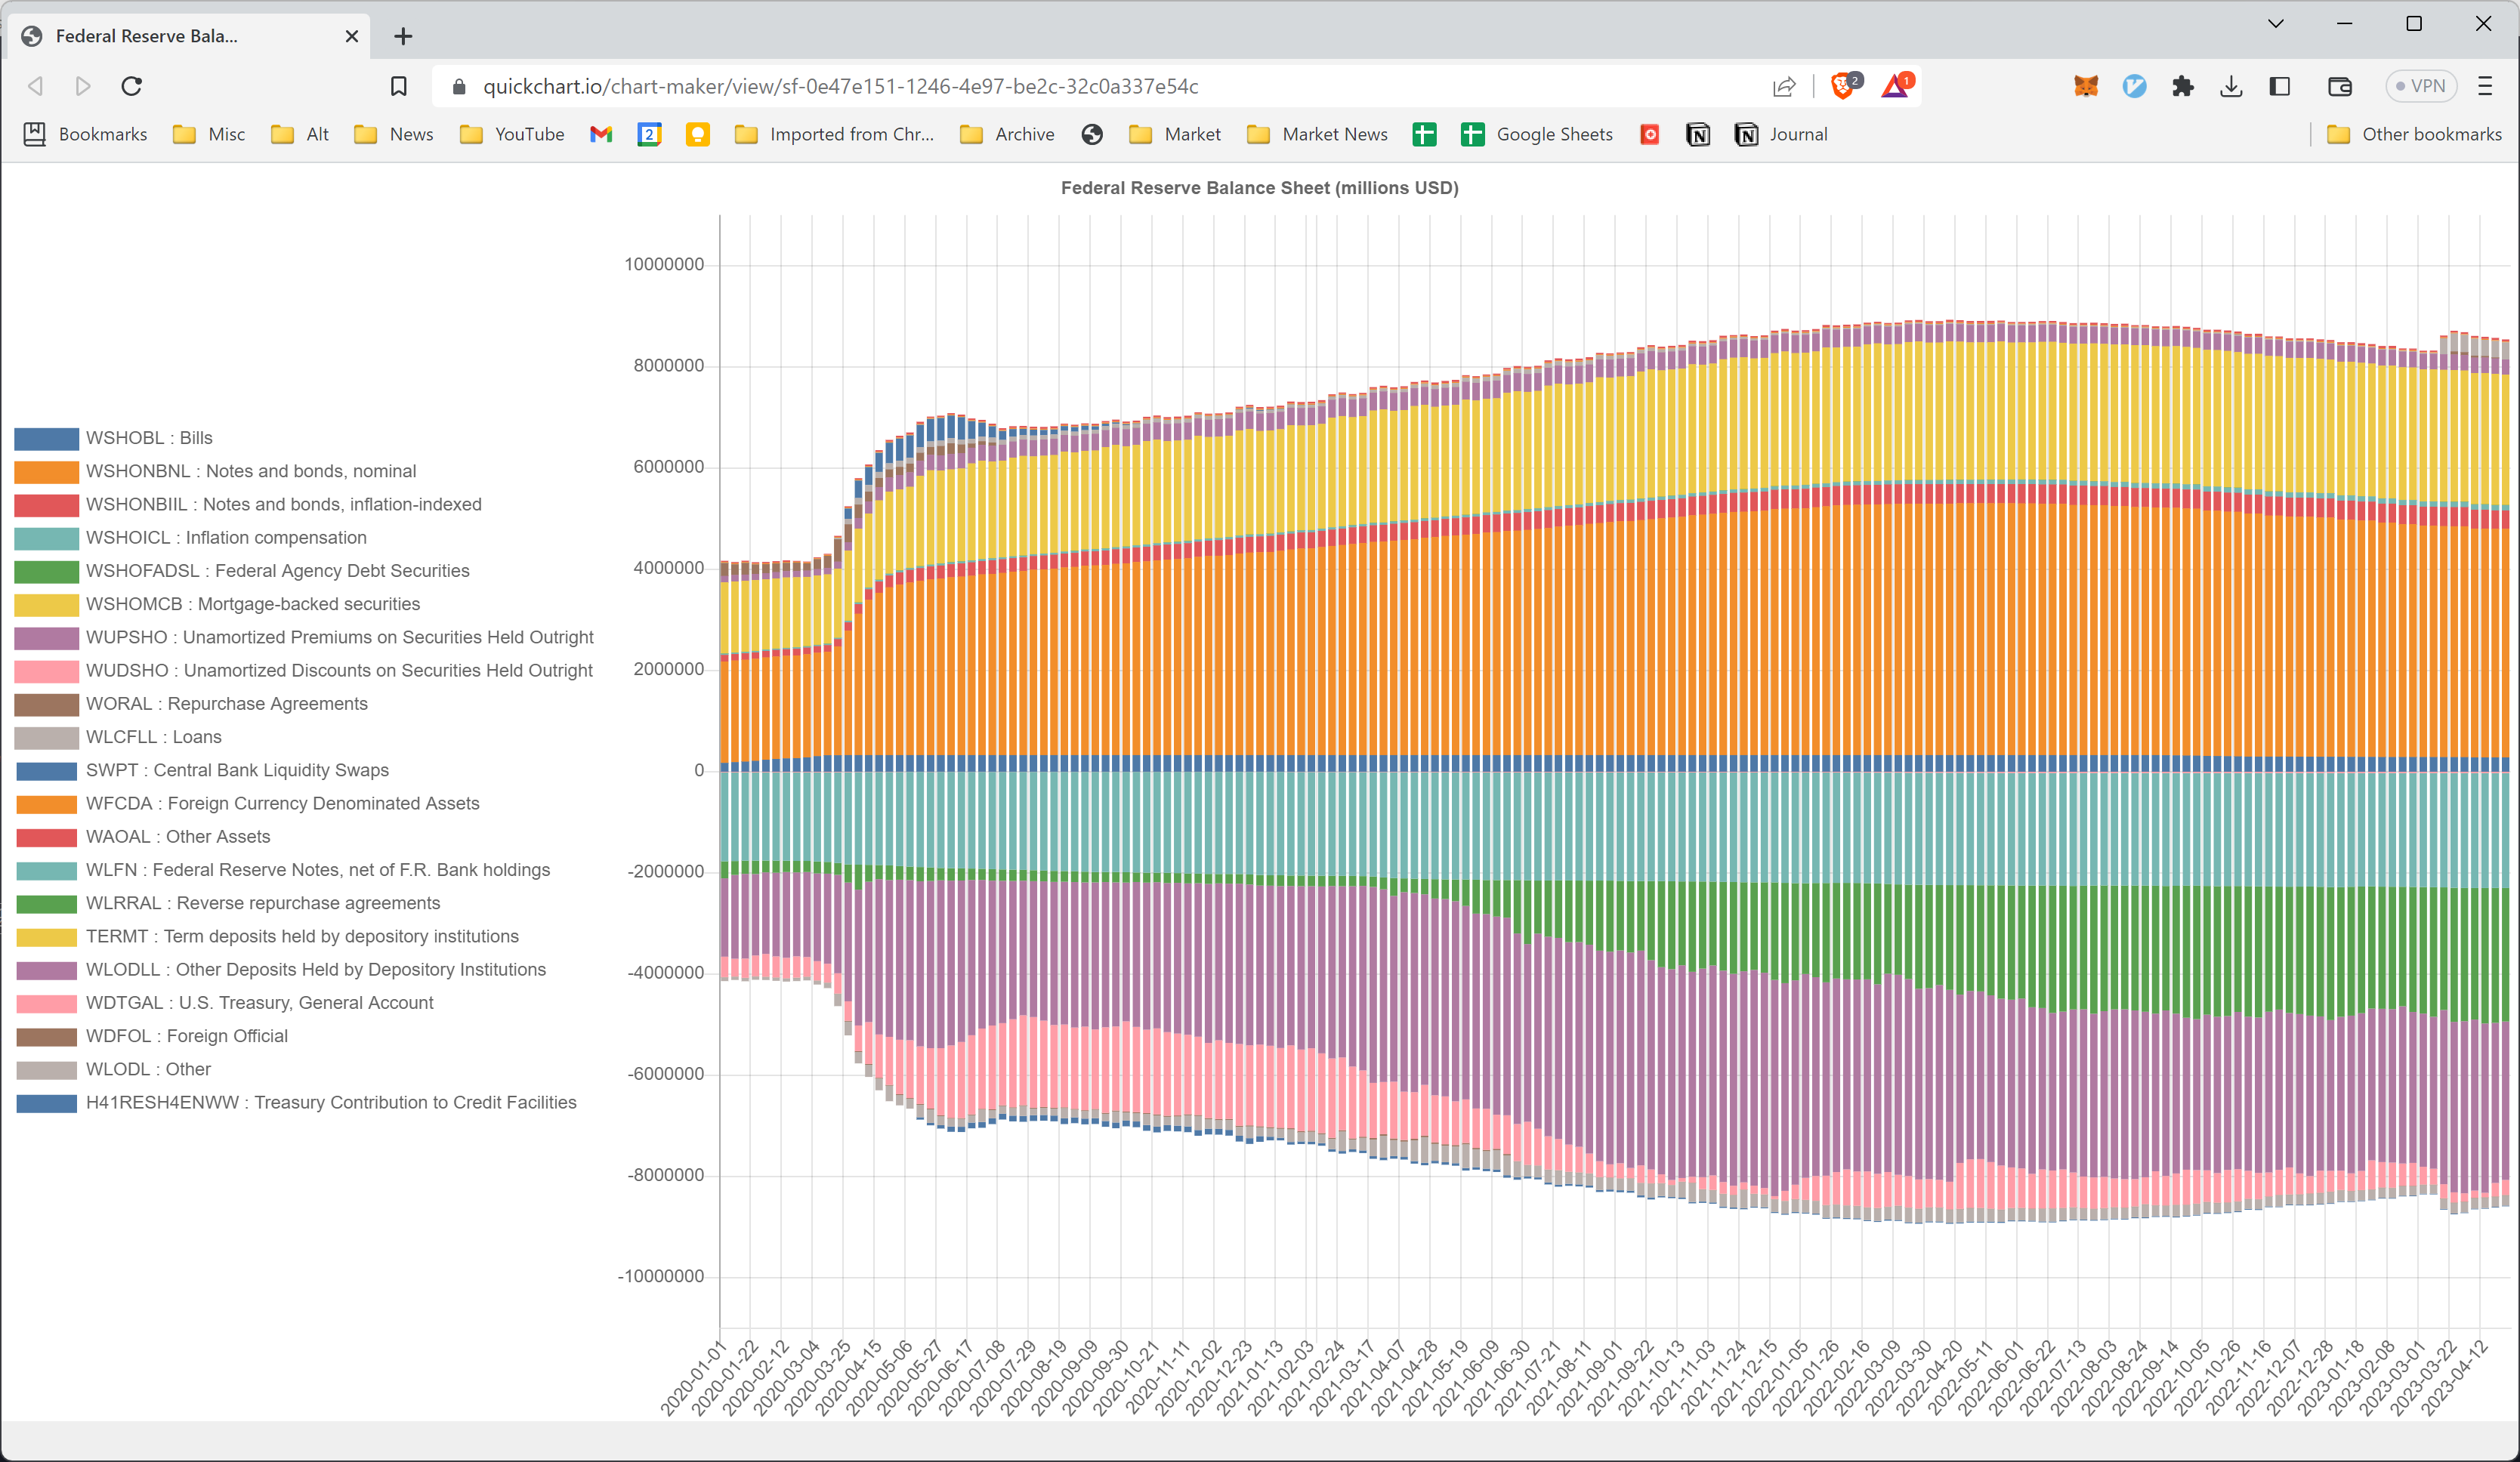
So the Net Liquidity formula, geometrically interpreted is
the top half of the chart - RRP - TGA
But that's awkward to imagine. So we can rewrite that as:
the bottom half of the chart - RRP - TGA
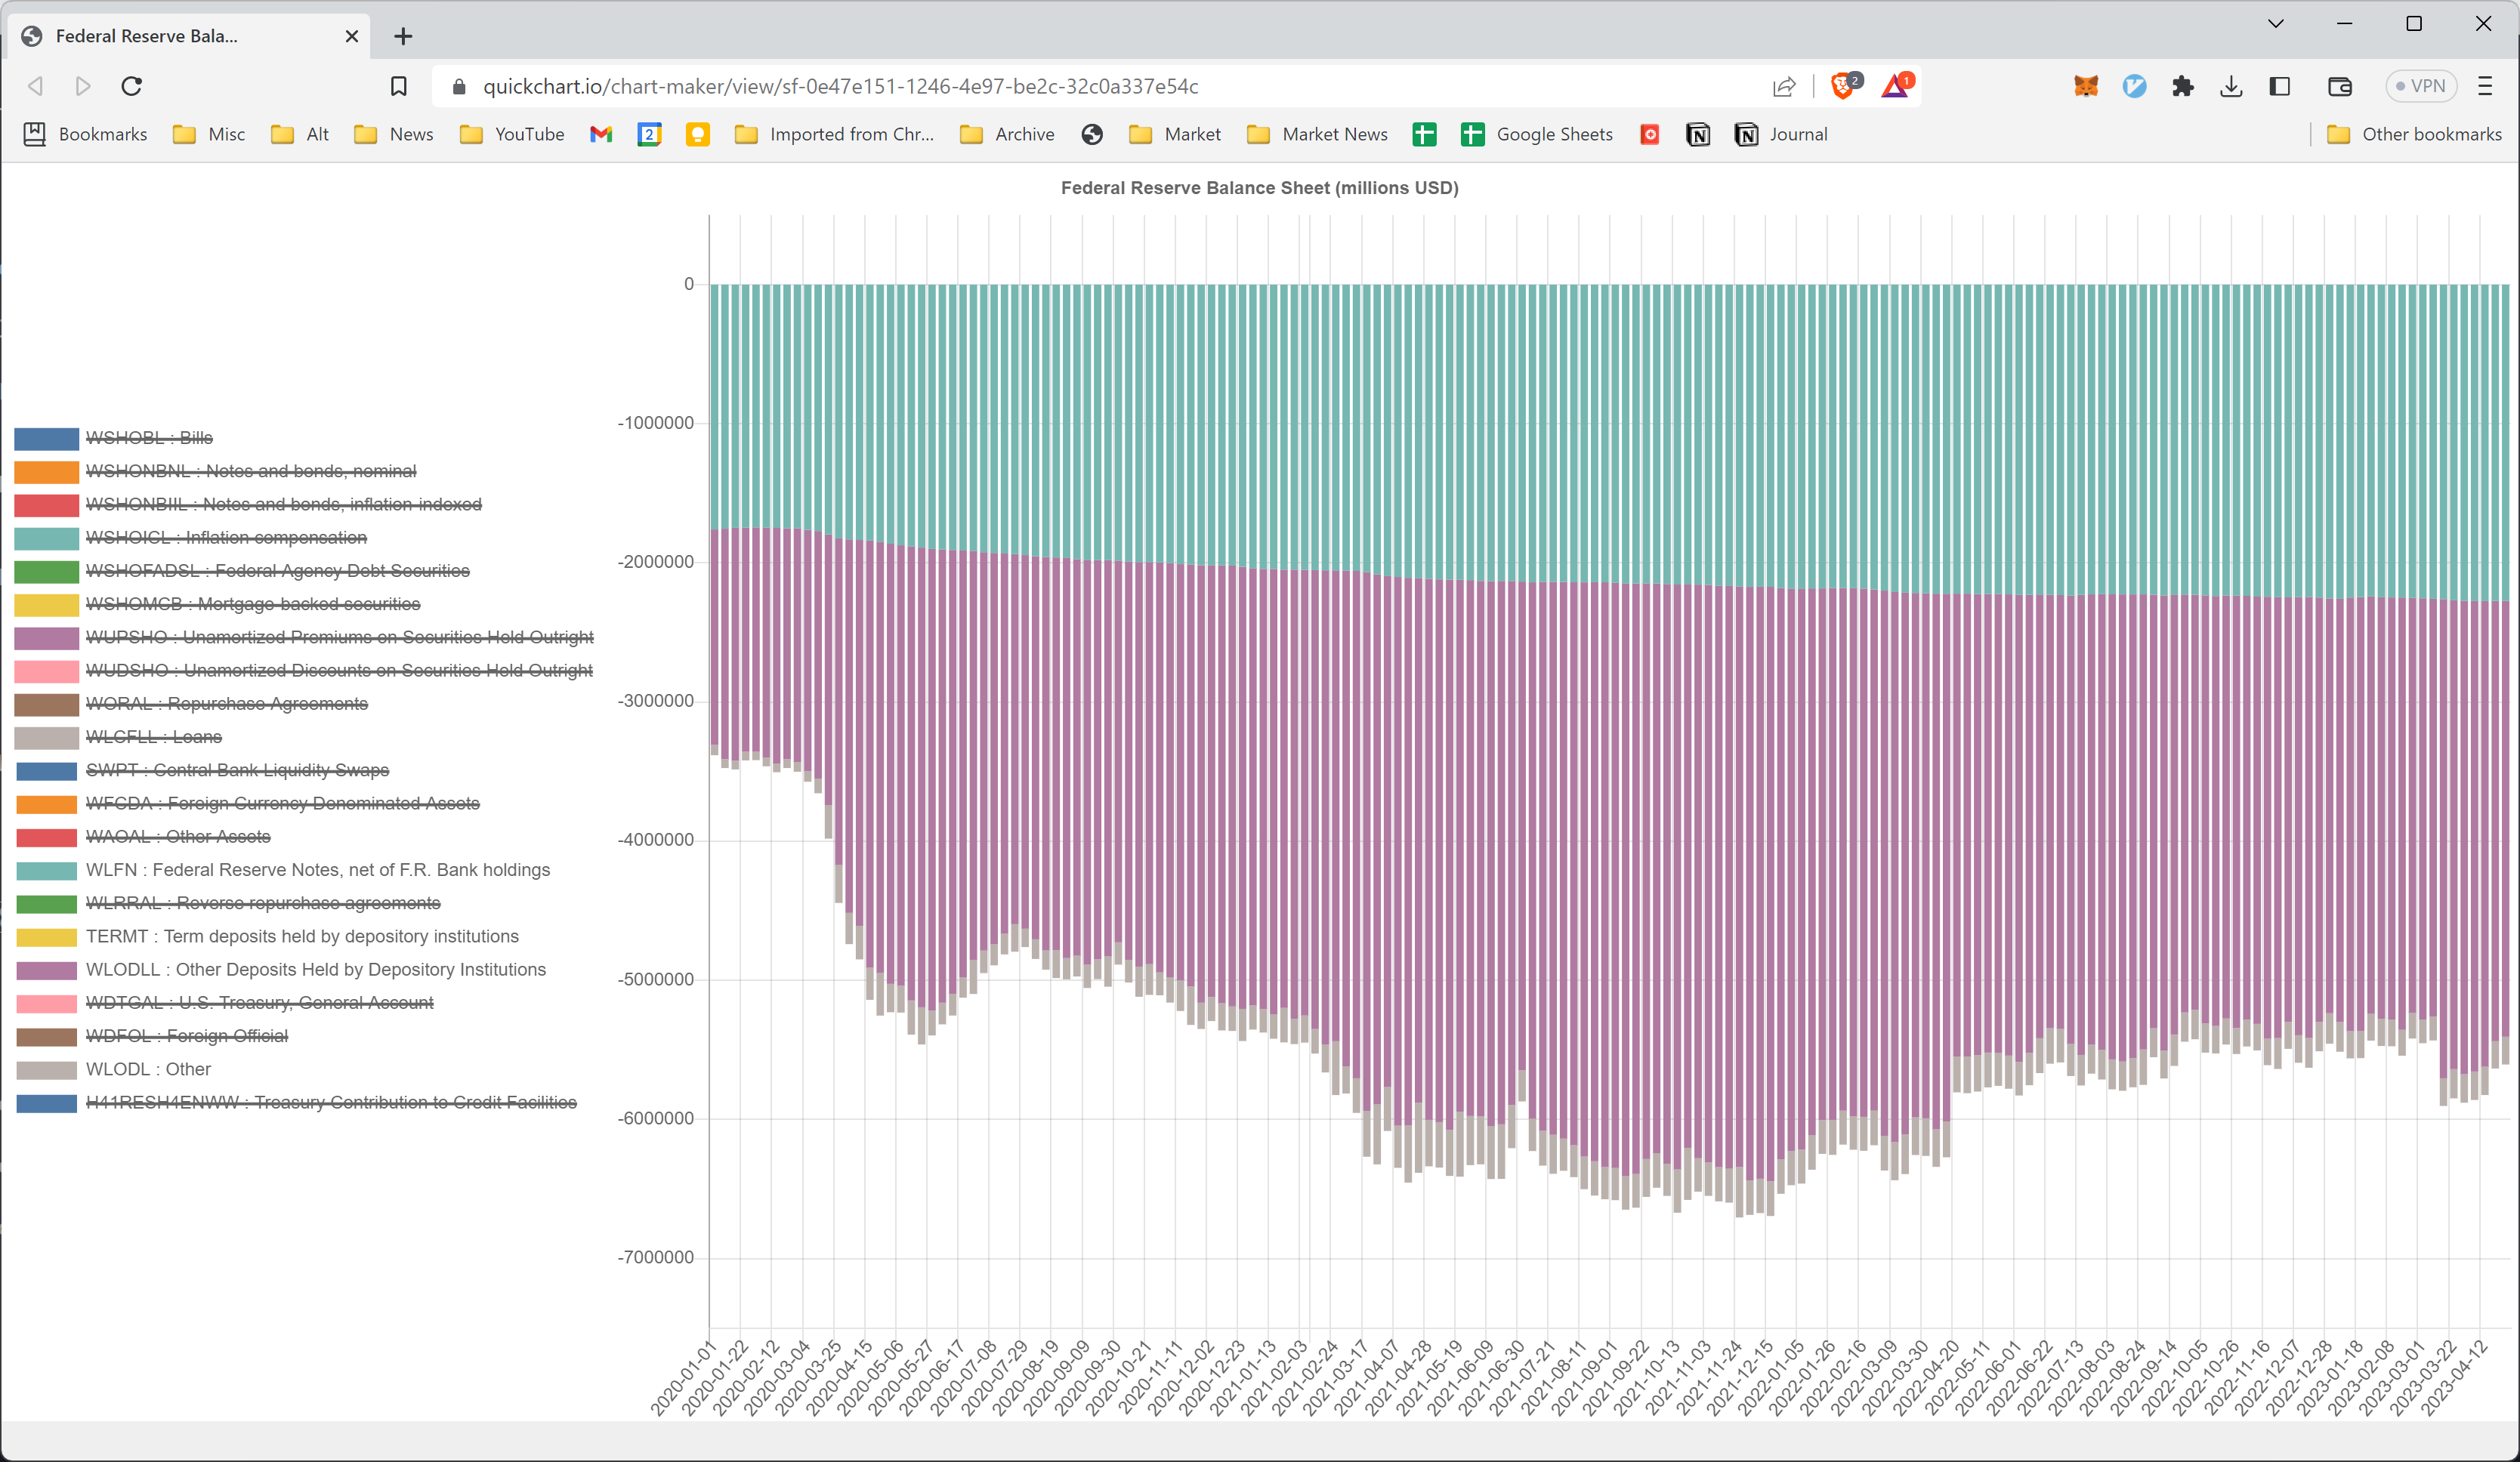
OK, so let's only display the bottom half by turning off the assets:
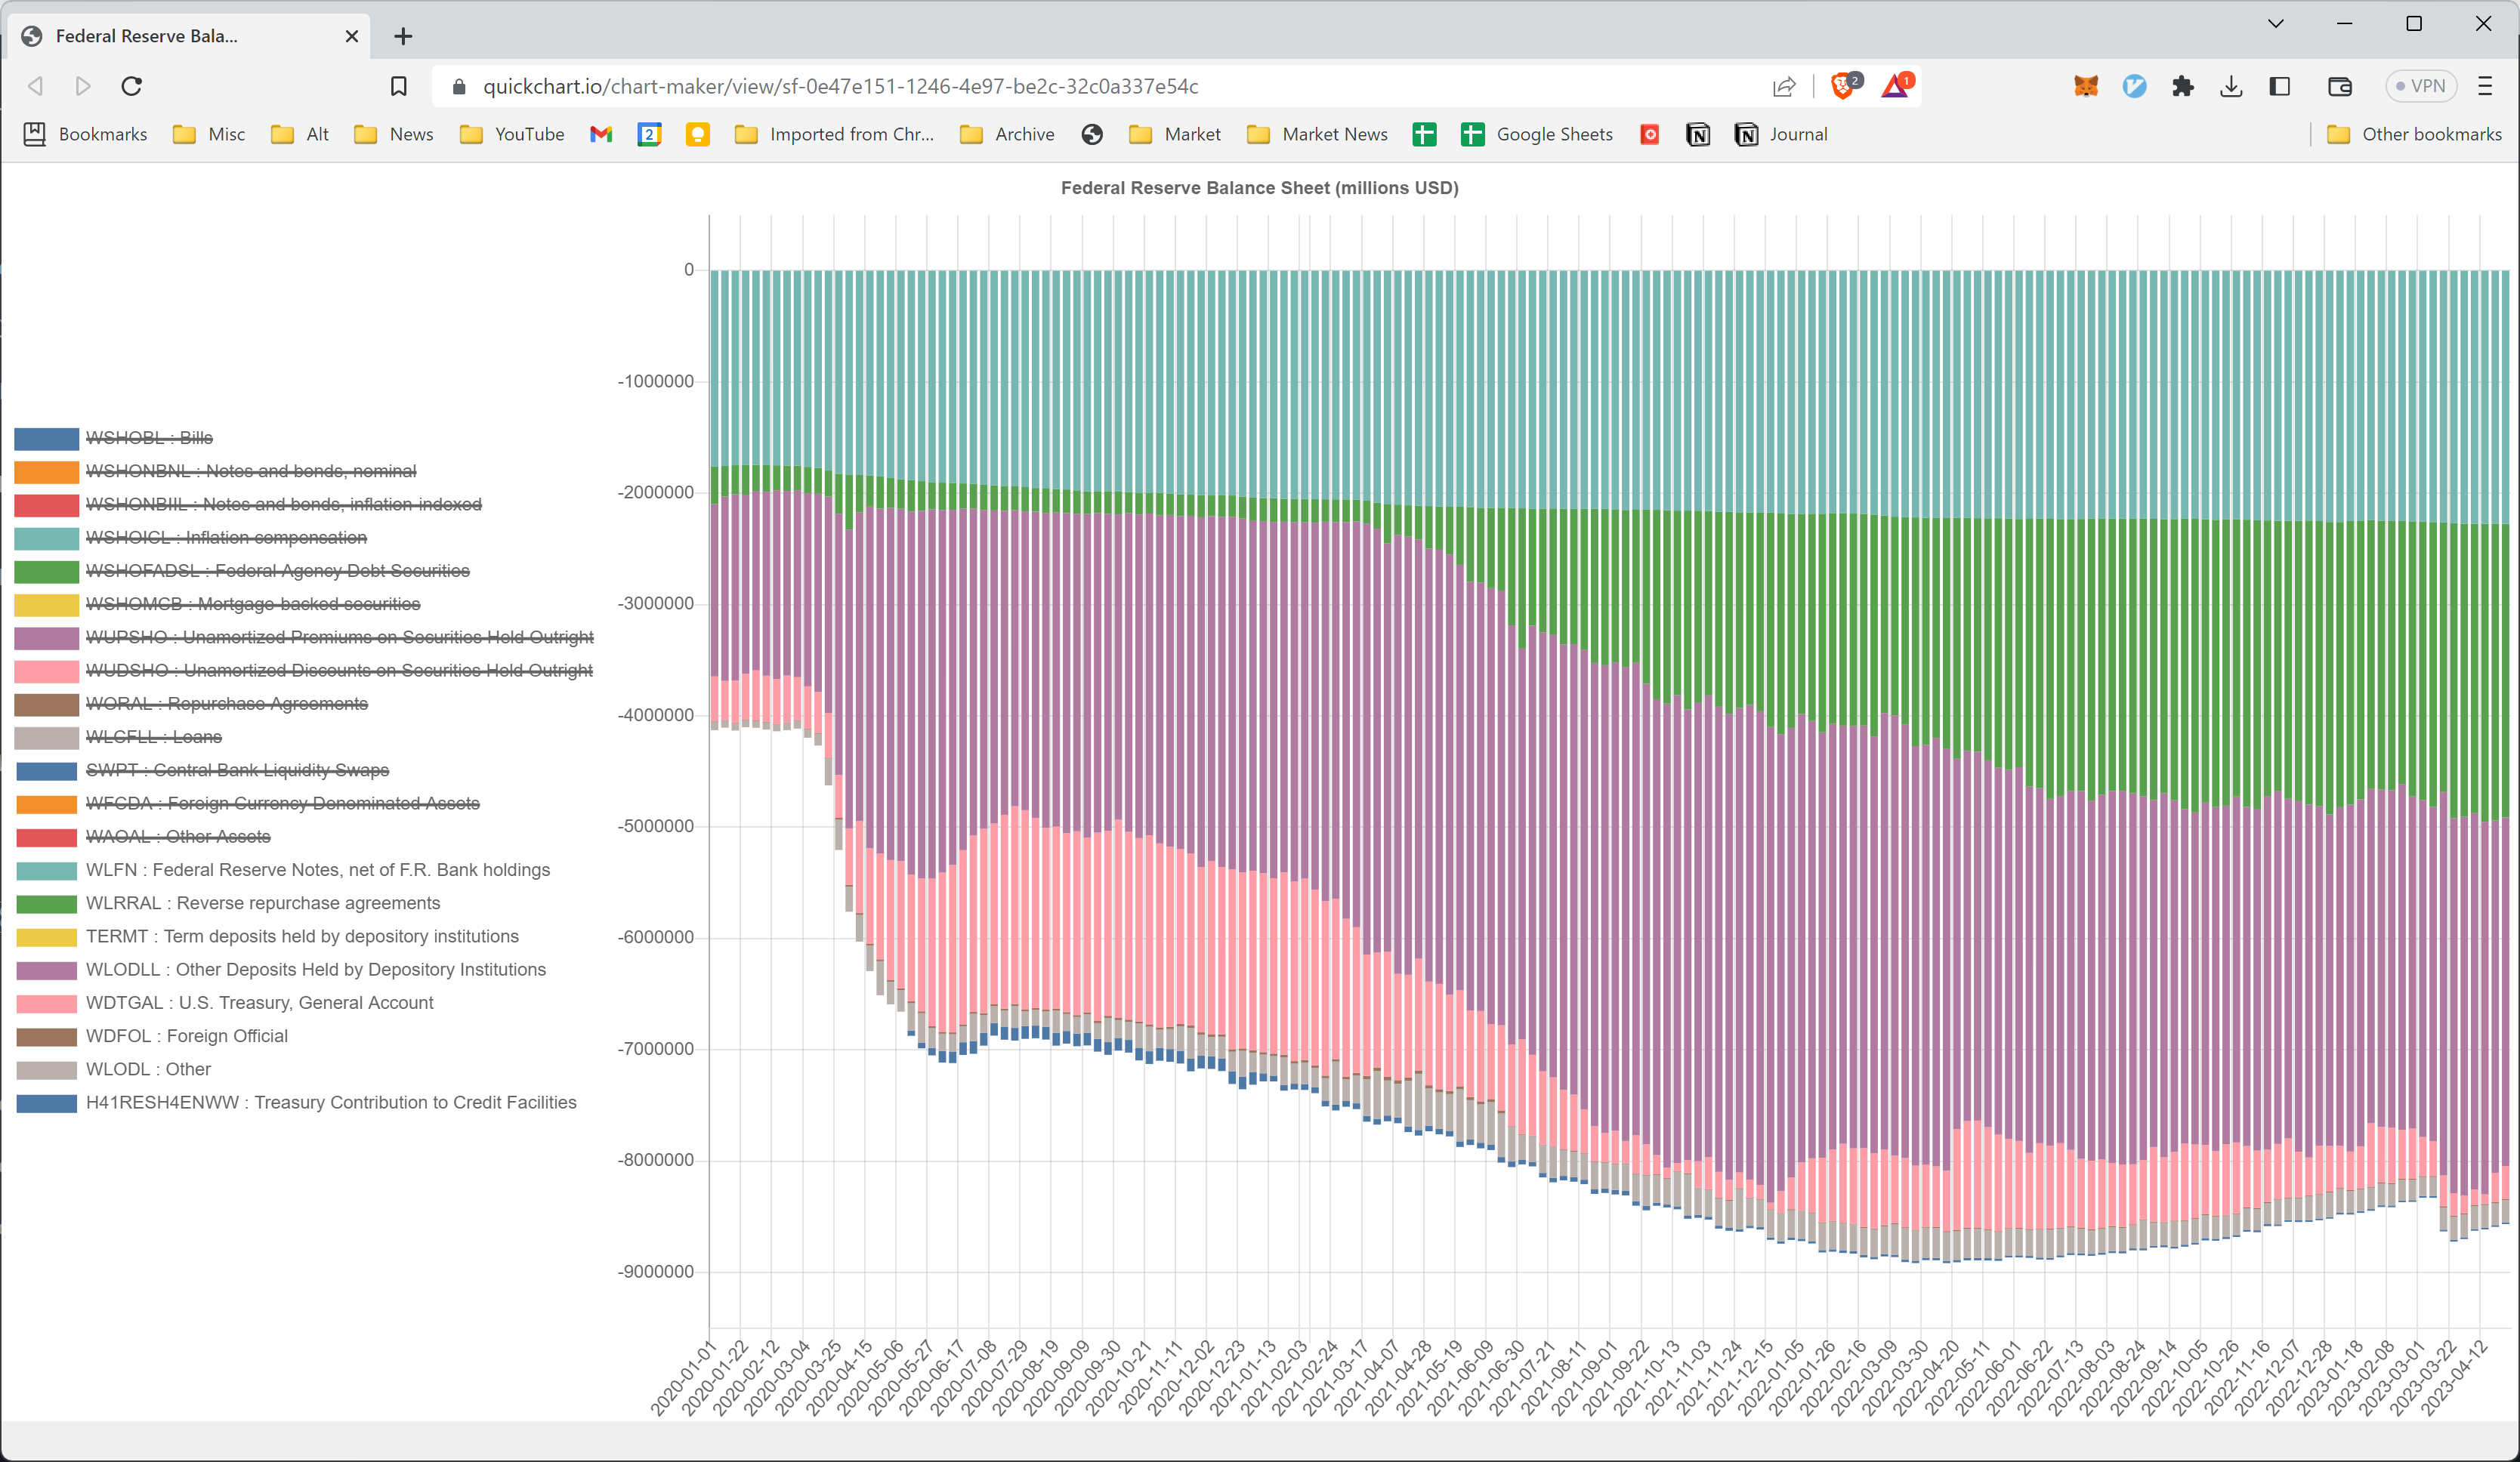
Now, let's subtract RRP and TGA by turning those off:
Let's also turn off the low amount items:
If you really want to push it, we can also turn off WLFN which isn't extremely volatile, though it has increased a lot over time.
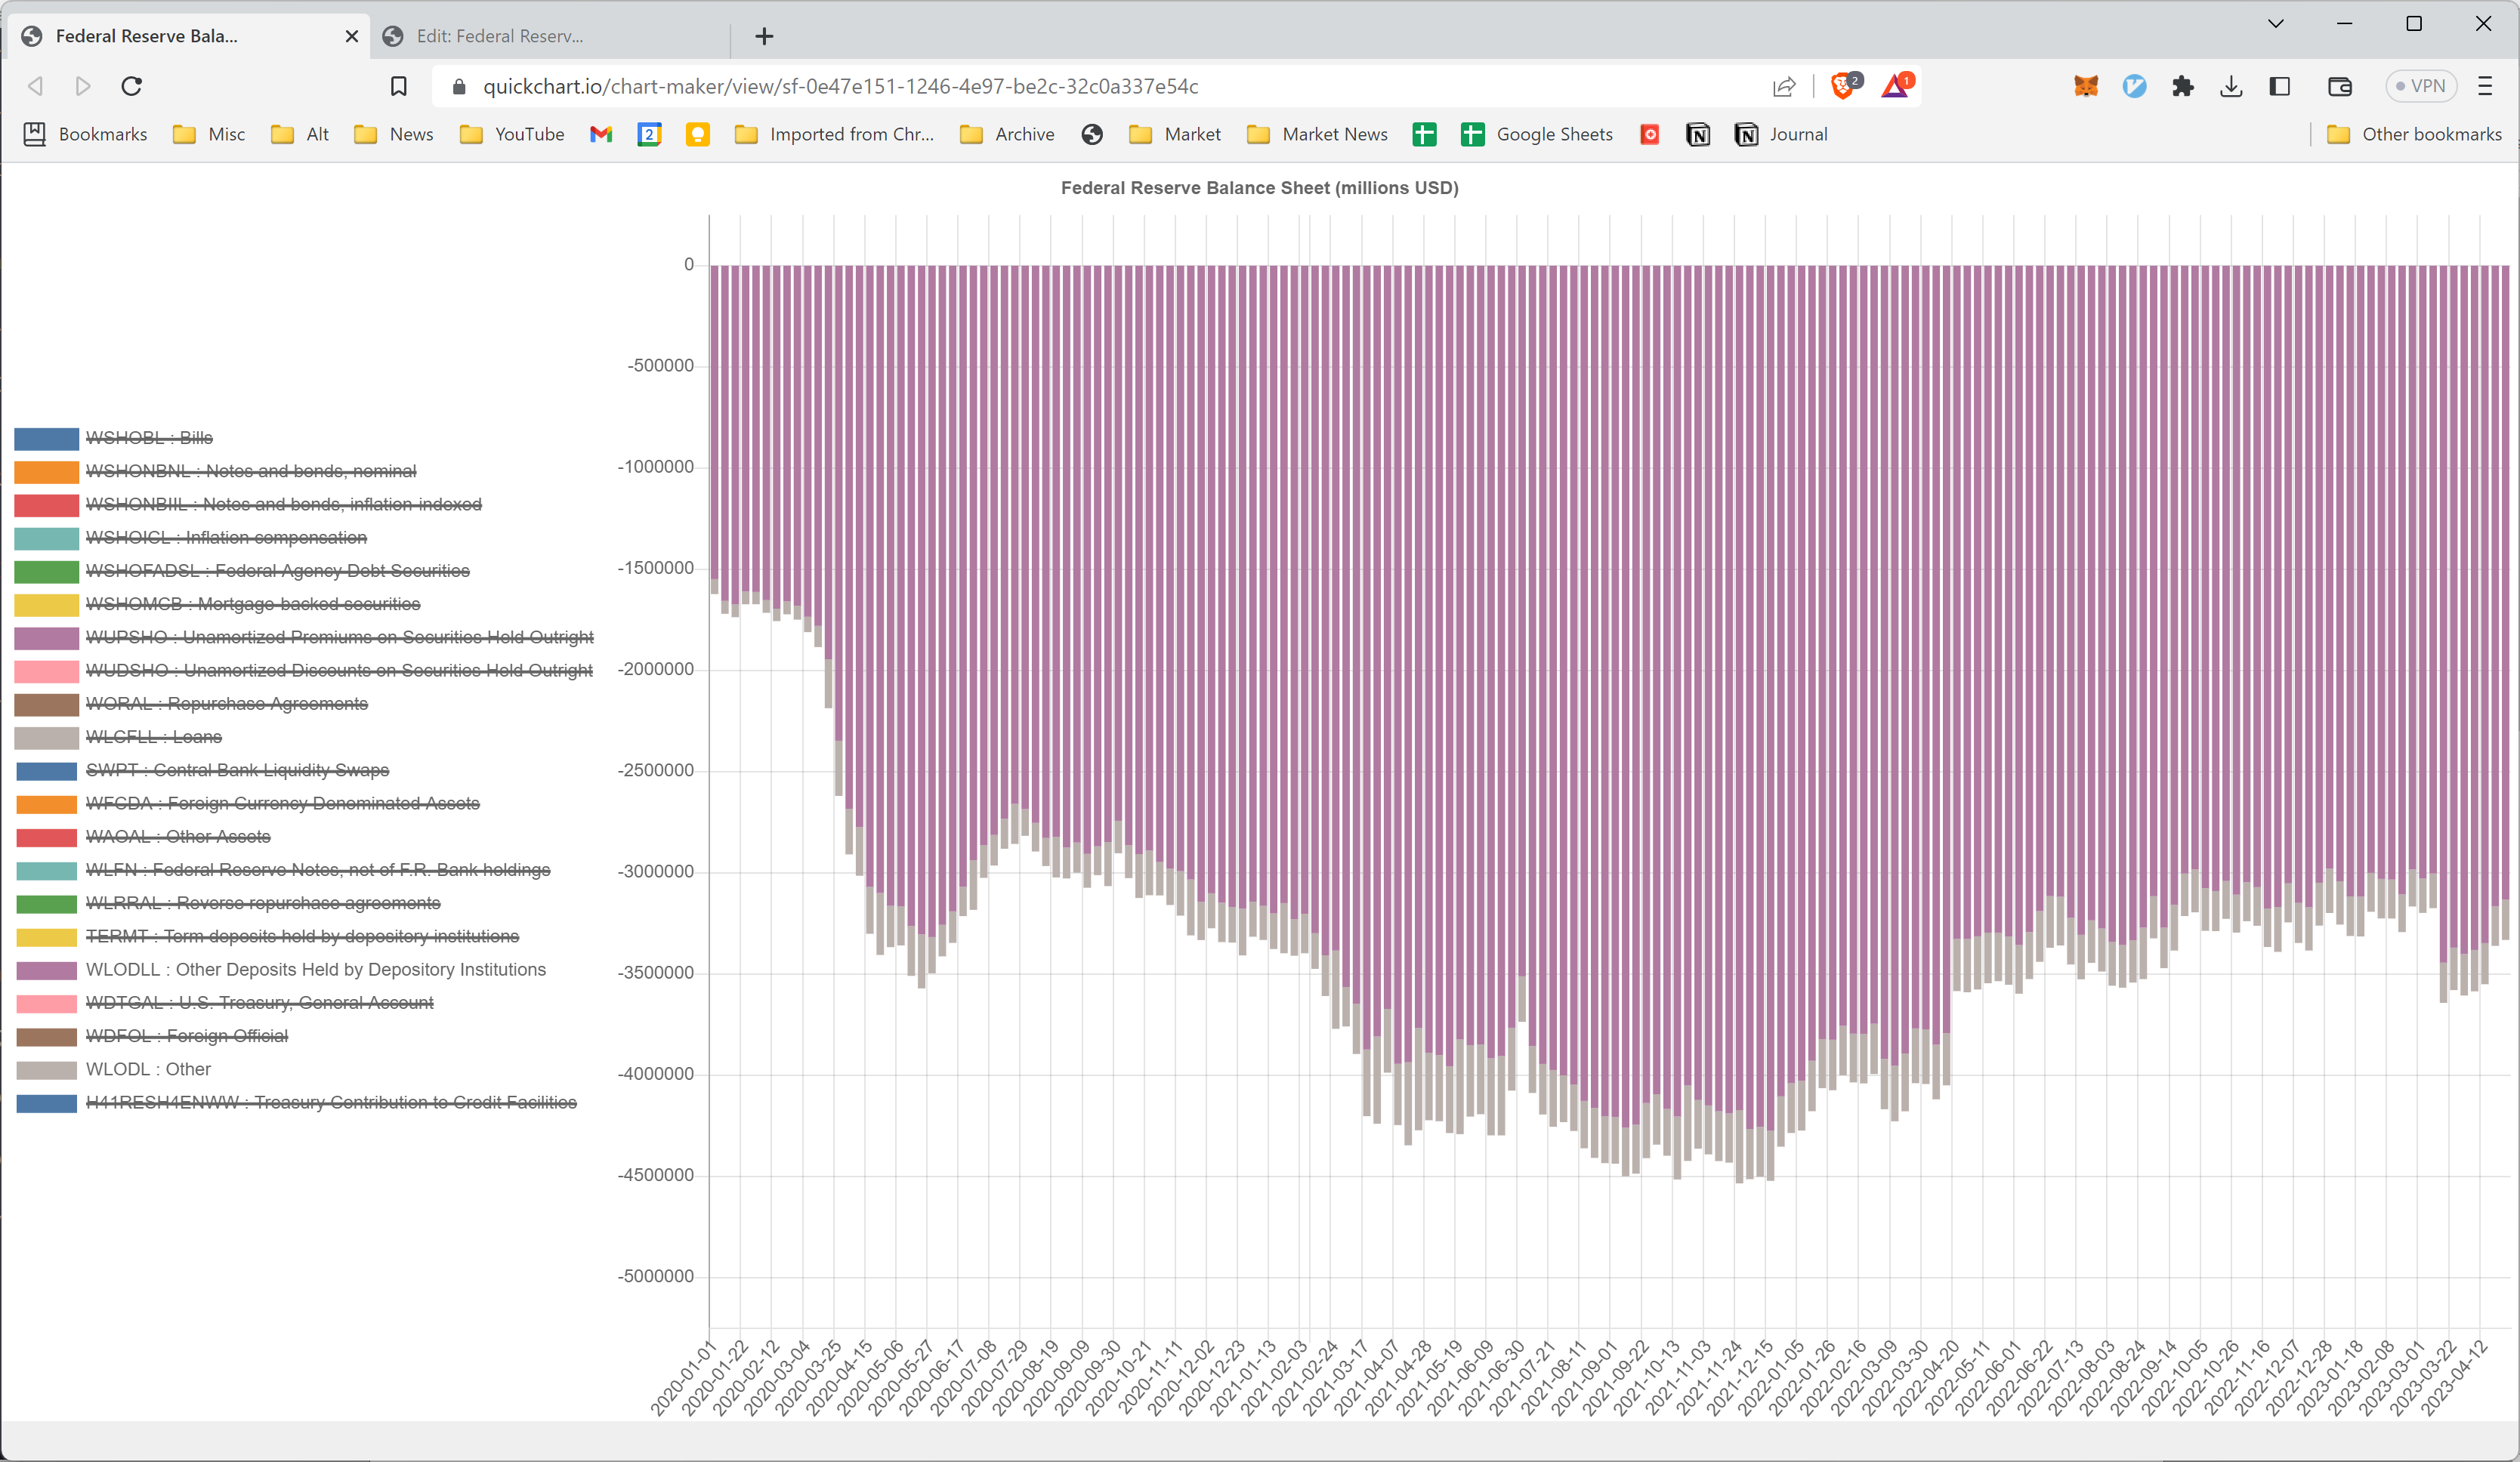
WLODL is a relatively small amount, so let's remove that.
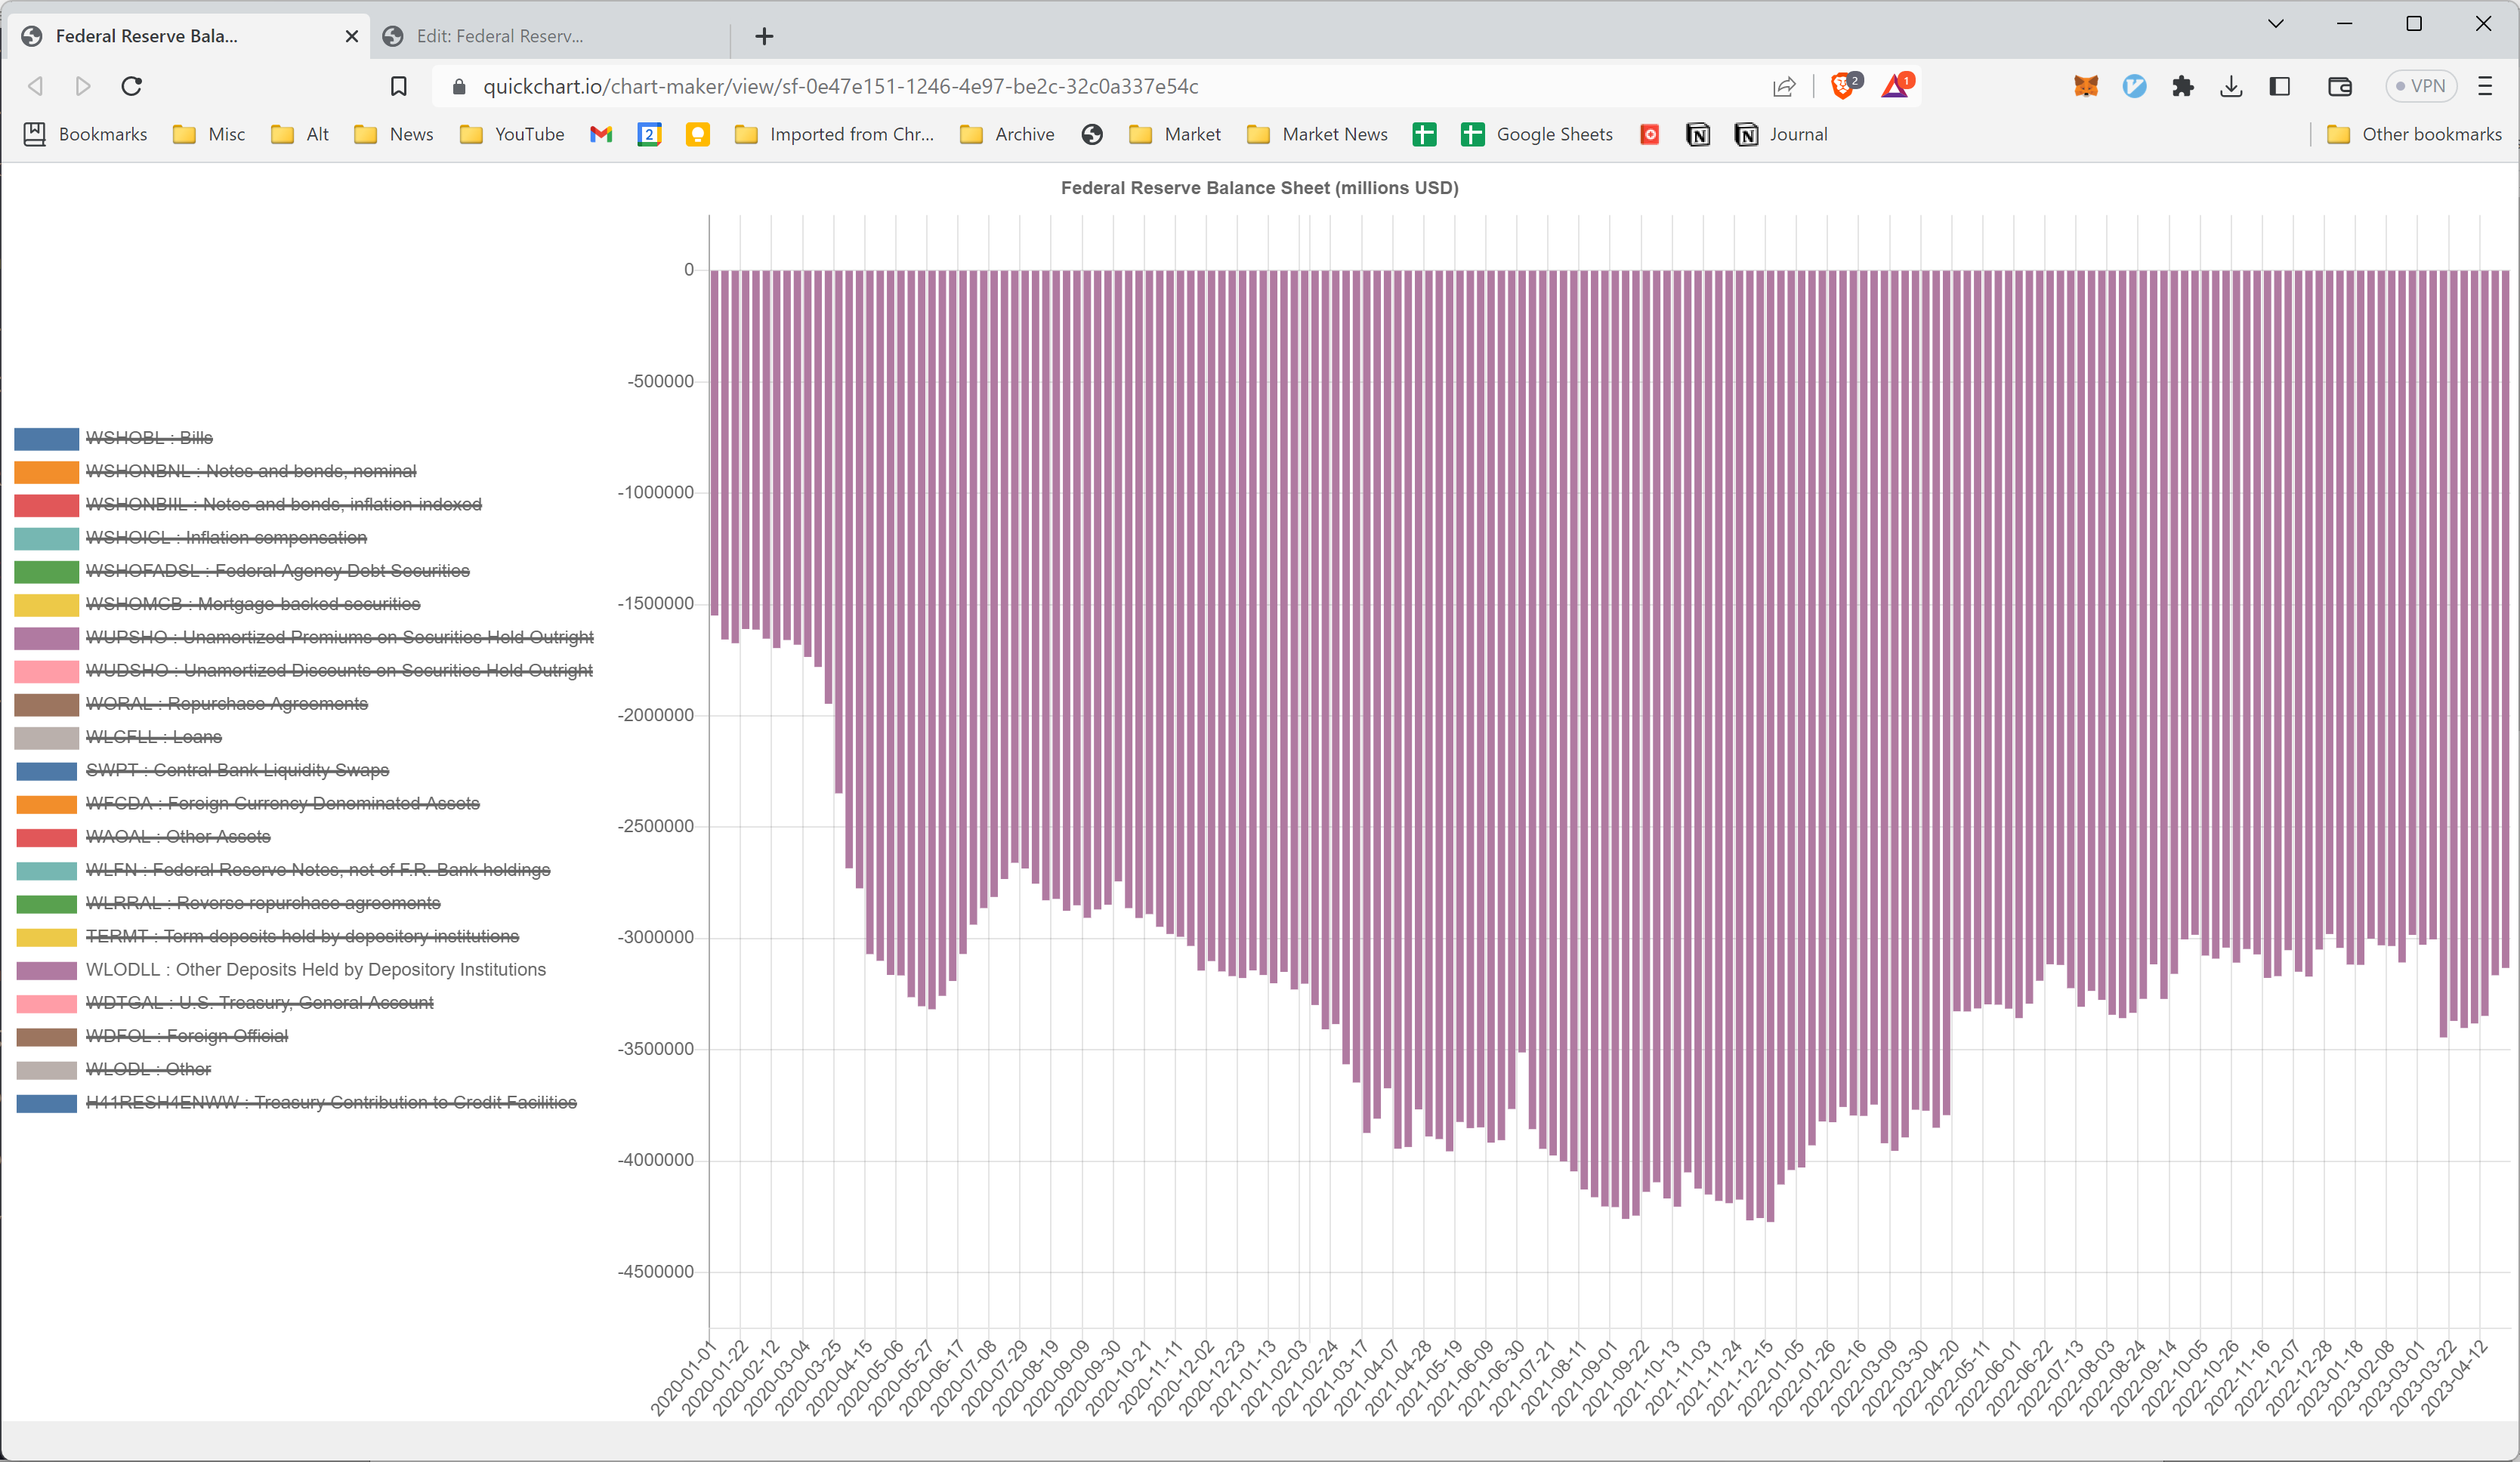
So we're left with just WLODLL : Other deposits held by depository institutions.
So in theory, that should correlate closely to the original Net Liquidity formula.
Let's compare them in TradingView.
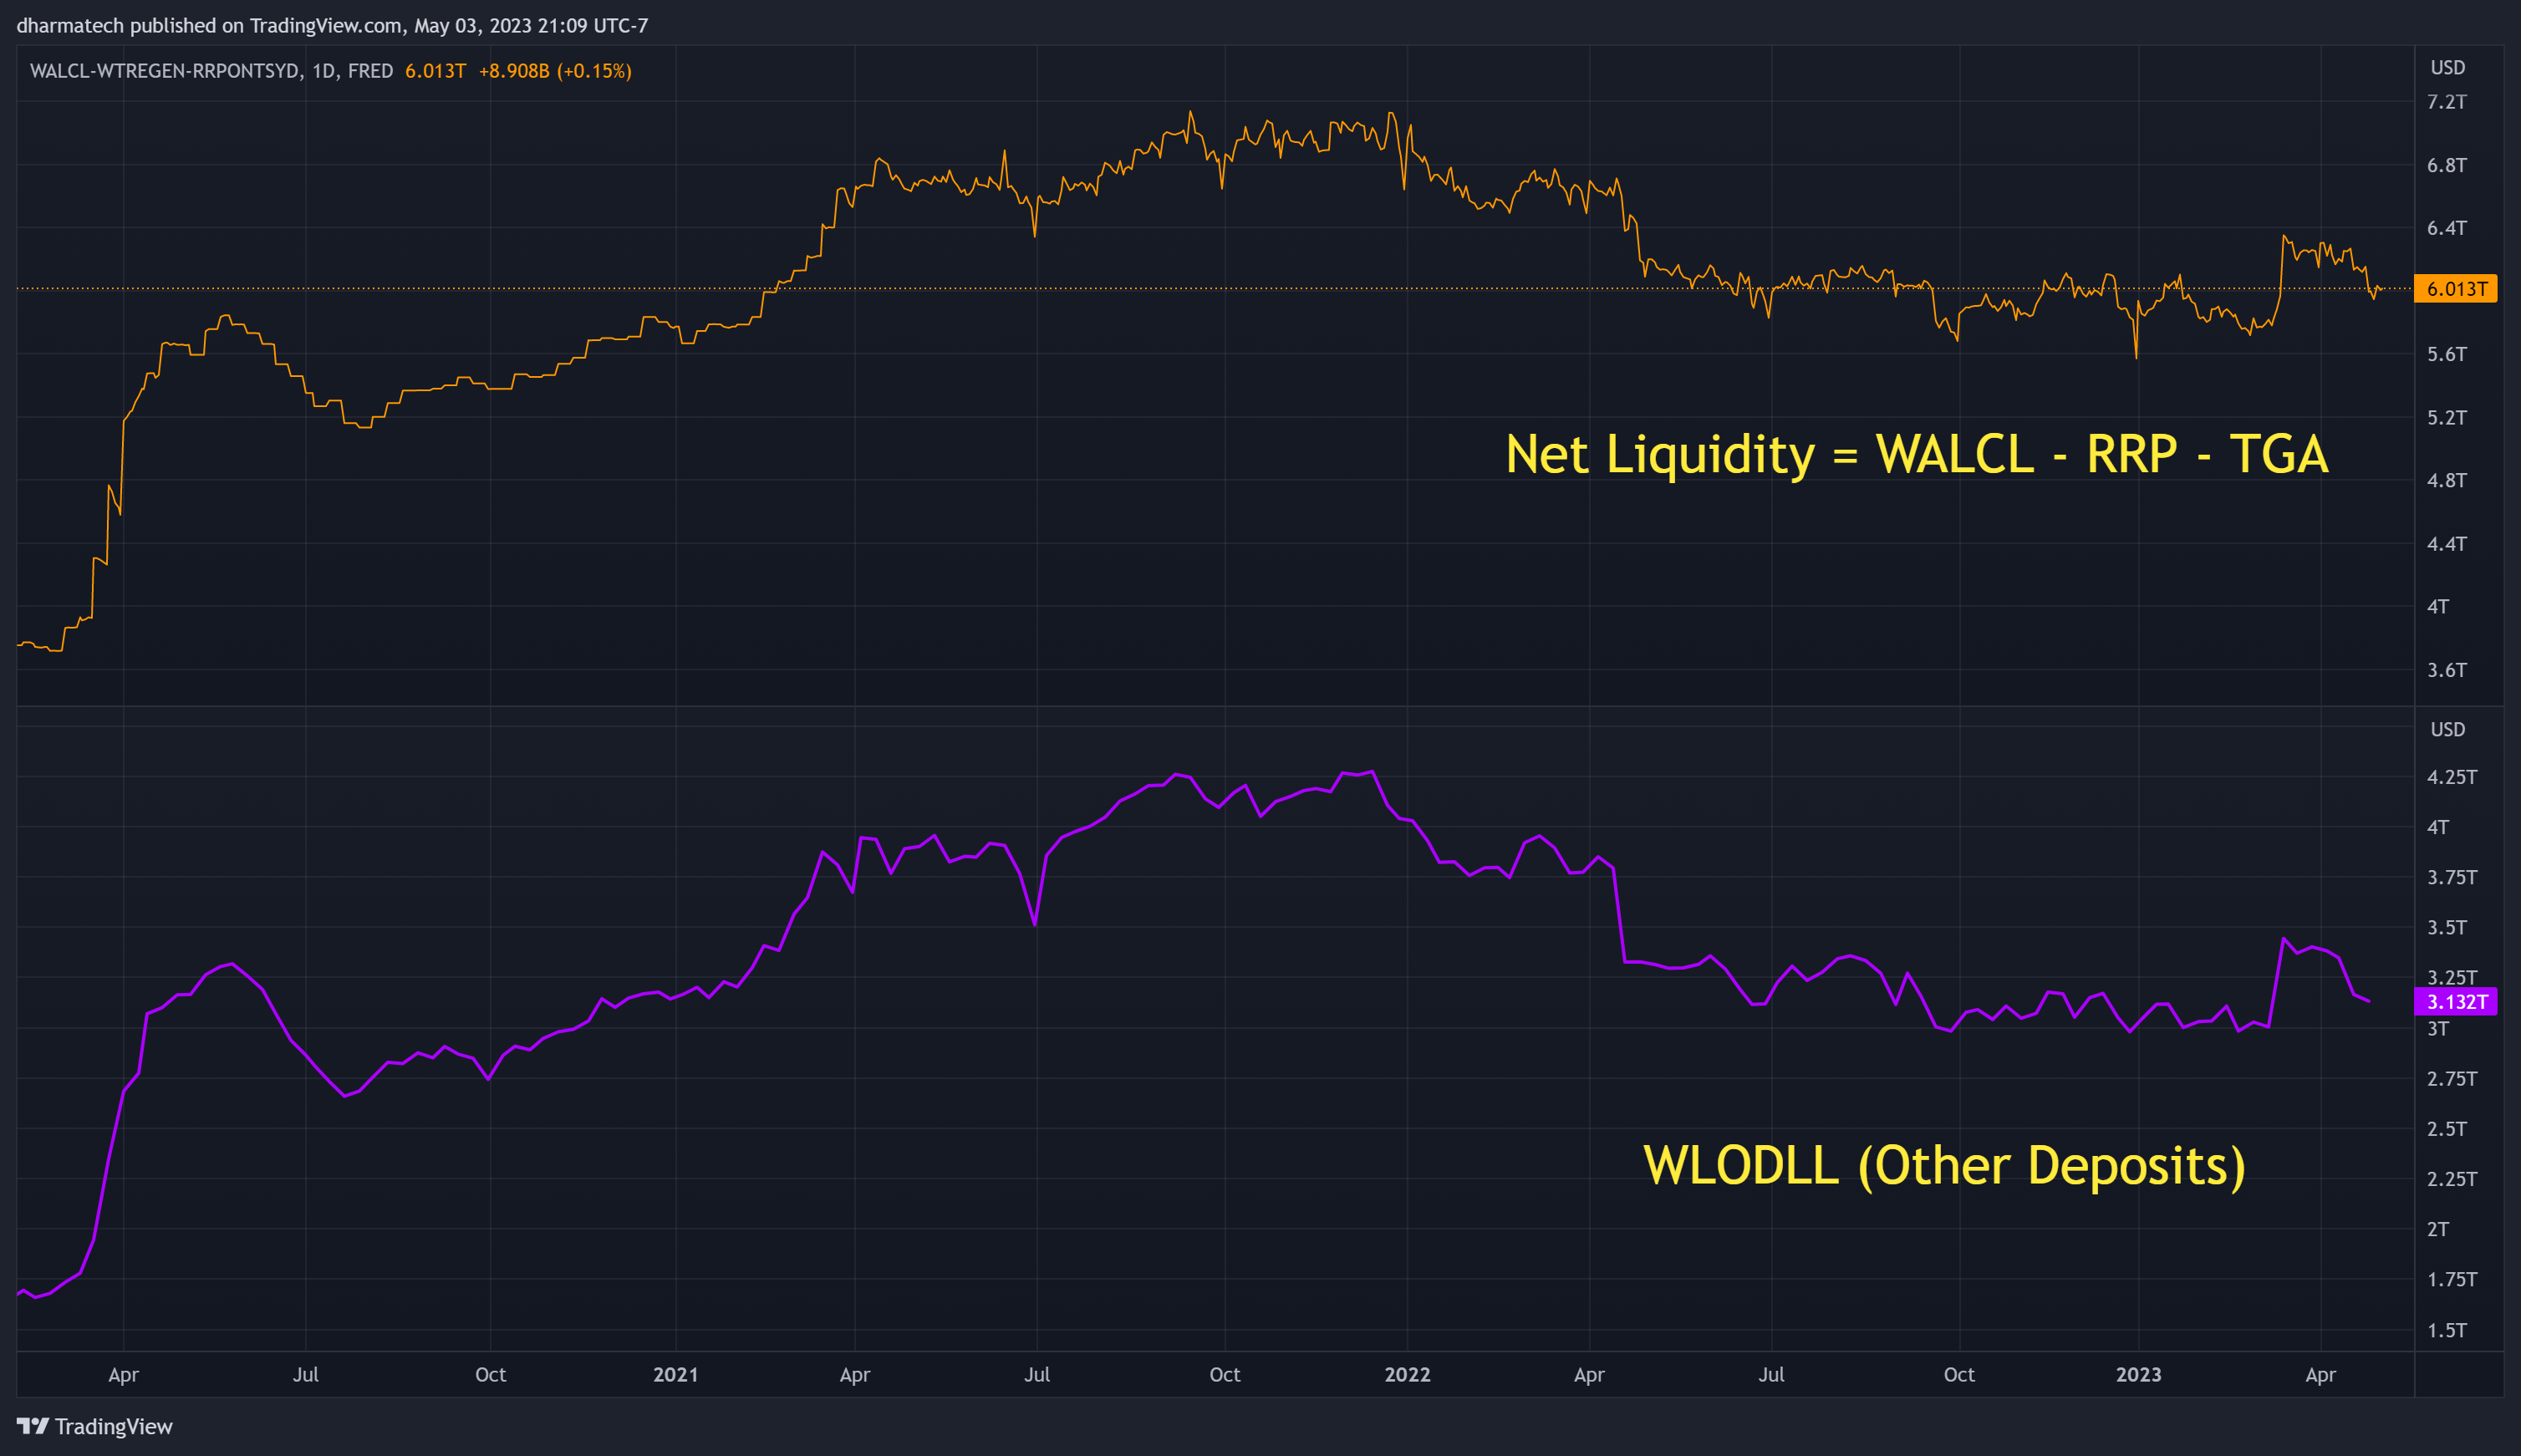
While some fidelity is lost in the WLODLL chart, they are pretty close.
If things shift between RRP and TGA, nothing happens to Net Liquidity.
It's when things shift into or out of WLODLL that the fireworks happens.